Abstract
Our recent studies have demonstrated that mechanical fractionation of tissue structure with sharply demarcated boundaries can be achieved using short (<20 μs), high intensity ultrasound pulses delivered at low duty cycles. We have called this technique histotripsy. Histotripsy has potential clinical applications where noninvasive tissue fractionation and/or tissue removal are desired. The primary mechanism of histotripsy is thought to be acoustic cavitation, which is supported by a temporally changing acoustic backscatter observed during the histotripsy process. In this paper, a fast-gated digital camera was used to image the hypothesized cavitating bubble cloud generated by histotripsy pulses. The bubble cloud was produced at a tissue-water interface and inside an optically transparent gelatin phantom which mimics bulk tissue. The imaging shows the following: 1) Initiation of a temporally changing acoustic backscatter was due to the formation of a bubble cloud; 2) The pressure threshold to generate a bubble cloud was lower at a tissue-fluid interface than inside bulk tissue; and 3) at higher pulse pressure, the bubble cloud lasted longer and grew larger. The results add further support to the hypothesis that the histotripsy process is due to a cavitating bubble cloud and may provide insight into the sharp boundaries of histotripsy lesions.
I. Introduction
Tissue disruption using ultrasound-induced cavitation [1]–[9] and shockwaves [10], [11] has been observed by many researchers. Our recent investigations have shown that high intensity pulsed ultrasound delivered at low duty cycles (0.1–5%) can achieve extensive mechanical fractionation of soft tissue. The acoustic pressures effective for tissue fractionation are similar to those found in lithotripter shockwave pulses. This technique can be considered as soft tissue lithotripsy, which we call “histotripsy.” Unlike lithotripsy which commonly uses single-cycle pulses, pulses of several acoustic cycles in duration are used in histotripsy. At a tissue-fluid interface, histotripsy produces effective tissue removal resulting in clearly demarcated perforations [12]. In bulk tissue, histotripsy can fractionate tissue structure to subcellular levels [13], [14], leaving little chance for cell survival. The treated tissue is fractionated so finely as to appear, for most practical purposes, as a liquid. Therefore, we refer to bulk tissue fractionation using histotripsy as “tissue liquefaction” in this paper. The boundaries of histotripsy lesions in bulk tissue are also sharply demarcated, with only several microns between the liquefied margin and the intact cells. Histotripsy has many potential medical applications where noninvasive tissue fractionation and/or removal are needed. We are currently investigating the feasibility of applying histotripsy-generated tissue erosion at a tissue-fluid interface to perforate the atrial septum (thin tissue between the two atria) in treatment of a congenital heart disease called hyperplastic left heart syndrome (HLHS) [12], [15], and the feasibility of applying histotripsy-generated bulk tissue liquefaction in treatment of benign prostatic hyperplasia (BPH) and prostate cancer.
Tissue ablation using ultrasound can be achieved by thermal effects due to absorption of acoustic energy-induced heating [1], [16] or mechanical effects achieved by energetic microbubble activities (cavitation) [17], [18]. Our previous study has shown that the thermal dose delivered in the histotripsy process to achieve tissue fractionation is below the threshold needed for thermal effects [19]. Even though the spatial peak pulse average intensity (ISPPA) used in histotripsy is high (>10 kW/cm2), spatial peak time average intensity (ISPTA) is low (<200 W/cm2) due to the low duty cycles applied (0.1–5%).
The primary mechanism for histotripsy is believed to be acoustic cavitation, which is supported by an enhanced, temporally changing acoustic backscatter observed during the histotripsy process [20], [21]. Without initiation of this temporally changing acoustic backscatter, tissue erosion at a tissue-fluid interface [20] or tissue liquefaction in bulk tissue [21] was never produced. This acoustic backscatter was thought to be the sound reflection of histotripsy pulses from a dynamically changing bubble cloud. We believe it is the energetic activities of the cavitating bubbles that mechanically fragment and subdivide tissue. The temporally varying acoustic backscatter does not always occur immediately at the onset of the histotripsy pulses [20]. The time to initiation depends on the pulse parameters (e.g., it is shorter at higher pulse pressures). After initiation, when the histotripsy pulses are still being delivered, the variable backscatter may stop, which we label as extinction [20]. When extinction occurs, further tissue erosion or tissue liquefaction ceases. The variable backscatter can be reinitiated without changing the pulse parameters. The extinction and the reinitiation are both stochastic events. In this paper, we study the initiation and extinction by simultaneously imaging the bubble cloud and recording the acoustic backscatter signals.
High speed imaging has been used to study cavitating bubble clouds generated by lithotripter shockwave pulses [22]–[26]. To investigate histotripsy tissue erosion at a tissue-fluid interface and tissue liquefaction in bulk tissue, we imaged the bubble cloud at a tissue-water interface and inside an optically transparent gelatin phantom which mimics bulk tissue. In this research, the shape and size of the whole bubble cloud, as well as the size of individual bubbles inside the cloud, have been studied.
Histology of histotripsy lesions has shown sharply demarcated boundaries only a few microns in width in both in vitro [13] and in vivo [14] experiments. The mechanism for the sharp boundaries is thought to relate to the nature of cavitation as a threshold phenomenon [27]–[29]. As an initial investigation of this hypothesis, we compared the pressure thresholds required to generate a histotripsy-induced cavitating bubble cloud at a tissue-fluid interface to those required to generate a cloud inside a gelatin phantom.
The extent and efficiency of tissue erosion or tissue liquefaction generated by histotripsy are largely affected by the selection of pulse parameters, including pulse pressure, pulse duration, and pulse repetition frequency (PRF) [12], [19], [30]. For example, a histotripsy-generated tissue erosion volume increases with increasing pulse pressure, but the erosion rate along the axial acoustic beam direction (which contributes the most to perforating the tissue) decreases with increasing pressure at high pressure (peak rarefactional pressure (PR) ≥9 MPa; ISPPA ≥ 5000 W/cm2) [30]. Here, we investigated the effects of pulse pressure on the bubble cloud generated by histotripsy pulses, including the size, shape, and lifetime of the bubble cloud.
II. Methods
A. Sample Preparations
Bubble clouds were generated at a tissue-water interface and inside an optically transparent gelatin phantom. The tissue sample was fresh porcine atrial wall (1–2 mm thick) obtained from a local abattoir and used within 24 h of harvesting. All tissue specimens were preserved in 0.9% saline at 4°C. Tissue was wrapped over a ring-shaped tube fitting (2 cm in diameter). Transparent porcine skin-based gelatin phantoms (Type-A, Sigma-Aldrich, St. Louis, MO) were used to mimic bulk tissue. Gelatin powder (7% concentration) was mixed using deionized water and desiccated for 25 minutes to remove any air bubbles [31]. Gelatin phantoms were stored at 4°C overnight and warmed to room temperature (~20°C) before experimentation the following day.
B. Ultrasound Generation and Calibration
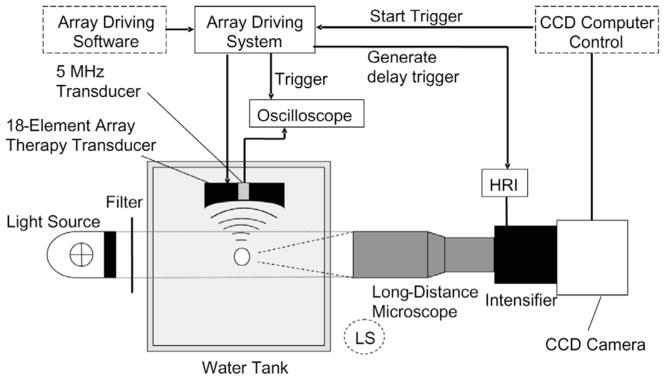
The overall experimental setup is shown in a schematic drawing (Fig. 1). Histotripsy pulses were generated by an 18-element piezocomposite (1–3 composite [32]) spherical shell therapeutic array (Imasonic, S.A., Besançon, France) with a center frequency of 750 kHz and a geometric focal length of 100 mm. The therapeutic array has an annular configuration with outer and inner diameters of 145 and 68 mm, respectively. All of the array elements were excited in phase. The array driving system, maintained under PC control, consists of channel driving circuitry, associated power supplies (Model HP 6030A, Hewlett-Packard, Palo Alto, CA), and a software platform to synthesize the driving patterns. The position of the array was adjusted by a 3-D positioning system (Model A-25, Velmex, Bloom-field, NY) to align the bubble cloud with the camera. The array-driving software provided trigger signals to synchronize the bubble image acquisition and acoustic backscatter collection. More details regarding the synchronization are provided in the following sections.
Fig. 1.
Schematic drawing of experimental setup for high speed imaging and acoustic backscatter recording. The light source position shown was for bubble shadowgraph acquisition. For whole bubble cloud imaging with forward lighting, the long-distance microscope was replaced by lenses described in the methods section and the light source was moved to the position labeled as “LS” (dashed circle).
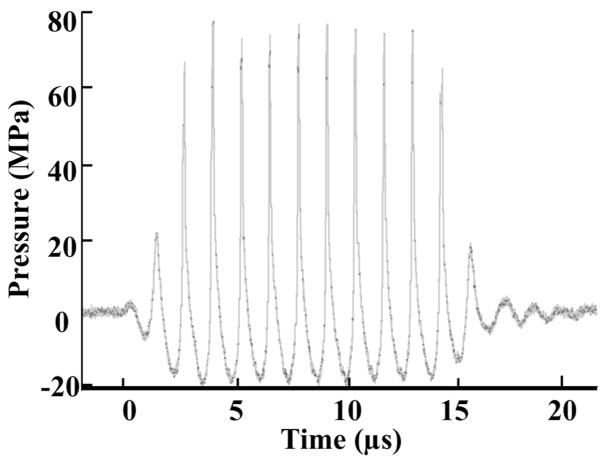
The pressure waveform at the focus of the 750-kHz array in the acoustic field was measured using a fiber optic probe hydrophone (FOPH) developed in-house [33] for the purpose of recording high-amplitude pressure waveforms. The lateral and axial pressure profiles of the focused beam were measured to be 2.2 mm × 12.6 mm in width (full width at half maximum, FWHM) at peak rarefactional pressure of 14 MPa and 1.8 mm × 11.9 mm at 19 MPa. The beam width decreased with increasing pressure, as high frequency components caused by the nonlinear propagation became more prominent at higher pressure. The PR, peak compressional pressure (PC), and ISPPA [34] used in experiments were measured for free-field conditions and are reported in Table I. The acoustic pressure waveform is shown in Fig. 2. See Table I for other acoustic parameters and imaging conditions used.
TABLE I.
| Pulse parameters |
||||||||
|---|---|---|---|---|---|---|---|---|
| Fig. # | Imaging | Environment | Pulse duration | PR (MPa) | PC (MPa) | ISPPA (W/cm2) | PRF | Total #pulses |
| 3 | Whole | Tissue-water | 14 μs (10 cycles) | 15.6 | 36.1 | 15 k | 10 Hz | 200 |
| 4 | bubble | Inside Gel | 14 μs (10 cycles) | > 21* | > 76* | > 32 k* | 10 Hz | 200 |
| 7 | cloud | Inside Gel | 14 μs (10 cycles) | > 21* | > 76* | > 32 k* | 10 Hz | 40 |
| 8 | imaging | Tissue-water | 14 μs (10 cycles) | 21 | 21 | 32 k | Single | — |
| > 21* | > 76* | > 32 k* | Pulse | |||||
| 9 | Inside Gel | 14 μs (10 cycles) | > 21* | > 76* | > 32 k* | 10 Hz | 200 | |
| 5 | Bubble | Tissue-water | 4 μs (3 cycles) | 15.5 | 28.4 | 12 k | 100 Hz | 2000 |
| 6 | shadowgraph | Inside Gel | 14 μs (10 cycles) | > 21* | > 76* | > 32 k* | 10 Hz | 200 |
PR and PC could not be accurately measured due to instantaneous cavitation. At a lower power input, the PR and PC were measured to be 21 MPa and 76 MPa, respectively.
Fig. 2.
Acoustic pressure waveform of a 10-cycle (14-μs) histotripsy pulse in water at the transducer focus (PR = 21 MPa, PC = 76 MPa).
C. High-Speed Imaging
Bubble cloud images were captured by a fast-gated, 640 × 480 pixel, 12-bit, 10-frame-per-second, intensified charge-coupled device (ICCD) camera (Picostar HR, La Vision, Goettingen, Germany) [35]. The ICCD camera can store up to 200 images at once.
To study initiation and extinction, we synchronized the bubble cloud imaging with the acoustic backscatter acquisition. The bubble cloud images were taken when the histotripsy pulse was propagating through the focus. The acoustic backscatter was recorded as the sound reflection of the histotripsy pulses from the transducer focus. For example, for a 14-μs pulse, images were taken at 10 μs after its arrival at the transducer focus. For a 4-μs pulse, images were taken at 3 μs after its arrival at the transducer focus. To study the effects of pulse pressure on bubble cloud dynamics, we took snapshots of the bubble cloud at different fixed delays (3 μs–1 ms) after the arrival of a histotripsy pulse.
Two types of bubble images were captured. The image of the whole bubble cloud was taken using forward lighting. The bubbles were illuminated by a Xenon arc lamp (Model 60069 Q Series, Oriel, Stratford, CT) at a 30-degree angle with respect to the camera. A field-of-view (FOV) of 3.6 × 2.7 cm2 was achieved using a normal lens (AF Nikkor—50 mm f/1.8 D, Nikon, Tokyo, Japan) coupled to a close-up lens (52 mm, 250 D, Canon, Tokyo, Japan) and a 2× magnification lens (Canon, Tokyo, Japan). The second image type is a shadowgraph of individual bubbles. To produce a bubble shadowgraph, bubbles were backlit and the shadow of bubbles was captured by the camera. For imaging individual bubbles, we used a compact long-distance microscope (QM 100, Questar Corp., New Hope, PA) with diffraction-limited 1.1-μm resolution over a 157 × 209 μm2 FOV at a 14-cm working distance. The gate duration for the intensifier of the ICCD camera was 200 ns for capturing shadowgraphs of individual bubbles and 100 ns for capturing forward light images of the whole bubble cloud. Both setups are presented in Fig. 1.
The ICCD camera captures images by detecting and recording a count proportional to the photon number at each pixel. Pixels with bubbles have higher photon counts (bright) in forward light imaging and lower photon counts (dark) in shadowgraph. For forward light imaging, the bubble presence was determined when the photon count exceeded a threshold of mean +3 standard deviations (SD) of the photon count at this pixel with no bubbles. For bubble shadowgraphs, the bubble presence was determined when the photon count fell below a threshold of mean −3 SD of the photon count at this pixel with no bubbles.
Using the forward light bubble cloud imaging data, we integrated the area of pixels with bubbles (integrated intersectional area of bubbles). As the camera captured the image of the bubble cloud along the axial direction of the ultrasound beam, this integrated intersectional area of bubbles was used to estimate the axial cross-sectional area of the bubble cloud.
A bubble shadowgraph imaged a portion of the bubbles within the cloud. Based on the shadowgraph data, we calculated the percentage of the total area of pixels with bubbles to the whole image area (percentage of intersectional area containing bubbles). This percentage may be related to the void fraction, defined as the percentage of volume occupied by void vapor or gas phase to the total volume of a two-phase liquid.
D. Acoustic Backscatter
To receive the acoustic backscatter of histotripsy pulses, a 5-MHz, 2.5-cm-diameter single-element focused transducer (Valpey Fisher Corporation, Hopkinton, MA) with a 10-cm focal length was mounted confocally with the therapeutic array inside its inner hole. Acoustic backscatter signals were recorded and displayed as range-gated temporal voltage traces by a digital oscilloscope (Model 9384L, LeCroy, Chestnut Ridge, NY). The recorded waveforms were then transferred through GPIB and processed using Matlab software (The MathWorks, Natick, MA).
Normalized acoustic backscatter power moving SD was used to characterize the variability of backscatter. The details of this method are described in our previous paper [20]. As the acoustic backscatter was due to reflected histotripsy pulses, the backscatter power was first normalized to a reference proportional to the therapy pulse power, which was determined by reflection from a stainless steel reflector [36]. Normalized backscatter power moving SD at a time point i was calculated as the SD of backscatter power at point i, i −1, and i −2 (moving window size = 3). The initiation and extinction of the temporally variable acoustic backscatter were detected when the moving SD exceeded and fell below a threshold for five consecutive pulses, respectively [20]. The initiation and extinction thresholds were four times and two times, respectively, the estimated SD of uninitiated backscatter power, which was estimated from acoustic backscatter signals prior to initiation [20].
III. Results
A. Initiation and Extinction
1. Whole Bubble Cloud Imaging
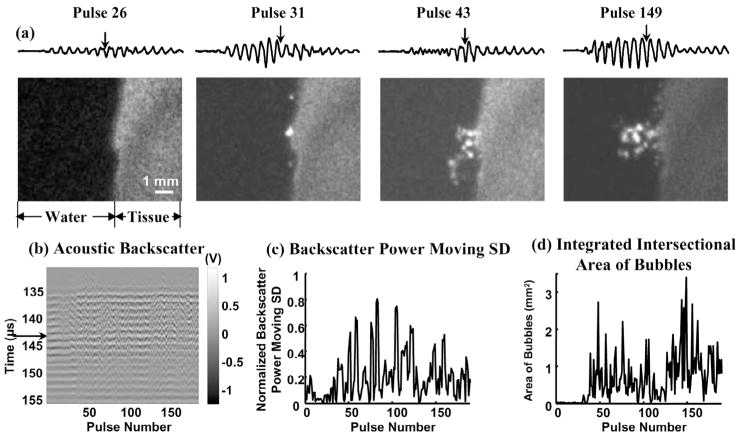
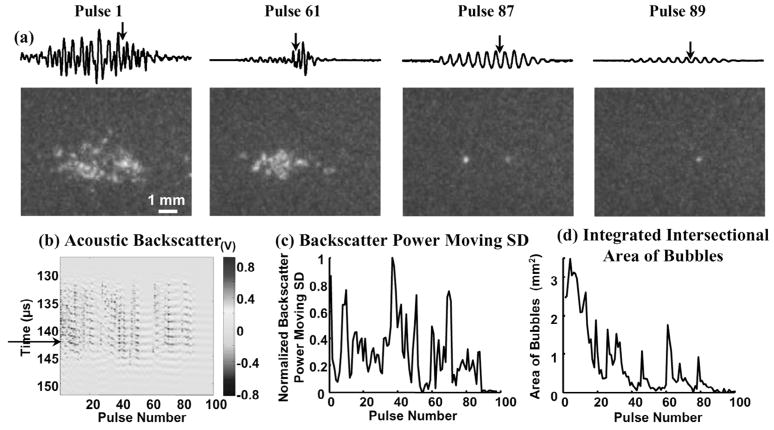
Imaging results show that the initiation and extinction of the variable backscatter corresponded to formation and disappearance, respectively, of the bubble cloud generated by histotripsy pulses. The bubble clouds consisting of multiple bubbles were generated at a tissue-water interface (Fig. 3) and inside a gelatin phantom (Fig. 4).
Fig. 3.
(a) Waveforms of the 25-μs-long range-gated acoustic backscatter signals (top) and the corresponding bubble cloud images (bottom) produced at a tissue-water interface. The x- and y-axes for the acoustic backscatter waveform are the same as the y-axis and the voltage scale in (b). (b) Acoustic backscatter signals in slow-time and fast-time display. Each vertical line is a range-gated voltage trace where voltage is encoded in gray scale. (c) Normalized backscatter power SD as a function of pulse number. (d) Integrated intersectional area of bubbles as a function of pulse number. Formation of the bubble cloud corresponded to the initiation of the variable acoustic backscatter. Arrows on the acoustic backscatter trace in (a) and acoustic backscatter fast-time and slow-time image in (b) indicate when the optical image was taken. Acoustic parameters used in all of the figures are listed in Table I.
Fig. 4.
(a) Waveforms of the range-gated acoustic backscatter signals (top) and the corresponding bubble cloud images (bottom) produced inside a gelatin phantom. (b) Acoustic backscatter signals, (c) backscatter power moving SD, and (d) integrated intersectional area of bubbles displayed in the same format as Fig. 3(b)–(d). Arrows on the acoustic backscatter trace in (a) and acoustic backscatter fast-time and slow-time image in (b) indicate when the optical image was taken. The disappearance of the bubble cloud and the extinction of acoustic backscatter corresponded in time. A residual bubble appeared to remain static in the gel long after the bubble cloud disappeared (hundreds of ms).
The bubble cloud was not always generated at the onset of the histotripsy pulses. The time to initiation depends on the pulse parameters. The formation of the bubble cloud corresponded well to initiation of the temporally changing acoustic backscatter. Fig. 3 shows an example of bubble cloud formation and initiation of the variable acoustic backscatter signals at a tissue-water interface. The bubble cloud began to form at the 38th pulse after the onset of insonation (detected by the integrated intersectional area of bubbles), and the variable acoustic backscatter was also initiated at the 38th pulse (detected by backscatter power moving SD). There were variable backscatter signals between the 4th and 10th pulses; however, no bubbles were observed. This is likely due to the bubble size being below the level of detection by the imaging system.
After initiation, histotripsy pulses may stop generating bubble clouds. The timing of the disappearance of the bubble cloud corresponded to extinction of the variable acoustic backscatter. In Fig. 4, a bubble cloud was generated in a gelatin phantom by histotripsy pulses. Each pulse produced a bubble cloud consisting of multiple bubbles, and the bubble cloud changed from pulse to pulse. After the 87th pulse, the histotripsy pulses stopped forming bubble clouds. One residual bubble remained static from pulse to pulse. Correspondingly, the variable acoustic backscatter extinguished at the 89th pulse. The slight difference in timing could be due to: 1) the oscillation of the residual bubble between the 87th and 89th pulses, but the oscillation was not large enough to be observed by the imaging; and/or 2) the production of very small bubbles between the 87th and 89th pulses, but these bubbles were too small to be detected.
We used a lower acoustic pressure for the tissue-water interface than inside the gel because the pressure threshold to initiate a bubble cloud appears to be lower at a tissue-water interface (detailed in Section III-D).
2. Shadowgraph of Individual Bubbles
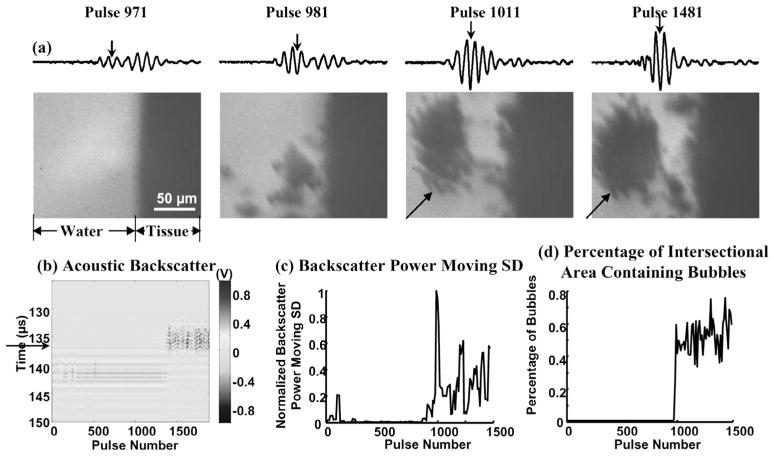
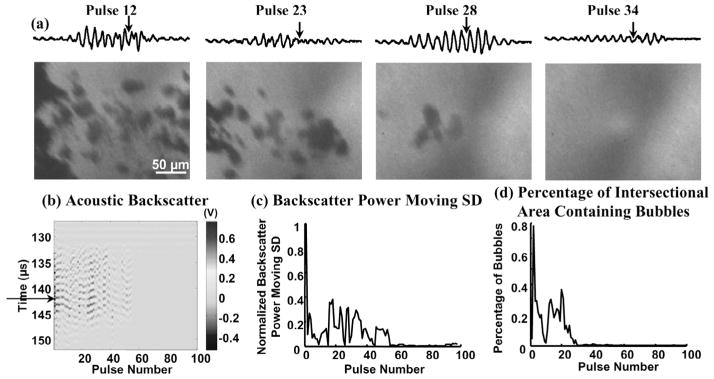
Shadowgraphs of individual bubbles within the bubble cloud were captured. The bubble shadowgraphs also demonstrate that the formation and disappearance of the individual bubbles corresponded to the initiation and extinction of the variable acoustic backscatter, respectively. For example, both the initiation of the variable acoustic backscatter signal and the appearance of the bubbles were observed at the 981st pulse at a tissue-water interface (Fig. 5). In Fig. 6, the bubbles were first generated in the gelatin phantom by histotripsy pulses, and variable backscatter was detected. No bubbles were shown in the shadowgraph after the 30th pulse, and the extinction of the variable backscatter occurred at the 54th pulse. The difference in timing between the two is most likely because bubbles were generated outside the imaging frame between the 30th and 54th pulses. The shadowgraph imaged bubbles within a portion and not the whole bubble cloud.
Fig. 5.
(a) Waveforms of the range-gated acoustic backscatter signals (top) and the corresponding bubble shadowgraphs (bottom) produced at a tissue-water interface. (b) Acoustic backscatter signals and (c) backscatter power moving SD displayed in the same format as Fig. 3(b)–(c). (d) Percentage of intersectional area containing bubbles as a function of pulse number. Arrows on the acoustic backscatter trace in (a) and acoustic backscatter fast-time and slow-time image in (b) indicate when the optical image was taken. Both the variable acoustic backscatter and bubbles appeared at the 981st pulse. Bubble aggregations were often observed (indicated by arrows in the two rightmost shadowgraphs).
Fig. 6.
(a) Waveforms of the range-gated acoustic backscatter signals (top) and the corresponding bubble shadowgraphs (bottom) produced inside a gelatin phantom. (b) Acoustic backscatter signals, (c) backscatter power moving SD, and (d) percentage of intersectional area containing bubbles displayed in the same format as Fig. 5(b)–(d). Arrows on the acoustic backscatter trace in (a) and acoustic backscatter fast-time and slow-time image in (b) indicate when the optical image was taken. The disappearance of bubbles and the extinction of the variable acoustic backscatter were observed.
B. Size and Shape of the Bubble Cloud
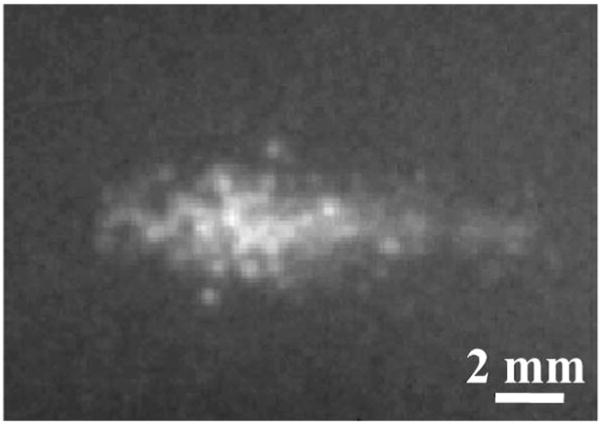
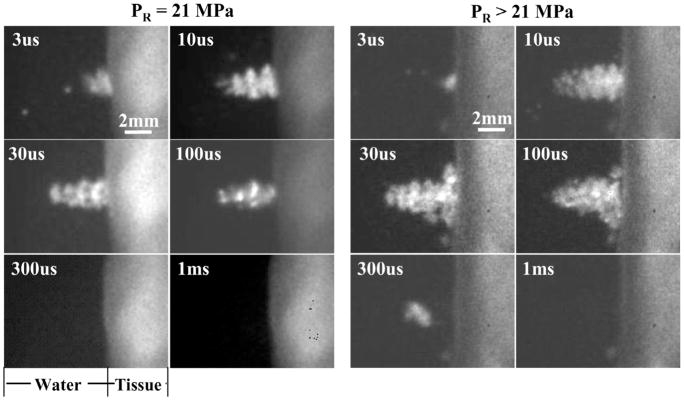
The bubble cloud generated by histotripsy pulses appeared to consist of multiple bubbles both inside a gelatin phantom and at a tissue-water interface. The size and shape of the bubble cloud changed from pulse to pulse, but the location of the bubble cloud was consistent over different pulses using one parameter set. The bubble cloud generated inside the gel was usually cigar-shaped, as shown in a summed image of the bubble cloud over 40 snapshots (Fig. 7). In these 40 snapshots, the bubble cloud produced in the gel was 1.2–3 mm (diameter along the lateral acoustic beam) × 2–7.5 mm (diameter along the axial acoustic beam). The bubble cloud generated at a tissue-water interface in Fig. 3 did not have a well-defined shape and changed significantly from pulse to pulse. In comparison to the bubble cloud generated in the gel, the size of the bubble cloud was also small, with both lateral and axial diameter of the bubble cloud shorter than 2 mm. The small size and irregular shape of the bubble cloud in Fig. 3 may be due to the lower pulse pressure applied. At higher pulse pressures, the bubble cloud formed at a tissue-water interface was larger and mostly cone-shaped (Fig. 8). The base of the cone was attached to the tissue surface and the tip was directed away from the tissue. Interestingly, the bubble cloud was divided into sections along the axial direction of the ultrasound beam (Fig. 8). Each section was separated at half of the wavelength at 750 kHz (1 mm), which suggests that the section formation was caused by a standing wave at the tissue boundary. The bubble cloud changed dynamically with time both during and after the histotripsy pulse (Fig. 8). In addition, the size and shape of the bubble cloud were affected by the pulse parameters. The effects of peak rarefactional pressure on the bubble cloud are reported in Section III-E.
Fig. 7.
A summed image (over 40 snapshots) of the bubble cloud generated inside a gelatin phantom shows the cigar shape of the cloud.
Fig. 8.
Images of bubble clouds generated by a 10-cycle (14-μs) pulse at PR of 21 MPa (left) and >21 MPa (right) at a tissue-water interface. Each image was taken at a specific time delay (labeled) after the arrival of the histotripsy pulse at the transducer focus (i.e., tissue surface). The bubble cloud was larger and longer in duration at higher PR.
C. Size of Individual Bubbles
With the assistance of a long-distance microscope, we were able to recognize individual bubbles above 4 μm in diameter. Bubbles with diameters between 4 and 50 μm were generated by histotripsy pulses inside a gelatin phantom and at a tissue-water interface (Figs. 5 and 6). Inside the gel, the majority of the bubbles were between 8 and 20 μm (Fig. 6). Bubbles smaller than 4 μm might exist but could not be clearly identified due to the limited spatial resolution (1.1 μm). In some images, multiple bubbles appeared to be connected together. These bubble aggregations may be caused by the coalescing and/or overlapping of bubbles along the line of the light beam, and were seen quite often at a tissue-water interface (Fig. 5). Multiple bubbles can form aggregations of 100 μm in diameter or even larger. The bubble shadowgraphs were taken when the histotripsy pulse was propagating through the transducer focus. Bubbles are expected to continue growing after the histotripsy pulse.
D. Differential Cavitation Pressure Threshold
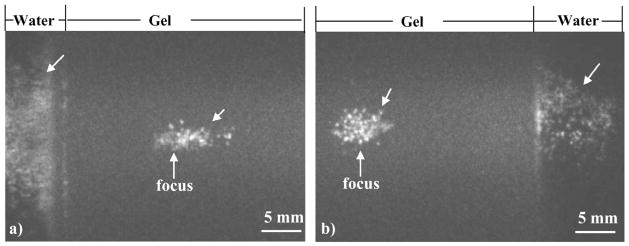
When histotripsy pulses were focused within a 2.5-cm-thick gelatin phantom, two bubble clouds were generated along the ultrasound beam path. One was generated at the transducer focus inside the gel, and the other was generated approximately 1 cm away from the transducer focus at the gel-water interface. However, no bubbles were created between the two, where the pressure was higher than at the gel-water interface (Fig. 9). This result suggests that the pulse pressure required to generate a bubble cloud was lower at a gel-water interface than inside the gel. It is possible that standing waves can form at the front surface of gel (the surface closer to the transducer) due to the sound reflection, resulting in increased pulse pressure [Fig. 9(a)]. However, bubble clouds were also generated at the back surface of gel (the surface away from the transducer) where standing waves were unlikely to be formed [Fig. 9(b)]. This second observation suggests that standing waves were not responsible for bubble generation at gel-water interfaces. In addition, the bubble cloud generated at the gel-water interface typically was larger than that created inside the gel at the transducer focus (Fig. 9), even though the pressure was lower for the former.
Fig. 9.
Images of bubble clouds generated inside a gelatin phantom and at a gel-water interface (indicated by arrows). When focusing inside the gelatin phantom, one bubble cloud was generated in the gel at the transducer focus, and another was generated at the gel-water interface ~1 cm pre-focus (a) and post-focus (b). However, no bubbles were generated in between, where the pressure exceeded that at the gel-water interface. The ultrasound was propagated from left to right in both images.
E. Effects of Peak Rarefactional Pressure on Bubble Clouds
Fig. 8 shows bubble cloud images generated by a 10-cycle (14-μs) histotripsy pulse at PR of 21 MPa and >21 MPa at a tissue-water interface. The pressure levels for the latter could not be measured successfully due to instantaneous cavitation at the hydrophone tip. Images were taken at different time delays (3 μs–1 ms) after the arrival of a histotripsy pulse. At both pressures, the cloud persisted long after the pulse, and the bubble cloud lasted longer at higher PR. Initial bubble cloud formation was observed at 3 μs. It increased in size with time during the pulse until 10 μs. The size of the bubble cloud remained similar at 10, 30, and 100 μs. At 300 μs, a bubble cloud was not seen at the 21 MPa PR, but a small cloud was observed at the higher pressure. At 1 ms, no bubble clouds were observed at either pressure. Small residual bubbles may still exist but were not seen, due to the camera’s limited spatial resolution.
The bubble cloud was also larger at higher peak rarefactional pressure. The bubble clouds appeared to be cone-shaped, growing outward from the tissue surface. At the 21-MPa PR, the peak size of the cloud was about 3.3 mm long and about 1.9 mm wide at the base of the cone (at 10μs). At the PR > 21 MPa, the cloud reached its maximum size (at 30 μs) of about 4.8 mm long and about 4.3 mm wide at the base of the cone.
IV. Discussion
Using high speed imaging, we observed that a bubble cloud was generated by histotripsy pulses at a tissue-water interface and inside a gel phantom which was used to mimic bulk tissue. The formation and disappearance of the bubble cloud corresponded to the initiation and extinction of an enhanced and temporally changing acoustic backscatter, respectively. This result suggests that the variable acoustic backscatter was most likely the sound reflection of histotripsy pulses from the dynamically changing bubble cloud. As our previous studies have demonstrated, without the initiation of temporally spatially varying acoustic backscatter, tissue erosion at a tissue-water interface or tissue liquefaction inside bulk tissue were never produced [20], [37]. The correspondence between the variable acoustic backscatter and the bubble clouds provides further evidence that the cavitating bubble cloud plays an essential role in the histotripsy process.
We found that the pulse pressure required to generate a bubble cloud is lower at a gel-water interface than inside a gel, which suggests a lower cavitation threshold at a tissue-fluid interface than inside bulk tissue. This may explain the sharply demarcated boundaries (several microns in width) of histotripsy lesions observed both in vitro [12], [13] and in vivo [14]. The sharp boundaries are probably due to a very large spatial threshold gradient. The boundary of tissue erosion exists at the location where the pulse pressure is just below the cavitation threshold at a tissue-fluid interface. As the pressure threshold within tissue is much higher, no damage is expected to be produced in surrounding tissue. Tissue liquefaction in bulk tissue can first start where the pressure is higher than the cavitation threshold. When part of the tissue is liquefied, it forms a smooth liquid resulting in a tissue-fluid interface. From this point in the process, tissue liquefaction becomes internal tissue erosion. The liquefaction can continue to expand to where the pulse pressure is just below the cavitation threshold at a tissue-fluid interface, resulting in a sharp boundary. Because the pressure threshold in bulk tissue is much higher than at a tissue-fluid interface, no damage would be done in the surrounding tissue. Further studies with better control of cavitation nuclei in gel and water would be needed to verify this mechanism.
The extent and efficiency of tissue erosion or tissue liquefaction generated by histotripsy depend on the selection of pulse parameters including pulse pressure, pulse duration, and PRF [12], [19], [30]. We believe this dependency is due to the impact of pulse parameters on bubble cloud dynamics. In this paper, we studied the effects of peak rarefactional pressure on the bubble cloud, and observed that the bubble cloud is larger and lasts longer at higher peak rarefactional pressure. This result is consistent with our previous finding that the tissue erosion area and erosion volume rate are larger at higher pressure [30]. Previous results also demonstrate a decreasing axial erosion rate at higher pressure above a certain level (PR ≥9 MPa or ISPPA ≥5000 W/cm2) [30]. Along the axial acoustic beam direction, the center of the bubble cloud is thicker at higher pressure, with more and/or larger bubbles. These bubbles may hinder the ultrasound energy propagation to the tissue surface and slow down the erosion rate in the axial direction. Other pulse parameters (e.g., pulse duration and PRF) also have effects on the extent and efficiency of tissue erosion and liquefaction [12], [30]. For example, more energy-efficient erosion can be achieved with shorter pulses and at certain PRFs [12]. Parsons et al. [37] found that tissue liquefaction can be facilitated by interleaving high-amplitude histotripsy pulses with low-amplitude pulses, while high-amplitude histotripsy pulses delivered at doubled PRF only achieve mostly thermal-mediated lesions. These results raise interesting and critical questions of how pulse parameters change the bubble dynamics to cause different bioeffects and how one might increase histotripsy efficiency. Understanding initiation and extinction of bubble clouds, and subsequent bubble cloud dynamics, as a function of easily changed pulse parameters can provide a rational basis for optimization of the histotripsy process. With proper feedback, pulse-to-pulse optimization through changes in pulse parameters may become possible.
The bubble cloud was imaged at different delay times after the arrival of the histotripsy pulse. Initial observations show that the bubble cloud seems to behave as one entity and changes as one entity during and after the pulse. A bubble cloud generated by a several-μs-long histotripsy pulse can last for several hundred μs. In fact, our previous optical monitoring results suggest that the residual bubbles from cloud collapse can remain for several ms [38]. The temporal dynamics of the bubble cloud and the individual bubbles during and between the pulses are critical to understand the underlying mechanisms of histotripsy. For example, is the majority of tissue erosion and tissue liquefaction done during the histotripsy pulse or after, and how? The bubble cloud can be quite large, yet the damage boundary can be remarkably small (several microns); why? Apparently, it is individual bubbles that produce the damage, not the cloud, but how? How do the bubble remnants from the previous pulse interact with the next pulse? Our group is currently studying the temporal evolution of the bubble cloud in the hope of further clarifying the interesting underlying physical mechanisms of the histotripsy process.
V. Conclusions
High speed imaging has shown that bubble clouds are generated by histotripsy pulses at a tissue-water interface and inside a gelatin phantom which was used to mimic bulk tissue. A correspondence was observed between the formation of a bubble cloud and the initiation of a temporally changing acoustic backscatter, which is essential for the production of tissue erosion and tissue liquefaction. The pressure threshold to generate a bubble cloud at a gel-water interface is lower than inside the gel, suggesting the pressure threshold to initiate a bubble cloud is lower at a tissue-fluid interface than inside bulk tissue. This pressure threshold difference is expected to contribute to the sharply demarcated boundaries of histotripsy lesions. Further, the bubble cloud is larger and lasts longer at higher peak rarefactional pressure, which may explain our previous in vitro results that the erosion area is larger and the axial erosion rate is slower at high pulse pressure (PR ≥9 MPa).
Acknowledgments
This research was funded by NIH grant R01 HL077629.
The authors thank Dhruv Sud for his help with the bubble imaging setup. We would also like to thank Wei-Zung Chang for his input on data analysis.
Biographies
Zhen Xu (S’04–M’05) is currently an assistant research scientist in the Department of Biomedical Engineering at the University of Michigan, Ann Arbor, MI. Her research interest includes applications of high intensity ultrasound for noninvasive surgeries and drug delivery, effects of cavitation in therapeutic ultrasound, and phased array ultrasound transducer for therapeutics. Dr. Xu received her B.S.E. (highest honors) from Southeast University, Nanjing, China, in 2001, and her M.S. and Ph.D. degrees from the University of Michigan in 2003 and 2005, respectively, both in biomedical engineering.

Mekhala Raghavan is a graduate student in the Department of Biomedical Engineering at the University of Michigan, Ann Arbor, MI. She received her B.E. degree in instrumentation and control engineering in 2005 from Anna University, Chennai, India, and her M.S. degree in biomedical engineering in 2007 from the University of Michigan. Her research interests include biomedical instrumentation and spectroscopy.
Timothy L. Hall was born in 1975 in Lansing, Michigan. He received the B.S.E. degree in 1998 and M.S.E. degree in 2001, both in electrical engineering, from the University of Michigan. He is currently pursuing the Ph.D. degree in biomedical engineering. He worked for Teradyne Inc., Boston, Massachusetts, from 1998–1999 as a circuit design engineer and at the University of Michigan from 2001–2004 as a visiting research investigator.
His research interests are in high power pulsed RF amplifier electronics, phased array ultrasound transducers for therapeutics, and sonic cavitation for therapeutic applications.
Ching-Wei Chang is currently a Ph.D. student in biomedical engineering at the University of Michigan, Ann Arbor, MI. He received the B.S.E. degree in chemical engineering from National Taiwan University, Taipei, Taiwan, in 2001, and the M.S. degree in biomedical engineering from the University of Michigan in 2004. His research focuses on optical microscopy of in vivo protein interactions, particularly the application of the FRET-FLIM system. He was awarded a departmental fellowship by the Department of Biomedical Engineering at the University of Michigan in 2004.
Mary-Ann Mycek is an associate professor of biomedical engineering in the College of Engineering at the University of Michigan. She received her Ph.D. in physics in 1995 from the University of California-Berkeley and subsequently trained as a postdoctoral research fellow at the Wellman Laboratories of Photomedicine at Massachusetts General Hospital and Harvard Medical School, Boston, MA. Her major research interest is in biomedical optics, including tissue spectroscopy and imaging, nonlinear optical methods, ultrafast cellular and molecular imaging, noninvasive biological sensing, and computational modeling of light-tissue interactions.
Jeffery Brian Fowlkes (M’94–A’94) is an associate professor in the Department of Radiology and associate professor in the Department of Biomedical Engineering, University of Michigan. He is currently directing and conducting research in medical ultrasound, including the use of gas bubbles for diagnostic and therapeutic applications. His work includes studies of ultrasound contrast agents for monitoring tissue perfusion, acoustic droplet vaporization for bubble production in cancer therapy and phase aberration correction, effects of gas bubbles in high intensity ultrasound, and volume flow estimation for ultrasonic imaging. Dr. Fowlkes received his B.S. degree in physics from the University of Central Arkansas, Conway, AR, in 1983, and his M.S. and Ph.D. degrees from the University of Mississippi, Oxford, MS, in 1986 and 1988, respectively, both in physics. Dr. Fowlkes is a fellow of the American Institute of Ultrasound in Medicine and has served as Secretary and as a member of its Board of Governors. He also received the AIUM Presidential Recognition Award for outstanding contributions and service to the expanding future of ultrasound in medicine. As a member of the Acoustical Society of America, Dr. Fowlkes has served on the Physical Acoustics Technical Committee and the Medical Acoustics and Bioresponse to Vibration Technical Committee. As a Member of the IEEE, he has worked with the IEEE I&M Society Technical Committee on Imaging Systems. Dr. Fowlkes is a fellow of the American Institute of Medical and Biomedical Engineering.
Charles A. Cain (S’65–M’71–SM’80–F’89) was born in Tampa, FL, on March 3, 1943. He received the B.E.E. (highest honors) degree in 1965 from the University of Florida, Gainesville, FL; the M.S.E.E. degree in 1966 from the Massachusetts Institute of Technology, Cambridge, MA; and the Ph.D. degree in electrical engineering in 1972 from the University of Michigan, Ann Arbor, MI.
During 1965–1968, he was a member of the Technical Staff at Bell Laboratories, Naperville, IL, where he worked in the electronic switching systems development area. During 1972–1989, he was in the Department of Electrical and Computer Engineering at the University of Illinois at Urbana-Champaign, where he was a professor of electrical engineering and bioengineering. Since 1989, he has been in the College of Engineering at the University of Michigan, Ann Arbor, as a professor of biomedical engineering and of electrical engineering. He was the Chair of the Biomedical Engineering Program from 1989 to 1996, was the Founding Chair of the Biomedical Engineering Department from 1996–1999, and was named the Richard A. Auhll Professor of Engineering in 2002.
He has been involved in research on the medical applications of ultrasound, particularly high intensity ultrasound for noninvasive surgery. He was formerly an associate editor of the IEEE Transactions on Biomedical Engineering and the IEEE Transactions on Ultrasonics, Ferroelectrics, and Frequency Control; and an editorial board member of the International Journal of Hyperthermia and Radiation Research. He is a Fellow of the IEEE and the AIMBE.

References
- 1.Fry FJ, Kossoff G, Eggleton RC, Dunn F. Threshold ultrasound dosages for structural changes in the mammalian brain. J Acoust Soc Amer. 1970;48:1413–1417. doi: 10.1121/1.1912301. [DOI] [PubMed] [Google Scholar]
- 2.Dunn F, Fry FJ. Ultrasonic threshold dosages for the mammalian central nervous system. IEEE Trans Biomed Eng. 1971;18:253–256. doi: 10.1109/tbme.1971.4502847. [DOI] [PubMed] [Google Scholar]
- 3.Frizzell LA, Lee CS, Aschenbach PD, Borrelli MJ, Morimoto RS, Dunn F. Involvement of ultrasonically induced cavitation in hind limb paralysis of the mouse neonate. J Acoust Soc Amer. 1983;74:1062–1065. doi: 10.1121/1.389941. [DOI] [PubMed] [Google Scholar]
- 4.ter Haar GR, Daniels S, Morton K. Evidence for acoustic cavitation in vivo: Threshold for bubble formation with 0.75-MHz continuous-wave and pulsed beam. IEEE Trans Ultrason, Ferroelect, Freq Contr. 1986;33:162–164. doi: 10.1109/t-uffc.1986.26809. [DOI] [PubMed] [Google Scholar]
- 5.Hynynen K. Threshold for thermally significant cavitation in dog’s thigh muscle in vivo. Ultrasound Med Biol. 1991;17:157–169. doi: 10.1016/0301-5629(91)90123-e. [DOI] [PubMed] [Google Scholar]
- 6.Chapelon JY, Margonari J, Vernier F, Gorry F, Ecochard R, Gelet A. In vivo effects of high-intensity ultrasound on prostatic adenocarcinoma Dunning R3327. Cancer Res. 1992;52:6353–6357. [PubMed] [Google Scholar]
- 7.Smith NB, Hynynen K. The feasibility of using focused ultrasound for transmyocardial revascularization. Ultrasound Med Biol. 1998;24:1045–1054. doi: 10.1016/s0301-5629(98)00086-6. [DOI] [PubMed] [Google Scholar]
- 8.Tran BC, Seo J, Hall TL, Fowlkes JB, Cain CA. Microbubble-enhanced cavitation for noninvasive ultrasound surgery. IEEE Trans Ultrason, Ferroelect, Freq Contr. 2003;50:1296–1304. doi: 10.1109/tuffc.2003.1244746. [DOI] [PubMed] [Google Scholar]
- 9.Sasaki K, Kawabata K, Yumita N, Umemura S. Sonodynamic treatment of murine tumor through second-harmonic superimposition. Ultrasound Med Biol. 2004;30:1233–1238. doi: 10.1016/j.ultrasmedbio.2004.07.008. [DOI] [PubMed] [Google Scholar]
- 10.Debus J, Peschke P, Hahn EW, Lorenz WJ, Lorenz A, Iffaender H, Zabel HJ, Van Kaick G, Pfeiler M. Treatment of the Dunning prostate rat tumor R3327-AT1 with pulsed high energy ultrasound shock waves (PHEUS): Growth delay and histomorphologic changes. J Urol. 1991;146:1143–1146. doi: 10.1016/s0022-5347(17)38027-8. [DOI] [PubMed] [Google Scholar]
- 11.Coleman AJ, Kodama T, Choi MJ, Adams T, Saunders JE. The cavitation threshold of human tissue exposed to 0.2-MHz pulsed ultrasound: preliminary measurements based on a study of clinical lithotripsy. Ultrasound Med Biol. 1995;21:405–417. doi: 10.1016/0301-5629(94)00116-u. [DOI] [PubMed] [Google Scholar]
- 12.Xu Z, Ludomirsky A, Eun LY, Hall TL, Tran BC, Fowlkes JB, Cain CA. Controlled ultrasound tissue erosion. IEEE Trans Ultrason, Ferroelect, Freq Contr. 2004;51:726–736. doi: 10.1109/tuffc.2004.1308731. [DOI] [PMC free article] [PubMed] [Google Scholar]
- 13.Parsons JE, Cain CA, Abrams GD, Fowlkes JB. Pulsed cavitational ultrasound therapy for controlled tissue homogenization. Ultrasound Med Biol. 2006;32:115–129. doi: 10.1016/j.ultrasmedbio.2005.09.005. [DOI] [PubMed] [Google Scholar]
- 14.Roberts WW, Hall TJ, Ives K, Wolf JJS, Fowlkes JB, Cain CA. Pulsed cavitational ultrasound: A noninvasive technology for controlled tissue ablation (histotripsy) in the rabbit kidney. J Urol. 2006;175:734–738. doi: 10.1016/S0022-5347(05)00141-2. [DOI] [PubMed] [Google Scholar]
- 15.Bailey LL, Gundry SR. Hypoplastic left heart syndrome. Pediatr Clin No Amer. 1990;37:137–150. doi: 10.1016/s0031-3955(16)36836-5. [DOI] [PubMed] [Google Scholar]
- 16.Lizzi FL, Driller J, Ostromogilsky M. Thermal model for ultrasonic treatment of glaucoma. Ultrasound Med Biol. 1984;10:289–298. doi: 10.1016/0301-5629(84)90163-7. [DOI] [PubMed] [Google Scholar]
- 17.ter Haar G, Daniels S, Eastaugh KC, Hill CR. Ultrasonically induced cavitation in vivo. Br J Cancer—Suppl. 1982;45:151–155. [PMC free article] [PubMed] [Google Scholar]
- 18.Carstensen EL, Child SZ, Law WK, Horowitz DR, Miller MW. Cavitation as a mechanism for the biological effects of ultrasound on plant roots. J Acoust Soc Amer. 1979;66:1285–1291. [Google Scholar]
- 19.Kieran K, Hall TL, Parsons JE, Wolf JS, Fowlkes JB, Cain CA, Roberts WW. Refining histotripsy: Defining the parameter space for the creation of nonthermal lesions with high intensity, pulsed focused ultrasound of the in vitro kidney. J Urol. 2007;178:272–276. doi: 10.1016/j.juro.2007.03.093. [DOI] [PubMed] [Google Scholar]
- 20.Xu Z, Fowlkes JB, Rothman ED, Levin AM, Cain CA. Controlled ultrasound tissue erosion: The role of dynamic interaction between insonation and microbubble activity. J Acoust Soc Amer. 2005;117:424–435. doi: 10.1121/1.1828551. [DOI] [PMC free article] [PubMed] [Google Scholar]
- 21.Parsons JE, Cain CA, Abrams GD, Fowlkes JB. Spatial variability in acoustic backscatter as an indicator of tissue homogenate production in pulsed cavitational ultrasound therapy. IEEE Trans Ultrason, Ferroelect, Freq Contr. 2007;54:576–590. doi: 10.1109/tuffc.2007.280. [DOI] [PubMed] [Google Scholar]
- 22.Huber P, Debus J, Peschke P, Hahn EW, Lorenz WJ. In vivo detection of ultrasonically induced cavitation by a fibre-optic technique. Ultrasound Med Biol. 1994;20:811–825. doi: 10.1016/0301-5629(94)90038-8. [DOI] [PubMed] [Google Scholar]
- 23.Vaezy S, Rabkin BA, Zderic V. Hyperecho in ultrasound images of HIFU therapy: Involvement of cavitation. Ultrasound Med Biol. 2005;31:947–956. doi: 10.1016/j.ultrasmedbio.2005.03.015. [DOI] [PubMed] [Google Scholar]
- 24.Matsumoto Y, Yoshizawa S. Behaviour of a bubble cluster in an ultrasound field. Int J Numer Meth Fluids. 2005;47:591–601. [Google Scholar]
- 25.Ohl CD, Kurz T, Geisler R, Lindau O, Lauterborn W. Bubble dynamics, shock waves and sonoluminescence. Phil Trans R Soc Lond A. 1999;357:269–294. [Google Scholar]
- 26.Mørch KA. Cavitation nuclei and bubble formation-a dynamic liquid-solid interface problem. Trans ASME, J Fluids Eng. 2000;122:494–498. [Google Scholar]
- 27.Roy RA, Atchley AA, Crum LA, Fowlkes JB, Reidy JJ. A precise technique for the measurement of acoustic cavitation thresholds and some preliminary results. J Acoust Soc Amer. 1985;78:1799–1805. doi: 10.1121/1.392767. [DOI] [PubMed] [Google Scholar]
- 28.Atchley AA, Frizzell LA, Apfel RE, Holland CK, Madanshetty S, Roy RA. Thresholds for cavitation produced in water by pulsed ultrasound. Ultrasonics. 1988;26:280–285. doi: 10.1016/0041-624x(88)90018-2. [DOI] [PubMed] [Google Scholar]
- 29.Holland CK, Apfel RE. Thresholds for transient cavitation produced by pulsed ultrasound in a controlled nuclei environment. J Acoust Soc Amer. 1990;88:2059–2069. doi: 10.1121/1.400102. [DOI] [PubMed] [Google Scholar]
- 30.Xu Z, Fowlkes JB, Ludomirsky A, Cain CA. Investigation of intensity threshold for ultrasound tissue erosion. Ultrasound Med Biol. 2005;31:1673–1682. doi: 10.1016/j.ultrasmedbio.2005.07.016. [DOI] [PMC free article] [PubMed] [Google Scholar]
- 31.Erpelding TN, Hollman KW, O’Donnell M. Bubble-based acoustic radiation force elasticity imaging. IEEE Trans Ultrason, Ferroelect, Freq Contr. 2005;52:971–979. doi: 10.1109/tuffc.2005.1504019. [DOI] [PubMed] [Google Scholar]
- 32.Chapelon JY, Cathignol D, Cain C, Ebbini E, Kluiwstra JU, Sapozhnikov OA, Fleury G, Berriet R, Chupin L, Guey JL. New piezoelectric transducers for therapeutic ultrasound. Ultrasound Med Biol. 2000;26:153–159. doi: 10.1016/s0301-5629(99)00120-9. [DOI] [PubMed] [Google Scholar]
- 33.Parsons JE, Cain CA, Fowlkes JB. Cost-effective assembly of a basic fiber-optic hydrophone for measurement of high-amplitude therapeutic ultrasound fields. J Acoust Soc Amer. 2006;119:1432–1440. doi: 10.1121/1.2166708. [DOI] [PubMed] [Google Scholar]
- 34.AIUM. Acoustic Output Measurement Standard for Diagnostic Ultrasound Equipment, UD2-98. Laurel, MD: AIUM/NEMA; 1998. [Google Scholar]
- 35.Urayama PK, Zhong W, Beamish JA, Minn FK, Sloboda RD, Dragnev KH, Dmitrovsky E, Mycek MA. A UV-visible-NIR fluorescence lifetime imaging microscope for laser-based biological sensing with picosecond resolution. Appl Phys B: Lasers Optics. 2003;B76:483–496. [Google Scholar]
- 36.Chen JF, Zagzebski JA, Madsen EL. Tests of backscatter coefficient measurement using broadband pulse. IEEE Trans Ultrason, Ferroelect, Freq Contr. 1993;40:603–607. doi: 10.1109/58.238114. [DOI] [PubMed] [Google Scholar]
- 37.Parsons JE, Fowlkes JB, Cain CA. Acoustic backscatter features associated with production of tissue homogenate using pulsed cavitational ultrasound therapy. Proc. Int. Symp. Therapeut. Ultrasound; 2005. pp. 323–327. [Google Scholar]
- 38.Xu Z, Fowlkes JB, Cain CA. Optical and acoustic monitoring of bubble dynamics at a tissue-fluid interface in ultrasound tissue erosion. Proc. Int. Symp. Therapeut. Ultrasound; 2005. pp. 343–347. [DOI] [PMC free article] [PubMed] [Google Scholar]


