

Abstract
Our previous studies have shown that pulsed ultrasound can physically remove soft tissue through cavitation. A new strategy to enhance the cavitation-induced erosion is proposed wherein tissue erosion is initiated by a short, high-intensity sequence of pulses and sustained by lower intensity pulses. We investigated effects of the initiating sequence on erosion and cavitation sustained by lower intensity pulses. Multiple three-cycle pulses at a pulse repetition frequency of 20 kHz delivered by a 788-kHz focused transducer were used for tissue erosion. Fixing the initiating sequence at ISPPA of 9000 W/cm2, 16 combinations of different numbers of pulses within the initiating sequence and different sustaining pulse intensities were tested. Results showed: the initiating sequence increases the probability of erosion occurrence and the erosion rate with only slight overall increases in propagated energy; the initiating sequence containing more pulses does not increase the sustained cavitation period; and if extinguished and reinitiated, the sustained cavitation period becomes shorter after each initiation, although the waiting time between adjacent cavitation periods is random. The high-intensity, initiating sequence enhances cavitational tissue erosion and enables erosion at intensities significantly lower than what is required to initiate erosion.
I. Introduction
Our previous studies have shown that short, intense, ultrasound pulses (e.g., a pulse duration of three-acoustic cycles) delivered at a certain pulse repetition frequency (PRF) can mechanically remove soft tissue and produce localized, clearly demarcated perforations [1]. This technique has potential to noninvasively perforate the atrial septum of neonates, which is the membrane separating the two atria. The atrial septal perforation procedure is needed to generate a temporary flow channel between the two atria, a critical step in the treatment of neonates with hypoplastic left heart syndrome (HLHS) and an intact or restrictive atrial septum [1].
The mechanism responsible for the erosion process is believed to be cavitation. This mechanism is suggested by an enhanced and temporally changing acoustic backscatter observed during erosion [2], regarded as a signature for cavitation detection [3]–[9]. Further evidence is provided by the significant change in erosion rate of tissue in fluid with different gas concentrations [1].
In order to enhance cavitational bioeffects, a number of strategies have been proposed, one of which is microbubble (i.e., contrast agent) enhanced cavitational therapy [10]–[16]. Contrast agents, providing cavitation nuclei that are not readily available in vivo, have been shown to decrease the cavitation intensity threshold [12], [13] and increase the probability of producing cavitational bioeffects [14], [17]. Some other studies have explored changing acoustic parameters (particularly PRF) to enhance cavitational effects when using pulsed ultrasound [1], [18]–[23]. The idea is to achieve a synergistic effect provided by residual cavitation nuclei from earlier pulses by adjusting the timing between two consecutive pulses. There are other strategies to enhance cavitational bioeffects (particularly in lithotripsy) that require physical modifications of the setup, including the use of dual sequential pulses timed to increase the force of bubble collapse and thereby enhance stone breakage [24]–[26]. In another interesting approach, Ikeda et al. [27] and Matsumoto et al. [28] formed a bubble cloud with high-frequency pulses and collapsed it with low-frequency pulses to increase stone fragmentation efficiency.
Here we propose a strategy to enhance cavitation-induced, soft tissue erosion in which a short, high-intensity sequence of pulses is used to initiate erosion and lower intensity pulses and to sustain the process. The concept behind this strategy is to generate cavitation nuclei using high-intensity pulses that provide seeds for the subsequent lower intensity pulses to sustain cavitation and erosion. The formation of this idea is based on our previous observation that it takes a significantly longer time for lower intensity pulses to initiate the variable acoustic backscatter (indication of cavitation) as well as erosion [2]. The energy applied prior to initiation contributed nothing to erosion. If we use lower intensity pulses for erosion but ensure an instantaneous initiation by a short, higher-intensity sequence, the wasted energy spent before the initiation might be saved, reducing thermal complications. By using the high-intensity initiating sequence strategy, we hope to sustain erosion at a much lower average intensity and with less overall propagated energy. This may help to reduce thermal damage to overlying and surrounding tissue, which has been a general concern for ultrasound therapy. It also may reduce the probability of thermal damage to the therapy transducer.
We will test this supposition by studying the effects of the initiating sequence on erosion characterized by the probability of erosion, the erosion rate, and active cavitation sustained by lower intensity sustaining pulses. Active cavitation here is defined as a cascade of cavitation activities violent enough to cause grossly observable tissue erosion, detected by the enhanced and variable acoustic backscatter. This variable acoustic backscatter is likely the sound reflection from a cluster of cavitating bubbles (bubble cloud) in the erosion zone. We examined how often active cavitation extinguishes (probability of extinction) after initiated, the duration of each active cavitation period (initiated time), and the waiting time between adjacent active cavitation periods (extinguished time).
Note that erosion here is defined as obvious tissue removal that can be visually distinguished from the surrounding tissue. The definition for perforation is detailed in Section II-D.
II. Methods
A. Sample Tissue Preparation
Porcine atrial wall tissues were used in the in vitro erosion experiment. Porcine atrial wall was chosen because it is similar to the human neonatal atrial septum in tissue structure and geometry and has a more uniform and larger surface area to work with in comparison to the atrial septum [29]. The porcine atrial wall was obtained from a commercial abattoir (Northwest Meat Market, Jackson, MI), stored in a 0.9% saline at 4°C, and used for the experiments within 24 h of harvesting.
B. Ultrasound Generation
A 788-kHz, single-element, focused PZT custom-made transducer (Etalon, Inc., Lebanan, IN) was used to generate the pulsed ultrasound for creating erosion. The 788-kHz therapy transducer has an 8.8-cm outer diameter, an 8.8-cm focal length, and a 3.7-cm inner diameter hole for mounting a monitoring transducer. A block diagram of the experimental setup is shown in Fig. 1. The radiofrequency (RF) signal driving the therapy transducer was produced by a function generator (Model 3314A, Agilent Technology, Palo Alto, CA) and amplified by an RF am-plifier (Model A-1000, ENI Inc., Rochester, NY). The electrical impedance of the therapy transducer was matched to the output impedance of the amplifier by an external matching network. To obtain the waveform with a high-intensity, initiating sequence consisting of multiple pulses followed by lower intensity sustaining pulses (Fig. 2), the amplitude of the RF signal was modulated via the external amplitude modulation input on the function generator. As such, the amplitude and number of pulses within the high-intensity, initiating sequence can be modulated by the peak amplitude and width of a square pulse, respectively. The amplitude of lower intensity sustaining pulses can be modulated by baseline voltage of the square pulse. The square pulse was generated by a multifunction data acquisition (DAQ) board (Model PCI-6014, National Instruments, Austin, TX) using Labview (Labview 7.1, National Instruments, Austin, TX) software.
Fig. 1.

Experimental setup. The 788-kHz transducer delivered pulsed ultrasound for tissue erosion. The 20-MHz transducer was used to measure the tissue thickness at the focus of the 788-kHz transducer to be perforated (connection A). The 5-MHz transducer was used to monitor acoustic backscatter from the therapy pulse at 788 kHz (connection B). All three transducers were aligned coaxially. An angled sound absorber was placed between the tissue and the 20-MHz transducer during the ultrasound treatment to reduce the sound reflection, but it was removed for the measurement of tissue thickness.
Fig. 2.

Schematic of the waveform of ultrasound pulses used for erosion, including a high-intensity, initiating sequence containing multiple pulses followed by lower intensity sustaining pulses. There was only one initiating sequence at the beginning of each exposure. The acoustic parameters used for the initiating sequence and sustaining pulses are listed in Table II.
The transducer was mounted to a three-dimensional (3-D) mechanical positioning system (Model A-25, Velmex Inc., Bloomfield, NY) and suspended from a water tank. The positioning system precisely located the transducer focus for multiple erosion sites in one tissue sample. Experiments were conducted in a 61-cm long × 28-cm wide × 30.5-cm high tank filled with water degassed [30] to a desired level prior to the experiment.
C. Ultrasound Calibration
The acoustic field of the 788-kHz transducer was measured by a bilaminar, shielded PVDF membrane hydrophone (Model IP056, Marconi Center, Chelmsford, UK). The hydrophone was calibrated by Sonic Consulting, Inc. (Wyndmoor, PA) in the frequency range of 0.25–20 MHz. The calibration was done following the procedures prescribed by the American Institute of Ultrasound in Medicine (AIUM) [31]. The transducer and the hydrophone were submerged in a tank containing degassed water (gas concentration of ~20%). The transducer was excited by a three-cycle pulse at a PRF of 1 Hz. The pulse duration (PD) of three cycles was used for all the exposures. Ultrasound signals were detected by the hydrophone placed at the focus of the ultrasound field. The lateral and axial beam profiles across the focus and the physical waveform at the focus also were recorded.
The calibrated field parameters in the focal plane include the spatial peak, pulse average intensity (ISPPA), peak rarefractional and compressional pressures, beam cross-sectional area, pulse duration in μs, and spatial peak, temporal average intensity (ISATA) all defined by AIUM [31]. They are measured for free-field condition only and listed in Table I. Both the pulse duration in microseconds and the beam cross-sectional area decrease with increasing ISPPA, due to the nonlinear propagation of sound at high intensity. The beam cross-sectional area and ISATA were recorded to calculate the total propagated energy, which will be detailed in Section II-G.
TABLE I.
ISPPA, Peak Rarefractional Pressure, Peak Compressional Pressure, ISATA and Beam Cross-sectional Area.1
| ISPPA2 (W/cm2) | p+ (MPa) | p− (MPa) | Pulse duration (μs) | ISATA (W/cm2) | 3 dB Beam cross-section radius (mm) | Beam cross-sectional area (mm2) |
|---|---|---|---|---|---|---|
| 1000 | 7.8 | 5.2 | 3.77 | 41 | 1.27 | 5.06 |
| 2000 | 11.7 | 6.6 | 3.74 | 80 | 1.26 | 4.98 |
| 3000 | 15.2 | 7.5 | 3.71 | 115 | 1.24 | 4.81 |
| 4000 | 18.3 | 8.3 | 3.41 | 149 | 1.21 | 4.57 |
| 9000 | 36 | 11.6 | 3.32 | 329 | 1.13 | 4.03 |
PD of three cycles and PRF of 20 kHz.
ISPPA = spatial peak, pulse average intensity; p+ = peak compressional pressure; p− = peak rarefractional pressure; ISATA = spatial average temporal average intensity.
D. Backscatter Acquisition and Processing
To monitor the cavitation activity in the erosion zone, acoustic backscatter signals from the primary therapy pulse at 788 kHz were received by a 5-MHz, single-element, focused transducer (Valpey Fisher Corporation, Hopkinton, MA). The 5-MHz transducer has a 2.5-cm diameter and a 10-cm focal length. It was mounted coaxially with the 788-kHz therapy transducer by being fixed in its central inner hole. The 5-MHz transducer was used because it has a wide bandwidth (−6 dB bandwidth of 4-MHz) to detect the primary and higher frequency harmonic components.
The acoustic backscattering signal was recorded as the output voltage of the 5-MHz monitoring transducer. A-line backscatter signals were recorded in a 20-μs range gated window that was from the erosion zone by a digital oscilloscope (Model 9354TM, LeCroy, Chestnut Ridge, NY). The recorded signals then were transferred to a computer via GPIB and processed in the Matlab program (Mathworks, Natick, MA).
Because initiation and extinction of the temporally changing acoustic backscatter may provide useful temporal information about activity of the cavitating bubble cloud, we have developed statistical criteria to detect initiation and extinction based on the significantly increasing and decreasing backscatter temporal variability, respectively. To estimate thresholds of backscatter temporal variability for initiation and extinction detection, uninitiated backscatter signals were recorded prior to each exposure by applying a 10-s exposure at the sustaining pulse intensity. The statistical criteria, procedures and setup for initiation and extinction detection are detailed in our previous paper [2]. It was noted that, when tissue was perforated, the backscatter variability greatly decreased and was detected as an extinction based on our criteria. Therefore, extinction of the variable backscatter was used as the basis for perforation detection. Perforation is determined as the last extinction detected before perforation was visually observed. Examples of backscatter signals, detection of initiation, and extinction of the highly variable backscatter are shown in Fig. 3.
Fig. 3.

Acoustic backscatter signals received by the 5-MHz, passive transducer to illustrate initiation and extinction of the variable acoustic backscatter. Panels A and B show examples of backscatter in a fast time and slow time display, using pulses at ISPPA of 4000 W/cm2 without and with a 200-pulse, 9000 W/cm2 initiating sequence, respectively. Each vertical line shows the backscatter recorded in a range gated 20-μ s window in which voltage output of the 5-MHz transducer is encoded in gray scale. The x-axis is treatment time in seconds. The shift of backscatter at 200 to 300 s is likely due to the movement of cavitating bubbles away from the transducer as a result of a combination of radiation force and the progression of tissue erosion. Because the applied pressure is high, the associated acoustic radiation force could push these bubbles away from the transducer significantly. In addition, the tissue front surface, which serves as a boundary to hold cavitating bubbles, shifts away from the transducer as erosion progresses. Panels C and D represent the backscatter energy moving standard deviation as a function of treatment time, which is used to detect initiation and extinction of the backscatter in Panels A and B, respectively. For the treatment without any initiating sequence, as shown in Panels A and C, the variable backscatter was initiated at “a”, extinguished at “b”, spontaneously reinitiated at “c”, and tissue was perforated at “d”. For the treatment with a 200-pulse initiating sequence, as shown in Panels B and D, the variable backscatter was initiated rapidly (“e”) by the initiating sequence, and tissue was perforated at “f”. A PD of three cycles, a PRF of 20 kHz, and gas concentration range of 37%–47% were used in both treatments.
E. Tissue Thickness Measurement
Erosion rate is defined as the thickness of tissue eroded divided by the erosion time and used as one of the evaluations for erosion. To measure the tissue thickness, a 20-MHz, 3-mm diameter, single-element, unfocused transducer (Model V316-SU, Panametrics, Waltham, MA) was used to measure the tissue thickness placed at the focus of the 788-kHz therapy transducer (i.e., the location of perforation). It was mounted to a miniature, 2-D translation stage (Model M-DS25-XY, Newport Corporation, Irvine, CA), which was suspended in the tank. The 20-MHz transducer was aligned coaxially with and facing the therapy transducer by adjusting the 2-D translation stage.
Prior to each exposure, the tissue was placed approximately 3 cm in front of the 20-MHz transducer. The transducer then was pulsed and the echo received from the tissue via a pulser-receiver (Model PR 5072, Panametrics, Waltham, MA). The waveform of the tissue echo then was displayed on a digital oscilloscope (Model 9354TM, LeCroy, Chestnut Ridge, NY). The time delay between the front and back surface of the tissue (Ttissue) was estimated from the echo waveform. The tissue thickness was calculated by multiplying Ttissue and ν (speed of sound in the porcine atrial wall is 1.519 mm/μs at 21°C [29]) divided by two. At a 3-cm distance with the 20-MHz transducer in pulse-echo mode, the −3 dB beamwidth of echo intensity is 0.39 mm from the simulation using an ultrasound field simulation software Field II (Technical University of Denmark, Lyngby, Denmark) and 0.61 mm from the actual measurement. The discrepancy between simulation and actual measurement may be due to an effective element diameter smaller than 3 mm. A figure illustrating the echo waveform from a porcine atrial wall tissue obtained from the 20-MHz transducer was given in our previous paper [1]. Tissue thickness could not be monitored in real time due to the interference from harmonics of the high-pressure, therapy pulses due to nonlinear propagation and broadband noise generated by cavitating bubbles during the exposure.
F. Experimental Procedure
The porcine atrial wall tissue was clamped in the tissue holder and submerged in the tank with water degassed to the desired level prior to the experiment. First, the tissue was positioned approximately 3 cm in front of the 20-MHz transducer to measure the tissue thickness at the location to be perforated. Second, the tissue was moved to the focus of the 788-kHz transducer and an angled sound absorber (40 Durometer, Sorbothane Inc., Kent, OH) was placed between the tissue and the 20-MHz transducer to reduce the sound reflection from the 20-MHz transducer and the back of the tank. Third, approximately 10-s ultra-sound pulses at the sustaining pulse intensity (e.g., ISPPA of 1000–4000 W/cm2) were applied, and acoustic backscatter signals from the erosion zone without any high degree changes (uninitiated backscatter) were received by the passive 5-MHz transducer. The uninitiated backscatter waveforms were used to estimate the thresholds for initiation and extinction detection. Fourth, a 480-s ultrasound exposure with or without the initiating sequence (described in detail later) was delivered to the tissue by the 788-kHz transducer. Backscatter signals were recorded and processed to detect initiations and extinctions as described above. On each tissue, three to four exposures were applied to separate locations at least 1 cm apart. Fifth, after sonication, the diameter of erosion or perforation was measured with a caliper (0.05 mm accuracy) by hand, and pictures of tissue were taken for further analysis.
G. Experimental Parameters
One initiating sequence consisting of multiple pulses at ISPPA of 9000 W/cm2 followed by lower intensity sustaining pulses (Fig. 2) was used in each exposure throughout the whole study. An ISPPA of 9000 W/cm2 was chosen for initiating sequence pulses because it initiates the variable backscatter within 10 ms (200 pulses) [2]. The number of pulses within the initiating sequence and the intensity of sustaining pulses were varied. A total of 16 combinations of parameters consisting of four different numbers of pulses per initiating sequence and four different intensities for sustaining pulses were tested (Table II). The number (duration) of pulses within the initiating sequence was chosen to be 200 (10 ms) and above to ensure initiation. ISPPA values of 1000–4000 W/cm2 were chosen for sustaining pulses because it is the intensity regime below and close to erosion threshold (ISPPA of 3220 W/cm2 defined as erosion Pr = 0.5 [29]) for which either cavitation cannot be initiated or the initiation takes a very long time. Sample sizes are 8–12 for each combination of parameters.
TABLE II.
Experimental Parameters.
| Constant parameters | Varied parameters | |
|---|---|---|
| Initiating pulse ISPPA | 9000 W/cm2 | Sustaining pulse ISPPA: 1000 W/cm2, 2000 W/cm2, 3000 W/cm2, 4000 W/cm2 |
| PRF | 20 kHz | |
| PD | 3 cycles | Number (duration) of pulses per initiating sequence: 0, 200 (10 ms), 2,000 (100 ms), 20,000 (1 s) |
| Gas concentration | 37%–47% | |
| Total exposure time | 480 s (8 min) |
The same PD (three cycles) and PRF (20 kHz) pair was used to both the initiating sequence and sustaining pulses because it achieved the highest erosion rate at ISPPA of 9000 W/cm2 and gas concentration range of 40–55% in our prior work [1]. The total duration of each exposure (including initiating sequence and sustaining pulses) was 480 s. The gas concentration was in the range of 37–47%. The partial pressure of oxygen (PO2) in air was used as our metric for gas concentration and measured with a YSI dissolved oxygen instruments (Model 5000, YSI, Yellow Springs, OH).
To estimate how much more energy was delivered by adding the initiating sequence, the total propagated energy was calculated using the following formula.
where W is the temporal average power delivered by the transducer, T is the exposure time, ISATA is the spatial average temporal average intensity, and ABCS is the beam cross-sectional area. The values for ISATA and beam cross-sectional area are listed in Table I. The increase in total propagated energy by adding an initiating sequence is listed in Table III.
TABLE III.
Total Propagated Energy without the Initiating Sequence and the Energy Increase by Adding the Initiating Sequence.1
| No initiating pulses | Number of initiating pulses | |||
|---|---|---|---|---|
| ISPPA (W/cm2) | Propagated power (W) | 200 Energy increase2 | 2,000 Energy increase2 | 20,000 Energy increase2 |
| 1000 | 2.1 | 0.011% | 0.111% | 1.107% |
| 2000 | 4.0 | 0.005% | 0.048% | 0.480% |
| 3000 | 5.6 | 0.003% | 0.029% | 0.289% |
| 4000 | 6.8 | 0.019% | 0.226% | 2.160% |
480-s exposure, PD = three cycles, PRF = 20 kHz.
Energy increase refers to the percentage of increase in total propagated energy with the initiating sequence over that without the initiating sequence. When perforation occurred, the total propagated energy was calculated using the exposure time to reach perforation. When perforation did not occur within the 480-s exposure time, the total propagated energy was calculated using 480 s as the exposure time. At 4000 W/cm2, perforation occurred within the 480-s exposure, resulting in a shorter exposure time and higher energy increase percentage.
III. Results
A total of 143 exposures applied to 48 pieces of porcine atrial wall tissue were included in the following analysis. The number of exposures applied, erosions and perforations generated, and initiations and extinctions detected for each parameter combination are summarized in Table IV.
TABLE IV.
Summary of the Number of Exposures (Sample Sizes), Erosions, Perforations, Initiations and Extinctions.
| Sustaining pulse ISPPA | Number of pulses per initiating sequence | Length of initiating sequence | Sample sizes | Number of erosions | Number of perforations | Number of initiations | Number of extinctions (excluding perforation) |
|---|---|---|---|---|---|---|---|
| 1000 W/cm2 | 0 | 0 | 12 | 0 | 0 | 0 | 0 |
| 200 | 10 ms | 8 | 0 | 0 | 1 | 1 | |
| 2,000 | 100 ms | 8 | 0 | 0 | 1 | 1 | |
| 20,000 | 1 s | 8 | 0 | 0 | 3 | 3 | |
| 2000 W/cm2 | 0 | 0 | 12 | 0 | 0 | 1 | 1 |
| 200 | 10 ms | 8 | 7 | 0 | 8 | 8 | |
| 2,000 | 100 ms | 8 | 7 | 0 | 8 | 8 | |
| 20,000 | 1 s | 8 | 8 | 0 | 8 | 8 | |
| 3000 W/cm2 | 0 | 0 | 11 | 4 | 0 | 4 | 4 |
| 200 | 10 ms | 8 | 8 | 0 | 8 | 8 | |
| 2,000 | 100 ms | 8 | 8 | 0 | 8 | 8 | |
| 20,000 | 1 s | 8 | 8 | 1 | 8 | 8 | |
| 4000 W/cm2 | 0 | 0 | 12 | 12 | 12 | 12 | 6 |
| 200 | 10 ms | 8 | 8 | 8 | 8 | 2 | |
| 2,000 | 100 ms | 8 | 8 | 8 | 8 | 1 | |
| 20,000 | 1 s | 8 | 8 | 8 | 8 | 1 |
A. Effects of the Initiating Sequence on Erosion
1. Probability of Erosion
The probability of erosion is defined as the number of trials in which erosion was observed divided by the total number of trials using the same parameter set. The probability of erosion as a function of the number of pulses within the initiating sequence is plotted in Fig. 4. At ISPPA of 1000 W/cm2, erosion was never observed, probably because this intensity is too low to sustain active cavitation. At ISPPA of 2000 W/cm2 or 3000 W/cm2, the probability of erosion was significantly higher with the initiating sequence than without, even though the total propagated energy was almost the same (Table III). For example, with pulses having only ISPPA of 2000 W/cm2 pulses, erosion was never observed. By adding a 200-pulse, 9000 W/cm2 initiating sequence (0.005% increase of total propagated energy), the probability of erosion was increased to 0.875 (7 of 8). Again, the probability of erosion was 0.364 (4 of 11) with ISPPA of 3000 W/cm2 pulses alone, but increased to 1 (8 of 8) after adding a 200-pulse initiating sequence, with 0.003% increase in total propagated energy. Fig. 5 presents pictures of tissue effects produced by 2000 W/cm2 pulses with and without the initiating sequence. At ISPPA of 4000 W/cm2, erosion was always observed with or without the initiating sequence. Our previous studies have shown that ISPPA of 4000 W/cm2 is sufficiently high to initiate active cavitation by itself, although the initiation takes a long time [2].
Fig. 4.
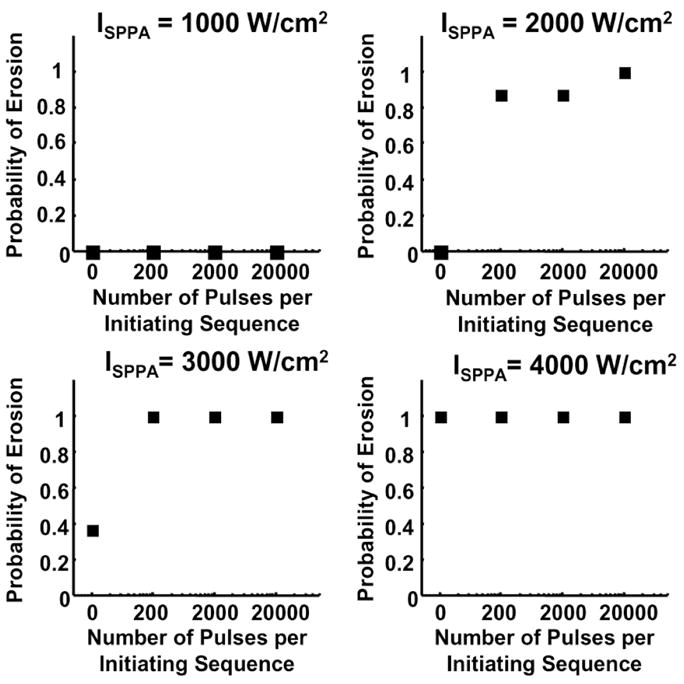
Effects of the initiating sequence on the probability of erosion. Panels A, B, C, and D show the probability of erosion as a function of the number of pulses per initiating sequence with sustaining pulses at ISPPA values of 1000, 2000, 3000, and 4000 W/cm2, respectively. The acoustic parameters and sample sizes are listed in Tables I–IV.
Fig. 5.

Tissue effects produced at the same sustaining pulse intensity with and without the initiating sequence. Panels A, B, C, and D show the tissue effects generated by a 480-s, 2000 W/cm2 ultrasound exposure with the initiating sequence containing 0, 200, 2000, 20,000 pulses, respectively. In Panel A, no effects were generated by the 2000 W/cm2 pulses alone. In Panels B, C, and D, erosion was created by adding the initiating sequence. The appearances of these erosions are essentially the same with slight inconsistencies, mostly due to the thickness difference of tissues.
One might expect that some erosion would be caused by the initiating sequence. However, experimental observations show that the initiating sequence alone never created any tissue erosion because of the small number of pulses, even though it sometimes caused disruption of the surface membrane.
2. Erosion Rate
The erosion rate here is calculated only when perforation occurs. When erosion occurs without perforation, the erosion area is often equal or smaller than the focal beamwidth of the 20-MHz transducer. As a result, the 20-MHz transducer is unable to provide an accurate measurement of the on-axis thickness of tissue eroded. Fig. 6 shows the erosion rate using sustaining pulses at ISPPA of 4000 W/cm2 with and without the initiating sequence. In Fig. 6(A), erosion rate is calculated using the total exposure time to reach perforation. The erosion rate calculated using this exposure time was higher with the initiating sequence than without (P < 0.05; T-test).
Fig. 6.

Erosion rate at ISPPA of 4000 W/cm2 with and without the initiating sequence. Panel A shows the erosion rate calculated using total exposure time to reach perforation. Erosion rate is significantly faster (p < 0.05) with the initiating sequence than without. Panel B shows the erosion rate calculated using initiated time. Using the time in which there is actual cavitation activity results in a consistent erosion rate (i.e., no statistical difference (p ≥ 0.05)). The erosion rate is plotted as mean and standard deviation values.
This result was expected assuming cavitation to be the primary cause of erosion, as the period of time before initiation of active cavitation produced no erosion. If the erosion rate is calculated only taking into account the active cavitation time (initiated time) instead, the erosion rate might be comparable with and without an initiating sequence. Initiated time is defined as the period of time when the variable backscatter is observed. In Fig. 6(B), erosion rate is calculated using the total initiated time prior to perforation as perforation time. The result agrees with the above supposition: erosion rate calculated using the initiated time was similar with and without an initiating sequence (P ≥ 0.05; T-test).
B. Effects of the Initiating Sequence on Cavitation
Because the temporally variable acoustic backscatter is regarded as an indicator of cavitation, the dependence of initiation and extinction of the variable backscatter on the initiating sequence was investigated to study its effects on active cavitation.
1. Probability of Extinction
The probability of extinction here is defined as the number of trials in which extinction (excluding perforation) was detected divided by the number of trials in which initiation was detected using the same parameter set. Extinction of the temporally variable backscatter implies the permanent or temporary suspension of active cavitation prior to tissue perforation. Fig. 7 presents the probability of extinction as a function of the number of pulses per initiating sequence. With ISPPA ≤ 3000 W/cm2, extinction was always detected when initiation was detected, with or without the initiating sequence. At ISPPA of 4000 W/cm2, the probability of extinction was lower with the initiating sequence than without. For example, the probability of extinction was 0.5 (6 of 12) with pulses having only 4000 W/cm2, and it was decreased to 0.25 (2 of 8) with a 200-pulse initiating sequence and 0.125 (1 of 8) with a 2000-pulse initiating sequence. The overall increase in propagated energy by adding the 200-pulse and 2000-pulse initiating sequence was only 0.019% and 0.226%, respectively.
Fig. 7.
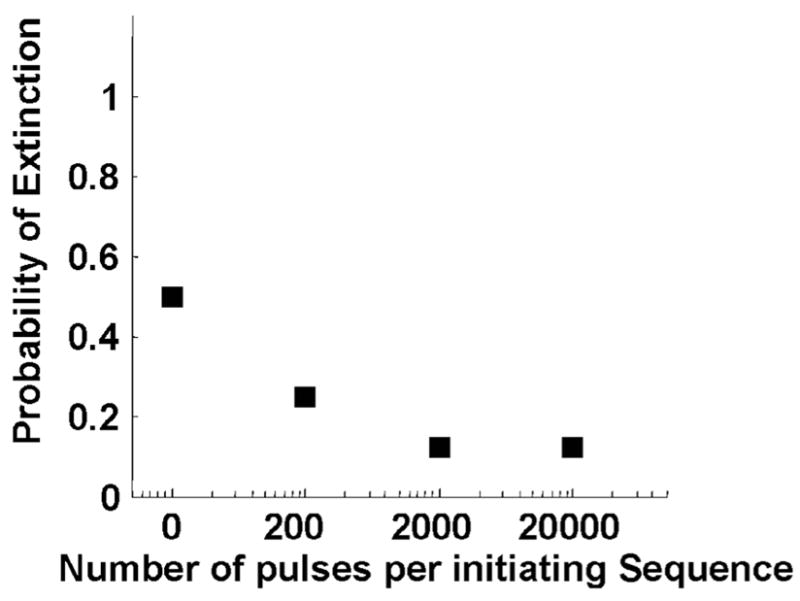
The probability of extinction versus number of pulses per initiating sequence at ISPPA of 4000 W/cm2. The probability of extinction was lower with the initiating sequence than without. With ISPPA ≤ 3000 W/cm2, extinction was always detected if initiated, resulting in a constant probability of extinction at 1.
2. Initiated Time
Effects of the initiating sequence on initiated time (when the temporally variable backscatter was observed) and extinguished time (when no variable backscatter was observed) detected by our statistical criteria are investigated. The initiated time represents the duration of active cavitation, and the extinguished time represents the waiting time between adjacent active cavitation periods. The definitions of the ith initiated time (ITi) and the ith extinguished time (ETi) are graphically depicted in Fig. 8. ITi is calculated as the time interval between the ith initiation and the ith extinction detected. The total initiated time (ITtotal) is calculated as the summation of all the ITi’s within the 480-s total exposure time. ETi is calculated as the time interval between the ith extinction and the (i + 1)th initiation. Figs. 9, 10, and 11 show the results of effects of the initiating sequence on ITi, ITtotal, and ETi, respectively.
Fig. 8.

Definition of the ith initiated time (ITi) and the ith extinguished time (ETi). Diagram of backscatter temporal variability (backscatter energy moving standard deviation described in [2]) as a function of time is drawn to demonstrate the definition of ITi and ETi. ITi is the time interval between the ith initiation and the ith extinction. ETi is the time interval between the ith extinction and the (i + 1)th initiation. An initiating sequence containing N pulses was applied at the beginning of each ultrasound exposure. The applied initiating sequence was chosen to be 10 ms (200 pulses), 100 ms (2000 pulses), or 1 s (20,000 pulses). Consequently, the initiating sequence ends within 1 s after the beginning of each 480-s exposure (shown as arrow). Experimental observations show that the initiating sequence alone never created any visible erosion due to its short duration. The corresponding erosion depth could not be monitored in real time because of the interference from harmonics of the high-pressure therapy pulses due to nonlinear propagation and broadband noise generated by cavitating bubbles during the exposure.
Fig. 9.
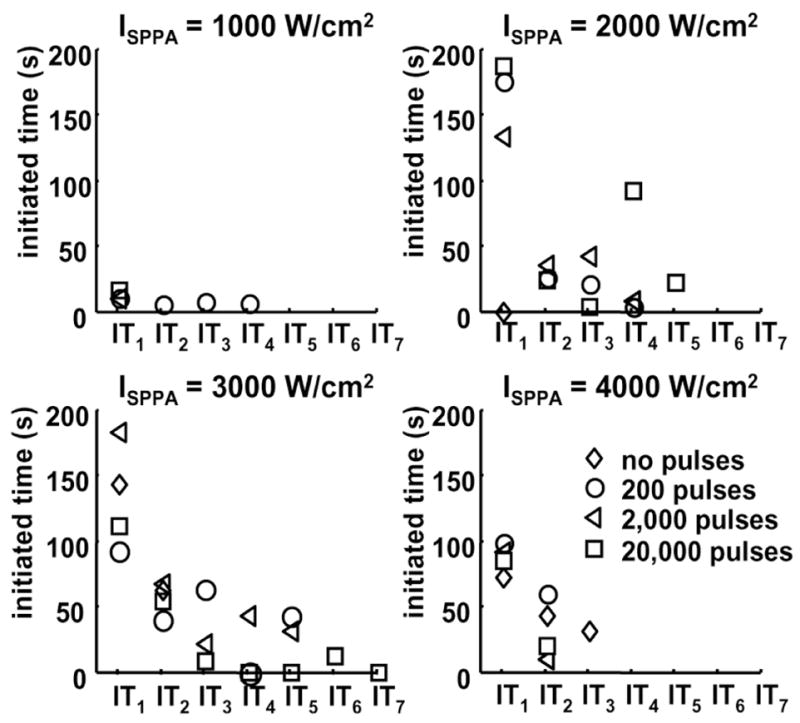
Effects of the initiating sequence on ITi. Panels A, B, C, and D show ITi as a function of i at ISPPA of 1000, 2000, 3000, and 4000 W/cm2, respectively. Diamond, circle, triangle, and square represent ITi for 0, 200, 2000, and 20,000 pulses within the initiating sequence. ITi is plotted as mean values. Regardless of the number of pulses within the initiating sequence, mean values of ITi has an overall trend of decreasing with increasing i. Definition of ITi is depicted in Fig. 8. The acoustic parameters are listed in Table II. The values and sample sizes of ITi are listed in Tables V and VI, respectively.
Fig. 10.

Effects of the initiating sequence on the total initiated time (ITtotal) within the 480-s exposure. Panels A, B, C, and D show ITtotal versus the number of pulses per initiating sequence at ISPPA of 1000, 2000, 3000, and 4000 W/cm2, respectively. ITtotal is plotted as mean and standard deviation values. The acoustic parameters and sample sizes are listed in Tables I–IV.
Fig. 11.
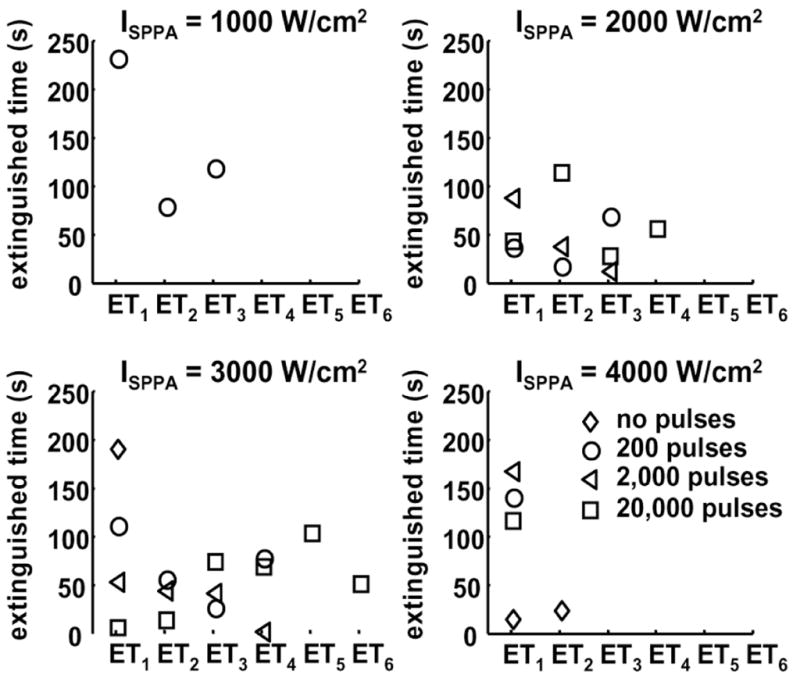
Effects of the initiating sequence on ETi. Panels A, B, C, and D show ETi as a function of i at ISPPA of 1000, 2000, 3000, and 4000 W/cm2, respectively. Diamond, circle, triangle, and square represent ETi for 0, 200, 2000, and 20,000 pulses within the initiating sequence, respectively. ETi is plotted as mean values. Definition of ETi is depicted in Fig. 8. The acoustic parameters are listed in Table II. The values and sample sizes of ETi are listed in Tables VII and VIII, respectively.
The results show a decreasing trend of ITi with increasing i (Fig. 9, Table V) regardless of the number of pulses within the initiating sequence. Moreover, the sample size of ITi (the number of trials in which ITi was observed) also decreased with increasing i (Table VI). In fact, summation of the sample size of IT1 (93) and IT2 (41) represents 80% of the total number of ITi. The above data suggest that reinitiation of the active cavitation becomes more difficult after each extinction, and the duration of each subsequent reinitiation decreases. When analyzing the ITi values versus the number of pulses in the initiating sequence (for a fixed i value), no discernable trends were observed, suggesting that ITi is independent of the number of pulses in the initiating sequence.
TABLE V.
Mean and Standard Deviation Values of the ith Initiated Time (ITi).
| Number of pulses per initiating sequence | ITi (mean ± standard deviation) (s) |
|||||||
|---|---|---|---|---|---|---|---|---|
| ISPPA (W/cm2) | IT1 | IT2 | IT3 | IT4 | IT5 | IT6 | IT7 | |
| 1000 | 0 | |||||||
| 200 | 12.3 ± 0 | 7.0 ± 0 | 8.9 ± 0 | 8.2 ± 0 | ||||
| 2,000 | 12.0 ± 0 | |||||||
| 20,000 | 18.3 ± 26.6 | |||||||
| 2000 | 0 | 1.4 ± 0 | ||||||
| 200 | 177.0 ± 136.9 | 27.2 ± 19.0 | 23.2 ± 0 | 5.5 ± 0 | ||||
| 2,000 | 135.2 ± 88.0 | 36.9 ± 40.9 | 44.3 ± 50.0 | 10.1 ± 0 | ||||
| 20,000 | 189.3 ± 154.8 | 25.8 ± 34.5 | 5.3 ± 2.7 | 93.3 ± 0 | 23.6 ± 0 | |||
| 3000 | 0 | 145.4 ± 68.4 | 64.1 ± 0 | |||||
| 200 | 93.9 ± 41.9 | 41.1 ± 62.7 | 64.8 ± 88.5 | 1.9 ± 0 | 44.2 ± 0 | |||
| 2,000 | 184.7 ± 135.8 | 69.4 ± 75.6 | 23.3 ± 12.5 | 45.5 ± 52.0 | 33.7 ± 26.5 | |||
| 20,000 | 113.4 ± 62.1 | 56.1 ± 72.9 | 10.4 ± 7.3 | 1.4 ± 0 | 1.4 ± 0 | 14.0 ± 0 | 1.7 ± 0 | |
| 4000 | 0 | 74.1 ± 44.7 | 44.8 ± 36.1 | 33.8 ± 29.1 | ||||
| 200 | 100.8 ± 50.4 | 61.4 ± 0 | ||||||
| 2,000 | 93.3 ± 34.5 | 12.1 ± 0 | ||||||
| 20,000 | 86.7 ± 27.4 | 21.5 ± 0 | ||||||
TABLE VI.
Sample Size of ITi (n(ITi)).
| Number of pulses per sequence |
n(Iti) |
|||||||
|---|---|---|---|---|---|---|---|---|
| ISPPA (W/cm2) | n(IT1) | n(IT2) | n(IT3) | n(IT4) | n(IT5) | n(IT6) | n(IT7) | |
| 1000 | 0 | 0 | 0 | 0 | 0 | 0 | 0 | 0 |
| 200 | 1 | 1 | 1 | 1 | 0 | 0 | 0 | |
| 2,000 | 1 | 0 | 0 | 0 | 0 | 0 | 0 | |
| 20,000 | 3 | 0 | 0 | 0 | 0 | 0 | 0 | |
| 2000 | 0 | 1 | 0 | 0 | 0 | 0 | 0 | 0 |
| 200 | 7 | 4 | 1 | 1 | 0 | 0 | 0 | |
| 2,000 | 8 | 4 | 2 | 1 | 0 | 0 | 0 | |
| 20,000 | 8 | 4 | 2 | 1 | 1 | 0 | 0 | |
| 3000 | 0 | 4 | 1 | 0 | 0 | 0 | 0 | 0 |
| 200 | 8 | 6 | 3 | 1 | 1 | 0 | 0 | |
| 2,000 | 8 | 7 | 3 | 2 | 2 | 0 | 0 | |
| 20,000 | 8 | 5 | 3 | 1 | 1 | 1 | 1 | |
| 4000 | 0 | 12 | 6 | 2 | 0 | 0 | 0 | 0 |
| 200 | 8 | 1 | 0 | 0 | 0 | 0 | 0 | |
| 2,000 | 8 | 1 | 0 | 0 | 0 | 0 | 0 | |
| 20,000 | 8 | 1 | 0 | 0 | 0 | 0 | 0 | |
| Total number | 93 | 41 | 17 | 8 | 5 | 1 | 1 | |
| Total number of all the n(ITi): | 166 | |||||||
Note that IT1 at ISPPA of 4000 W/cm2 is lower compared to IT1 at ISPPA of 2000 W/cm2 and 3000 W/cm2. In addition, at ISPPA of 4000 W/cm2, the sample size of ITi is zero for i ≥ 3 with an initiating sequence and i ≥ 4 without an initiating sequence. This resulted because perforation always occurred at ISPPA of 4000 W/cm2 and occurred primarily within IT1 or IT2. Almost no backscatter reflected from erosion zone after perforation, resulting in reduction of ITi and the sample size of ITi at ISPPA of 4000 W/cm2.
3. Total Initiated Time (ITtotal)
ITtotal as a function of the number of pulses per initiating sequence is plotted in Fig. 10. Once initiated, ITtotal seems to have no discernable pattern, indicating no dependence of the total cavitation time on the number of pulses within the initiating sequence or ISPPA of the sustaining pulses. ITtotal was lower at ISPPA at 4000 W/cm2 than at ISPPA of 2000 W/cm2 or 3000 W/cm2 due to the occurrence of perforation.
4. Extinguished Time (ETi)
No observable trend was found in ETi as a function of i or the number of pulses in the initiating sequence (Fig. 11). However, a histogram of all 73 ETi’s (Fig. 12) show that approximately 70% of ETi fall within the 75-s or lower group. These suggest that, if reinitiated, the waiting time between the extinction and the succeeding reinitiation of active cavitation is random, but it is likely to be less than 75 s. The mean and standard deviation values of ETi, and the sample size of ETi for each combination of parameters are listed in Tables VII and VIII, respectively.
Fig. 12.

Histogram of all ETi. A total of 73 ETi’s are included. Approximately 70% of ETi fall within the 75 s or lower group.
TABLE VII.
Mean and Standard Deviation Values of the ith Extinguished Time (ETi).
| Number of pulses per sequence | ETi (mean ± standard deviation) (s) |
||||||
|---|---|---|---|---|---|---|---|
| ISPPA (W/cm2) | ET1 | ET2 | ET3 | ET4 | ET5 | ET6 | |
| 1000 | 0 | ||||||
| 200 | 234.01 ± 0 | 81.6 ± 0 | 120.6 ± 0 | ||||
| 2,000 | |||||||
| 20,000 | |||||||
| 2000 | 0 | ||||||
| 200 | 39.6 ± 29.0 | 20.3 ± 0 | 71.6 ± 0 | ||||
| 2,000 | 90.9 ± 67.2 | 40.0 ± 21.1 | 15.0 ± 0 | ||||
| 20,000 | 45.2 ± 70.7 | 115.5 ± 114.6 | 29.6 ± 0 | 57.8 ± 0 | |||
| 3000 | 0 | 192.8 ± 0 | |||||
| 200 | 112.8 ± 109.8 | 57.9 ± 44.9 | 29.0 ± 0 | 79.6 ± 0 | |||
| 2,000 | 55.6 ± 75.1 | 47.0 ± 56.7 | 44.2 ± 54.0 | 4.1 ± 2.0 | |||
| 20,000 | 8.6 ± 5.1 | 16.0 ± 6.6 | 76.6 ± 0 | 71.5 ± 0 | 106.2 ± 0 | 53.7 ± 0 | |
| 4000 | 0 | 17.8 ± 31.1 | 26.1 ± 16.5 | ||||
| 200 | 143.4 ± 0 | ||||||
| 2,000 | 170.1 ± 0 | ||||||
| 20,000 | 119.1 ± 0 | ||||||
TABLE VIII.
Sample Size of ETi (n(ETi)).
| Number of pulses per sequence |
n(ETi) |
||||||
|---|---|---|---|---|---|---|---|
| ISPPA (W/cm2) | n(ET1) | n(ET2) | n(ET3) | n(ET4) | n(ET5) | n(ET6) | |
| 1000 | 0 | 0 | 0 | 0 | 0 | 0 | 0 |
| 200 | 1 | 1 | 1 | 0 | 0 | 0 | |
| 2,000 | 0 | 0 | 0 | 0 | 0 | 0 | |
| 20,000 | 0 | 0 | 0 | 0 | 0 | 0 | |
| 2000 | 0 | 0 | 0 | 0 | 0 | 0 | 0 |
| 200 | 4 | 1 | 1 | 0 | 0 | 0 | |
| 2,000 | 4 | 2 | 1 | 0 | 0 | 0 | |
| 20,000 | 4 | 2 | 1 | 1 | 0 | 0 | |
| 3000 | 0 | 1 | 0 | 0 | 0 | 0 | 0 |
| 200 | 6 | 3 | 1 | 1 | 0 | 0 | |
| 2,000 | 7 | 3 | 2 | 2 | 0 | 0 | |
| 20,000 | 5 | 3 | 1 | 1 | 1 | 1 | |
| 4000 | 0 | 6 | 2 | 0 | 0 | 0 | 0 |
| 200 | 1 | 0 | 0 | 0 | 0 | 0 | |
| 2,000 | 1 | 0 | 0 | 0 | 0 | 0 | |
| 20,000 | 1 | 0 | 0 | 0 | 0 | 0 | |
| Total number | 41 | 17 | 8 | 5 | 1 | 1 | |
| Total number of all the n(ETi): | 73 | ||||||
IV. Discussion
We have shown that a high-intensity, initiating sequence helps to increase the probability of erosion at lower intensities with only slight increase in total propagated energy. Consequently, the intensity threshold for generating erosion is significantly lower using the initiating sequence. For example, the estimated intensity threshold for generating erosion defined as the probability of erosion at 0.5 is at ISPPA of 3220 W/cm2 [29]. The probability of erosion at 0.875 is achieved at ISPPA of 2000 W/cm2 by adding a short initiating sequence (200 three-cycle pulses) and very little overall increase in propagated energy (0.005%). As a result, the initiating sequence lowers the erosion threshold from ISPPA 3220 W/cm2 to < 2000 W/cm2.
In addition, the initiating sequence increases the erosion rate through ensuring an instantaneous initiation of cavitation such that no energy is wasted on acoustic pulses preparing for initiation though producing no erosion. The erosion rate is increased significantly with the initiating sequence than without at ISPPA of 4000 W/cm2. At Isppa < 4000 W/cm2, perforation rarely occurs, probably due to the structure of the tissue samples. Both the atrial septum and the atrial wall consist of two layers of membrane and soft muscle in between. The membrane of the atrial wall positioned farther away from the therapy transducer is tougher than the membrane closer to the transducer. At ISPPA of 3000 W/cm2, often all the soft muscle is eroded with only a piece of membrane left (Fig. 13). The membrane is harder to erode than the soft muscle tissue and requires higher intensity. It has been seen by some researchers that different tissue structures respond differently to the same ultrasound fields [10], [32], [33]. A paradigm to increase the erosion efficiency in the atrial septum and the atrial wall might be to erode soft muscle tissue with lower intensity pulses and finish perforating the last membrane structure with higher intensity pulses. Acoustic parameters might need to be chosen specifically for the tissue type as well as the application (e.g., erosion, necrosis) to achieve higher efficiency.
Fig. 13.
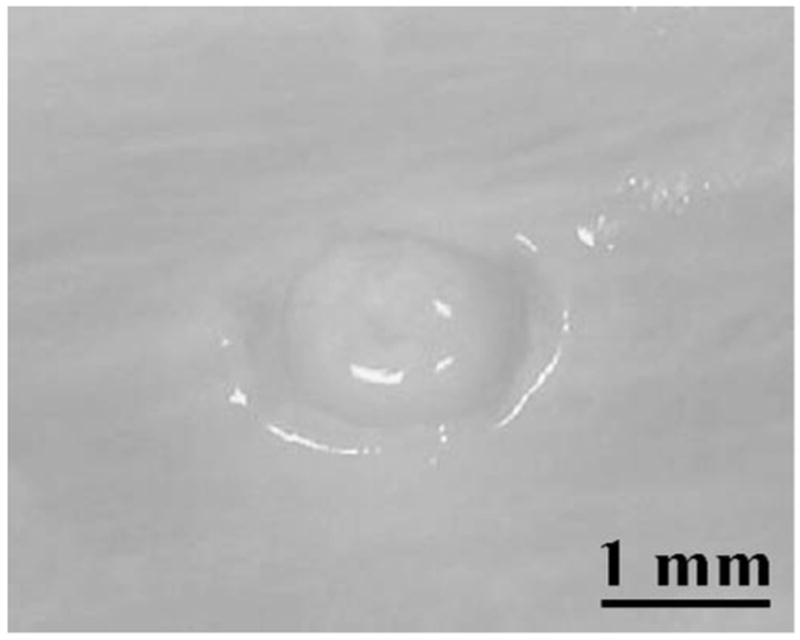
An example in which all the soft muscle tissue was eroded with only a membrane layer remaining. The erosion was produced by a 480-s ultrasound exposure at ISPPA of 3000 W/cm2 following a 2000-pulse, 9000 W/cm2 initiating sequence (100 ms). A pulse duration of three cycles and a PRF of 20 kHz were used.
We hypothesize the mechanism for this phenomenon is as follows: a cloud of microbubbles is generated by the initiating sequence, providing a set of cavitation nuclei for lower intensity pulses. This shares the same principles with microbubble-enhanced therapy, which artificially introduces cavitation nuclei to tissue and makes cavitation easier to achieve [10]–[17], [22], [34]–[38]. The initiating sequence could be considered as a source of self-generated, localized microbubbles. The advantage of using the initiating sequence is that cavitation nuclei can be generated at the desired location, instead of being present throughout the entire organ, which might result in greater collateral damage.
Some possibilities regarding details of the mechanism might be extracted from the initiated and extinguished time results. The initiated time result showing cavitation lasts for shorter duration after each successive initiation implies either depletion of certain essential components to sustain cavitation (e.g., cavitation nuclei) over time, or increased interferences (e.g., shadowing from larger bubbles). The observation of random extinguished time between adjacent active cavitation periods may suggest initiation of active cavitation as a threshold phenomenon, which occurs only when the density or population of microbubbles within a certain size range exceeds a threshold.
We also discovered that, once initiated, the duration of the active cavitation does not depend on the number of pulses within the initiating sequence. The initiating sequence containing more pulses does not seem to provide longer active cavitation or more erosion. For example, increasing number of pulses within the initiating sequence did not elongate the initiated time, the probability of erosion, or the erosion rate. More pulses in the initiating sequence may generate a similar net number of cavitation nuclei for the sustaining pulses, possibly by breaking up as many cavitation nuclei as they create. This suggests that only the minimum number of high-intensity pulses (i.e., the minimum energy) required for initiation is necessary.
Once extinguished, we have shown that active cavitation seldom reinitiates spontaneously and is shorter in duration if reinitiated. This leads to the possibility of using high-intensity pulses to reinitiate instead of waiting for a spontaneous reinitiation by the lower intensity pulses. A feedback strategy thus is formed in which the high-intensity, initiating sequence is used to initiate cavitation, lower intensity pulses are used to maintain it, and the initiating sequence is used again (when necessary) to reinitiate it when extinction is detected. This strategy may have the potential to accomplish tissue perforation with lower propagated energy, reducing overheating to overlying tissue and the transducer, which is critical for avoiding a major concern for any ultrasound therapy. It is noticed that the reinitiation never was observed after perforation. This is because the intensity threshold to initiate active cavitation detected as the variable backscatter is lower at a tissue-fluid interface than free fluid, probably due to the tissue surface boundary capturing moving microbubbles as cavitation nuclei.
If calculated using active cavitation time (initiated time), the erosion rates are similar with and without the initiating sequence, but the variances are high in both cases. The variability of biological tissue may contribute to this high variance. The quality of cavitation also may need to be quantified as well as the temporal characteristics for a more accurate correlation with erosion. Some researchers have attempted to measure the dose of inertial cavitation through acoustic backscatter (e.g., broadband noise amplitude) and related to biological effects [8], [13], [34], [39]. Unfortunately, we have had difficulty extracting broadband noise from the fundamental, harmonic, and subharmonic frequency dominating backscatter signals. For future work, we plan to investigate further the quantification of cavitation related to erosion.
V. Conclusions
A new strategy using a short, high-intensity, initiating sequence to enhance cavitation-induced, soft-tissue erosion was investigated. The initiating sequence helps to reduce the intensity threshold for generating erosion and increase the erosion rate with only slight overall increases in propagated energy. Once initiated, the duration of active cavitation detected by the temporally variable backscatter is independent of the number of pulses in the initiating sequence. If extinguished, active cavitation becomes more difficult to reinitiate and lasts shorter after each extinction. However, the waiting time between the extinction and succeeding reinitiation of the active cavitation is random.
Acknowledgments
This research has been funded by grants from the National Institutes of Health R01-RR14450 and R01-HL077629-01A1.
The authors thank Dr. Albert Levin for his tremendous help with the statistics analysis. We would also like to thank Dr. Ludomirsky for his consultation on HLHS.
Biographies
J. B. Fowlkes also is with the Department of Radiology, University of Michigan.

Zhen Xu (S’05–M’06) is a postdoctoral fellow in the Department of Biomedical Engineering at the University of Michigan, Ann Arbor, MI. She received the B.S.E. (highest honors) degree in biomedical engineering from Southeast University, Nanjing, China, in 2001, and the M.S. and Ph.D. degrees from the University of Michigan in 2003 and 2005, respectively, both in biomedical engineering.
Her research is focusing on ultrasound therapy, particularly the applications of high-intensity ultrasound for noninvasive surgeries. She was awarded a fellowship from Southeast University from 1997 to 2000 and a Department fellowship of Biomedical Engineering at the University of Michigan in 2001. She was selected as the best student paper competition finalist at 2003 IEEE International Ultrasonics Symposium and 2005 International Symposium on Therapeutic Ultrasound.
Jeffery Brian Fowlkes (M’94–A’94) is an associate professor in the Department of Radiology and associate professor in the Department of Biomedical Engineering at the University of Michigan, Ann Arbor, MI. He is currently directing and conducting research in medical ultrasound, including the use of gas bubbles for diagnostic and therapeutic applications. His work includes studies of ultrasound contrast agents for monitoring tissue perfusion, acoustic droplet vaporization for bubble production in cancer therapy, and phase aberration correction, effects of gas bubbles in high-intensity ultrasound and volume flow estimation for ultrasonic imaging.
Dr. Fowlkes received his B.S. degree in physics from the University of Central Arkansas, Conway, AR, in 1983, and his M.S. and Ph.D. degrees from the University of Mississippi, Jackson, MS, in 1986 and 1988, respectively, both in physics. Dr. Fowlkes is a fellow of the American Institute of Ultrasound in Medicine (AIUM) and has served as Secretary and as a member of its Board of Governors. He also received the AIUM Presidential Recognition Award for outstanding contributions and service to the expanding future of ultrasound in medicine.
As a member of the Acoustical Society of America, Dr. Fowlkes has served on the Physical Acoustics Technical Committee and the Medical Acoustics and Bioresponse to Vibration Technical Committee. As a Member of the IEEE, he has worked with the IEEE I&M Society Technical Committee on Imaging Systems. Dr. Fowlkes is a Fellow of the American Institute of Medical and Biomedical Engineering.

Charles A. Cain (S’65–M’71–SM’80–F’89) was born in Tampa, FL, on March 3, 1943. He received the B.E.E. (highest honors) degree in 1965 from the University of Florida, Gainesville, FL; the M.S.E.E. degree in 1966 from the Massachusetts Institute of Technology, Cambridge, MA; and the Ph.D. degree in electrical engineering in 1972 from the University of Michigan, Ann Arbor, MI.
During 1965–1968, he was a member of the Technical Sta3 at Bell Laboratories, Naperville, IL, where he worked in the electronic switching systems development area. During 1972–1989, he was in the Department of Electrical and Computer Engineering at the University of Illinois at Urbana-Champaign, where he was a professor of electrical engineering and bioengineering. Since 1989, he has been in the College of Engineering at the University of Michigan, Ann Arbor, as a professor of biomedical engineering and of electrical engineering. He was the Chair of the Biomedical Engineering Program from 1989 to 1996; the Founding Chair of the Biomedical Engineering Department from 1996–1999; and was named the Richard A. Auhll Professor of Engineering in 2002.
He has been involved in research on the medical applications of ultrasound, particularly high-intensity ultrasound for noninvasive surgery. He was formerly an Associate Editor of the IEEE Transactions on Biomedical Engineering and the IEEE Transactions on Ultrasonics, Ferroelectrics, and Frequency Control; and an editorial board member of the International Journal of Hyperthermia and Radiation Research. He is a Fellow of the IEEE and the AIMBE.
References
- 1.Xu Z, Ludomirsky A, Eun LY, Hall TL, Tran BC, Fowlkes JB, Cain CA. Controlled ultrasound tissue erosion. IEEE Trans Ultrason, Ferroelect, Freq Contr. 2004;51:726–736. doi: 10.1109/tuffc.2004.1308731. [DOI] [PMC free article] [PubMed] [Google Scholar]
- 2.Xu Z, Fowlkes JB, Rothman ED, Levin AM, Cain CA. Controlled ultrasound tissue erosion: The role of dynamic interaction between insonation and microbubble activity. J Acoust Soc Amer. 2005;117:424–435. doi: 10.1121/1.1828551. [DOI] [PMC free article] [PubMed] [Google Scholar]
- 3.Fairbank WM, Scully MO. A new non-invasive technique for cardiac pressure measurement resonant scattering of ultrasound from bubble. IEEE Trans Biomed Eng. 1977;BME-24:107–110. doi: 10.1109/TBME.1977.326112. [DOI] [PubMed] [Google Scholar]
- 4.Atchley AA, Frizzell LA, Apfel RE, Holland CK, Madanshetty S, Roy RA. Thresholds for cavitaion produced in water by pulsed ultrasound. Ultrasonics. 1988;26:280–285. doi: 10.1016/0041-624x(88)90018-2. [DOI] [PubMed] [Google Scholar]
- 5.Holland CK, Apfel RE. Thresholds for transient cavitation produced by pulsed ultrasound in a controlled nuclei environment. J Acoust Soc Amer. 1990;88:2059–2069. doi: 10.1121/1.400102. [DOI] [PubMed] [Google Scholar]
- 6.Roy RA, Atchley AA, Crum LA, Fowlkes JB, Reidy JJ. A precise technique for the measurement of acoustic cavitation thresholds and some preliminary results. J Acoust Soc Amer. 1985;78:1799–1805. doi: 10.1121/1.392767. [DOI] [PubMed] [Google Scholar]
- 7.Chen WS, Matula TJ, Crum LA. The disappearance of ultrasound contrast bubbles: Observations of bubble dissolution and cavitation nucleation. Ultrasound Med Biol. 2002;28:793–803. doi: 10.1016/s0301-5629(02)00517-3. [DOI] [PubMed] [Google Scholar]
- 8.Everbach EC, Makin I, Azadniv M, Meltzr RS. Correlation of ultrasound-induced hemolysis with cavitation detector output in vitro. Ultrasound Med Biol. 1997;23:619–624. doi: 10.1016/s0301-5629(97)00039-2. [DOI] [PubMed] [Google Scholar]
- 9.Kripfgans OD, Fowlkes JB, Miller DL, Eldevik OP, Carson PL. Acoustic droplet vaporization for therapeutic and diagnostic applications. Ultrasound Med Biol. 2000;26:1177–1189. doi: 10.1016/s0301-5629(00)00262-3. [DOI] [PubMed] [Google Scholar]
- 10.Maruvada S, Hynynen K. Optical monitoring of ultrasound-induced bioeffects in glass catfish. Ultrasound Med Biol. 2004;30:67–74. doi: 10.1016/j.ultrasmedbio.2003.08.005. [DOI] [PubMed] [Google Scholar]
- 11.Brayman AA, Lizotte LM, Miller MW. Erosion of artificial endothelia in vitro by pulsed ultrasound: Acoustic pressure, frequency, membrane orientation and microbubble contrast agent dependence. Ultrasound Med Biol. 1999;25:1305–1320. doi: 10.1016/s0301-5629(99)00076-9. [DOI] [PubMed] [Google Scholar]
- 12.Tran BC, Seo J, Hall TL, Fowlkes JB, Cain CA. Microbubble-enhanced cavitation for noninvasive ultrasound surgery. IEEE Trans Ultrason, Ferroelect, Freq Contr. 2003;50:1296–1304. doi: 10.1109/tuffc.2003.1244746. [DOI] [PubMed] [Google Scholar]
- 13.Poliachik SL, Chandler WL, Mourad PD, Bailey MR, Bloch S, Cleveland RO, Kaczkowski P, Keilman G, Porter T, Crum LA. Effect of high-intensity focused ultrasound on whole blood with and without microbubble contrast agent. Ultrasound Med Biol. 1999;25:991–998. doi: 10.1016/s0301-5629(99)00043-5. [DOI] [PubMed] [Google Scholar]
- 14.Miller DL, Thomas RM. Contrast-agent gas bodies enhance hemolysis induced by lithotripter shock waves and high-intensity focused ultrasound in whole blood. Ultrasound Med Biol. 1996;22:1089–1095. doi: 10.1016/s0301-5629(96)00126-3. [DOI] [PubMed] [Google Scholar]
- 15.Hwang EY, Fowlkes JB, Carson PL. Variables controlling contrast generation in a urinary bladder model. J Acoust Soc Amer. 1998;103:3706–3716. doi: 10.1121/1.423070. [DOI] [PubMed] [Google Scholar]
- 16.Dalecki D, Raeman CH, Child SZ, Cox C, Francis CW, Meltzer RS, Carstensen EL. Hemolysis in vivo from exposure to pulsed ultrasound. Ultrasound Med Biol. 1997;23:307–313. doi: 10.1016/s0301-5629(96)00203-7. [DOI] [PubMed] [Google Scholar]
- 17.Miller DL, Gies RA. The influence of ultrasound frequency and gas-body composition on the contrast agent-mediated enhancement of vascular bioeffects in mouse intestine. Ultrasound Med Biol. 2000;26:307–313. doi: 10.1016/s0301-5629(99)00138-6. [DOI] [PubMed] [Google Scholar]
- 18.Huber P, Debus J, Jochle K, Siamiantonakis I, Jenne J, Rastert R, Spoo J, Lorenz WJ, Wannenmacher M. Control of cavitation activity by different shockwave pulsing regimes. Phys Med Biol. 1999;44:1427–1437. doi: 10.1088/0031-9155/44/6/301. [DOI] [PubMed] [Google Scholar]
- 19.Henglein A, Gutierrez M. Chemical reactions by pulsed ultrasound: memory effects in the formation of NO2− and NO3− in aerated water. Int J Radiat Biol. 1986;50:527–533. doi: 10.1080/09553008614550921. [DOI] [PubMed] [Google Scholar]
- 20.Tran BC, Seo J, Hall TL, Xu Z, Ives K, Fowlkes JB, Cain CA. In vivo comparison of multiple pulse and CW strategies for microbubble-enhanced ultrasound therapy. Proc. IEEE Ultrason. Symp.; 2003. pp. 909–912. [Google Scholar]
- 21.Sapozhnikov OA, Khokhlova VA, Bailey MR, Williams JC, Jr, McAteer JA, Cleveland RO, Crum LA. Effect of overpressure and pulse repetition frequency on cavitation in shock wave lithotripsy. J Acoust Soc Amer. 2002;112:1183–1195. doi: 10.1121/1.1500754. [DOI] [PubMed] [Google Scholar]
- 22.Chang PP, Chen WS, Mourad PD, Poliachik SL, Crum LA. Thresholds for inertial cavitation in albunex suspensions under pulsed ultrasound conditions. IEEE Trans Ultrason, Ferroelect, Freq Contr. 2001;48:161–170. doi: 10.1109/58.895927. [DOI] [PubMed] [Google Scholar]
- 23.Smith NB, Hynynen K. The feasibility of using focused ultrasound for transmyocardial revascularization. Ultrasound Med Biol. 1998;24:1045–1054. doi: 10.1016/s0301-5629(98)00086-6. [DOI] [PubMed] [Google Scholar]
- 24.Sokolov DL, Bailey MR, Crum LA. Use of a dual-pulse lithotripter to generate a localized and intensified cavitation field. J Acoust Soc Amer. 2001;110:1685–1695. doi: 10.1121/1.1394221. [DOI] [PubMed] [Google Scholar]
- 25.Xi XF, Zhong P. Improvement of stone fragmentation during shock wave lithotripsy using a combined EH/PEAA shock wave generator in vitro experiments. Ultrasound Med Biol. 2000;24:457–467. doi: 10.1016/s0301-5629(99)00124-6. [DOI] [PubMed] [Google Scholar]
- 26.Zhong P, Zhou Y. Suppression of large intraluminal bubble expansion in shock wave lithotripsy without compromising stone comminution: Methodology and in vitro experiments. J Acoust Soc Amer. 2001;2001:3283–3291. doi: 10.1121/1.1416906. [DOI] [PubMed] [Google Scholar]
- 27.Ikeda T, Yoshizawa S, Tosaki M, Matsumoto Y. Cloud cavitation control for a therapeutic ultrasound application. presented at Int. Symp; Cavitation, Boulder, CO. 2003. [Google Scholar]
- 28.Matsumoto Y, Yoshizawa S, Teiichiro I. Dynamics of bubble cloud in focused ultrasound. presented at Int. Symp. Therapeutic Ultrasound; Seattle, WA. 2002. [Google Scholar]
- 29.Xu Z, Fowlkes JB, Ludomirsky A, Cain CA. The investigation of intensity threshold on ultrasound tissue erosion. Ultrasound Med Biol. 2005;31:1673–1682. doi: 10.1016/j.ultrasmedbio.2005.07.016. [DOI] [PMC free article] [PubMed] [Google Scholar]
- 30.Kaiser AR, Cain CA, Hwang EY, Fowlkes JB, Jeffers RJ. A cost effective degassing system for use in ultrasonic measurements: The multiple pinhole degassing system. J Acoust Soc Amer. 1996;99:3857–3860. [Google Scholar]
- 31.AIUM, Acoustic Output Measurement Standard for Diagnostic Ultrasound Equipment, UD2-98: AIUM/NEMA, 1998.
- 32.Miller DL. The effects of ultrasonic activation of gas bodies in Elodea leaves during continuous pulsed irradiation at 1 MHz. Ultrasound Med Biol. 1977;3:221–240. doi: 10.1016/0301-5629(77)90073-4. [DOI] [PubMed] [Google Scholar]
- 33.Cooper M, Xu Z, Rothman ED, Levin AM, Advincula AP, Fowlkes JB, Cain CA. Controlled ultrasound tissue erosion: The effects of tissue type, exposure parameters and the role of dynamic microbubble activity. presented at IEEE Int. Ultrason., Ferroelect., Freq. Contr. Joint 50th Anniversary Conf; Montreal. 2004. [Google Scholar]
- 34.Chen WS, Brayman AA, Matula TJ, Crum LA. Inertial cavitation dose and hemolysis produced in vitro with or without Optison/sup (R)/ Ultrasound Med Biol. 2003;29:725–737. doi: 10.1016/s0301-5629(03)00013-9. [DOI] [PubMed] [Google Scholar]
- 35.Miller DL, Quddus J. Lysis and sonoporation of epidermoid and phagocytic monolayer cells by diagnostic ultrasound activation of contrast agent gas bodies. Ultrasound Med Biol. 2001;27:1107–1113. doi: 10.1016/s0301-5629(01)00404-5. [DOI] [PubMed] [Google Scholar]
- 36.Miller DL, Song J. Tumor growth reduction and DNA transfer by cavitation-enhanced high-intensity focused ultrasound in vivo. Ultrasound Med Biol. 2003;29:887–893. doi: 10.1016/s0301-5629(03)00031-0. [DOI] [PubMed] [Google Scholar]
- 37.Amararene A, Fowlkes JB, Song J, Miller DL. Relationships between scattered signals from ultrasonically activated contrast agents and cell membrane damage in vitro. presented at IEEE Ultrason. Symp., An int. symp; Atlanta, GA. Oct. 7–10, 2001. [Google Scholar]
- 38.Everbach EC, Makin IRS, Francis CW, Meltzer RS. Effect of acoustic cavitation on platelets in the presence of an echo-contrast agent. Ultrasound Med Biol. 1998;24:129–136. doi: 10.1016/s0301-5629(97)00233-0. [DOI] [PubMed] [Google Scholar]
- 39.Chen WS, Brayman AA, Matula TJ, Crum LA, Miller MW. The pulse length-dependence of inertial cavitation dose and hemolysis. Ultrasound Med Biol. 2003;29:739–748. doi: 10.1016/s0301-5629(03)00029-2. [DOI] [PubMed] [Google Scholar]