

Abstract
The role of subcortical visual structures such as the lateral geniculate nucleus (LGN) and the superior colliculus (SC) in the control of visual spatial attention remains poorly understood. Here, we used high-resolution functional magnetic resonance imaging to measure responses in the human LGN and SC during sustained spatial attention. Subjects covertly and continuously tracked one of two segments that rotated through the visual field, composed of either moving dots or transient colored shapes. Activity in both nuclei was generally enhanced by attention, independent of the stimulus type, with the voxels responding more sensitively to stimulus contrast (those dominated by magnocellular input) exhibiting greater attentional enhancement. The LGN contained clusters of voxels exhibiting attentional enhancement or weak suppression, whereas the SC exhibited predominantly attentional enhancement, which was significantly stronger than in the LGN. The spatial distribution of the attentional effects was unrelated to the retinotopic organization in either structure. The results demonstrate that each of the major subcortical visual pathways participates in attentional selection, and their differential magnitudes of modulation suggest distinct roles.
Keywords: attention, spatial attention, sustained attention, lateral geniculate nucleus, superior colliculus, thalamus
Introduction
A number of different subcortical pathways of visual information originate from different classes of retinal ganglion cells and remain spatially segregated in the subcortex, while being recombined in the visual cortex. The major pathways include the superior colliculus (SC) and the magnocellular (M) and parvocellular (P) parts of the lateral geniculate nucleus (LGN). These subcortical visual nuclei occupy central positions within the recurrent architecture of the visual system and may act as important control structures in directing and sustaining spatial attention. Functional imaging studies in humans have shown that activity in both the LGN and SC is modulated by attention (Corbetta et al., 1991; Büchel et al., 1998; O'Connor et al., 2002), but the relative roles of the different visual pathways in spatial attention remain unclear.
The LGN is the thalamic station in the projection of the visual pathway from retina to primary visual cortex and is organized into six eye-specific layers, with M and P neurons populating the four dorsal and the two ventral layers, respectively. M and P neurons are functionally distinct and can be distinguished by their contrast response functions (Wiesel and Hubel, 1966; Dreher et al., 1976; Creutzfeldt et al., 1979; Shapley et al., 1981; Derrington and Lennie, 1984; Merigan and Maunsell, 1993; Schneider et al., 2004). The inputs to the LGN include both the first synapses from the retinal ganglion cells and also massive feedback from the primary visual cortex and the thalamic reticular nucleus that greatly outnumber the retinal inputs (Sherman and Koch, 1986), making it an opportune control structure to modulate the transmission of visual information.
Human LGN activity is modulated by attention (O'Connor et al., 2002), but little is known about the relative roles of the M and P layers. Using high-resolution functional magnetic resonance imaging (fMRI), we have been able to identify voxels in the LGN whose responses were likely dominated by M or P neurons, based on their relative responses to high- and low-contrast stimuli (Schneider et al., 2004). Therefore, the first goal of the present study was to apply these techniques to probe attentional effects on the M and P parts of the LGN by correlating the effects of stimulus contrast and of sustained attention in individual LGN voxels.
The SC is a laminar structure in the midbrain that belongs to a distributed network of areas mediating saccadic eye movements, fixations, and directed attention (for review, see Wurtz and Albano, 1980; Sparks, 1986; Moschovakis et al., 1996; Sparks, 2002; Krauzlis, 2004a; Shipp, 2004). The SC is subdivided into a superficial part, which mainly processes visual information, and a deeper part, which contributes to the control of orienting movements of the eyes and the head in response to sensory stimuli. Several studies have shown that, in the macaque, responses in the SC are enhanced when stimuli are cued by either peripheral spatial cues (Robinson and Kertzman, 1995; Gattass and Desimone, 1996; Kustov and Robinson, 1996; Bell et al., 2004; Fecteau et al., 2004; Ignashchenkova et al., 2004) or symbolic cues associated with specific spatial locations (Kustov and Robinson, 1996; Lee and Keller, 2006). Modulation of human SC activity has been reported relating to eye and head movements (Petit and Beauchamp, 2003; Schmitz et al., 2004), visual search (Gitelman et al., 2002), and selective attention to motion (Büchel et al., 1998) or shape (Corbetta et al., 1991). However, the role of the SC in sustained attention remains unclear, and the second goal of the present study was to directly compare attentional modulation in the SC to those in the M and P pathways.
We pursued these goals by using a novel paradigm in which subjects covertly tracked and detected changes within one of two segments of a rotating bow tie-shaped stimulus (see Fig. 1), allowing us to compare the responses evoked by the attended and unattended segments as they passed through the same regions of the visual field.
Figure 1.
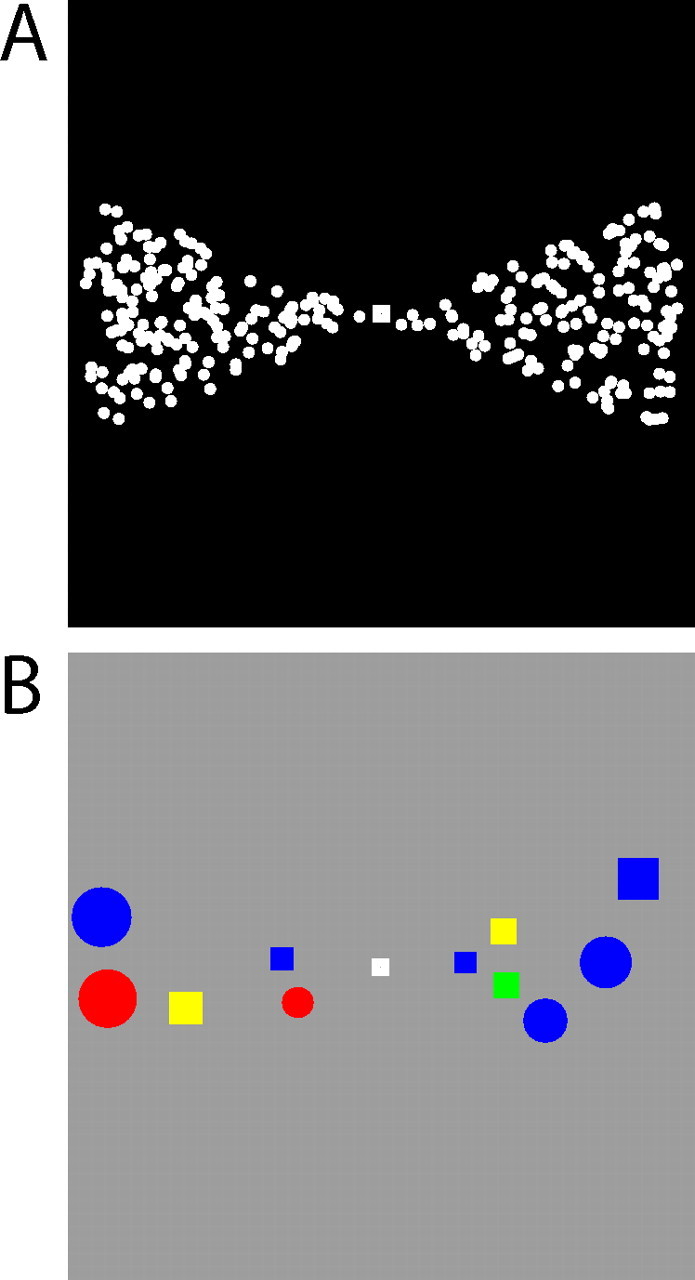
Visual stimuli. Single frames of the stimuli are shown. A, The moving dot stimulus. The two segments rotated counterclockwise around the fixation point with a period of 40 s. In one of the segments, a fraction of the dots was moving in a coherent direction, and the remaining dots in that segment as well as in the opposite segment moved randomly. Subjects were required to covertly track the segment with the coherent dots and to report changes in the direction of coherent motion. B, The color and shape stimulus. The segments rotated counterclockwise with a period of 40 s. The color and shape combinations were briefly presented within the segment boundaries. Subjects were instructed to direct attention to one of the two segments and to detect a unique color and shape combination that would appear only in that segment, for example, a green square.
Materials and Methods
Subjects.
Five subjects participated in the study, which was approved by the Institutional Review Panel of Princeton University. All subjects (20–35 years of age; one male) were in good health with no past history of psychiatric or neurological disorders and gave their informed written consent. Subjects had normal or corrected-to-normal visual acuity. Four subjects (S1–S4) participated in three separate scanning sessions, one for measuring contrast response functions of the LGN and SC, and a second and third for experiments 1 and 2, respectively. Two additional control studies were conducted. In the first control study, two of the four subjects (S1 and S2) participated in an additional session during which eye movements were recorded while performing experiments 1 and 2, and in a second control study, two subjects (S1 and S5) participated in a separate session to measure responses evoked by coherent versus incoherent dot motion in the LGN and SC.
Visual display.
The stimuli were generated on a Macintosh G4 computer (Apple Computer) using Matlab software (Mathworks) and Psychophysics Toolbox functions (Brainard, 1997; Pelli, 1997) and were projected from a PowerLite 7250 LCD projector (Epson) outside the scanner room onto a translucent screen located at the end of the scanner bore. Subjects viewed the screen at a total pathlength of 60 cm through a mirror attached to the head coil. The screen subtended 30° of visual angle in the horizontal dimension and 26° in the vertical dimension. A trigger pulse from the scanner synchronized the start of the stimulus presentation to the beginning of the image acquisition.
Visual stimuli and procedure.
Visual stimuli consisted of two opposing angular segments of the visual field, comprising a bow tie-shaped pattern that rotated about the fixation point (Fig. 1). Together, the segments spanned approximately the central 30° of the visual field. To ensure that the measured effects applied more generally and were not tied to specific stimulus features or to particular levels of difficulty in selecting the behaviorally relevant information, we varied in separate experiments the feature content of the stimuli within the bow tie segments, using either moving dot fields in experiment 1 (Fig. 1A), or colored shape conjunctions in experiment 2 (Fig. 1B). A central fixation point was present, and subjects were instructed to maintain fixation for the duration of each scanning run, to attentionally track one of the two segments throughout the scanning run, and, within that segment, to detect changes in the direction of fractional coherent motion or to detect specific color and shape conjunctions.
In experiment 1, the two segments were composed of 1000 0.1° white dots moving with a speed of 7°/s on a black background (Fig. 1A). On each video frame, 10% of the dots in each segment disappeared and were redrawn in random locations within the same segment such that any dot had an average lifetime of 10 frames or 167 ms. A dot disappeared and was redrawn in a random position on reaching the boundaries of the segment. The segment boundaries constantly changed as the segment rotated counterclockwise around the fixation point with a period of 40 s. In the segment to which each subject had been instructed to attend, a fraction of the dots were moving in a coherent direction, and the remaining dots in that segment as well as in the opposite segment moved randomly. Every 1–3 s, the coherent dots would change directions by a random angle. The task of the subject, while fixating, was to press a key on detection of each these changes in the coherent direction. The difficulty of the task could be adjusted by varying the fraction of coherently moving dots; all subjects were scanned with a coherence of 35 or 40%.
From an experiment design perspective, it would have been ideal to present identical motion stimuli in the two segments. However, we observed in pilot studies the propensity of coherence changes in the unattended segment to automatically capture attention, thus distracting and confusing the subjects. Because the literature suggests that the degree of coherence does not by itself modulate activation in low-level visual structures (Braddick et al., 2001), our design that omitted the coherence from one segment appeared justified. To assure that any differences in responses between the segments was attributable to differences in attention and not coherence, we sought independent verification that the LGN and SC were not sensitive to motion coherence in a control experiment involving one of the main subjects and an additional subject. The stimulus consisted of blocks of dots (as in experiment 1) moving either 50% coherently or in random directions. Each block lasted for 16 s, and the cycle of coherent and incoherent dots was repeated eight times during each of the seven to eight scanning runs in each subject. Interleaved among the dot motion scans were six scanning runs in which a high-contrast rotating checkerboard hemifield stimulus was displayed. The hemifield pattern reversed contrast at 8 Hz and rotated counterclockwise through eight cycles per run with a period of 32 s. This stimulus served as a localizer to identify regions of interest in the LGN and SC in which to measure the response to coherent motion.
In experiment 2, the segments were composed of square or circular shapes on a gray background (147.1 cd/m2), scaled linearly in size with eccentricity such that shapes near the fixation point were 0.5° per side, and those located at 15° eccentricity subtended 1.5° (Fig. 1B). The shapes were randomly positioned within the segments, but did not overlap with any other shape. Each shape appeared for 200–500 ms (700–1000 ms for target shapes), after which it would disappear, creating a space in which a new shape might appear. The duration of the target shape was altered for each subject from run to run to maintain approximately the same performance across subjects and runs. As in experiment 1, the boundaries of the segments, and thus the available areas in which new shapes might appear, constantly changed as the segments rotated around the fixation point with a period of 40 s. In each segment, the available colors of the shapes were different. In one segment, the shapes could be red, blue, or yellow, whereas in the opposite segment, the shapes could be green, blue, or yellow. The task of the subjects was to press a key on detection of a unique color and shape combination, either a red or green square. Throughout each scanning run, red squares appeared in only one of the segments, whereas green squares appeared only in the other segment. The target red and green colors were assigned alternatively to the attended or unattended segments in interleaved scanning runs. Subjects were informed at the beginning of each run which target shape and color to detect, and in which of the two segments these conjunctions would be located.
A third stimulus, an alternating hemifield was used to measure two points (10 and 100%) of the contrast response function to identify LGN voxels whose responses were likely dominated by M or P neurons (Schneider et al., 2004). The stimulus consisted of a checkerboard pattern, contrast reversing at 8 Hz, covering one hemifield but sparing the vertical meridian and central 1.1° of the visual field. The pattern alternated between the left and right hemifields every 16 s. In separate scanning runs, the stimulus was presented at either 100 or 10% contrast. Data using this stimulus have been previously reported for some of the subjects (Schneider et al., 2004; Schneider and Kastner, 2005).
Each subject participated in three separate scanning sessions, one each for experiments 1 and 2, and a third session to measure the contrast response. In addition, a subset of the subjects participated in a second control experiment in which eye movements were monitored in the scanner to ensure that subjects were able to maintain fixation while performing the sustained peripheral attention task. For this experiment, the projection screen had a small hole at the edge, allowing a subject's eye position to be monitored through the subject's viewing mirror via a remote camera (ASL 504 remote optics; Applied Science Laboratories). Each of the stimuli used in experiments 1 and 2 was tested in three runs. Pupil size and the horizontal and vertical position of the gaze were measured at a rate of 60 Hz throughout each scanning run, and the timing of eye blinks were inferred from the characteristic periods of data loss. To determine whether the gaze position and pupil size time series contained any power at the rotational frequency of the stimulus, which would indicate that subjects were tracking the stimulus and not maintaining fixation, the horizontal and vertical eye positions were each averaged over the six scanning runs for each subject, and a Fourier transform was performed on the resulting time series.
Data acquisition.
Data were acquired with a 3 T Allegra head-dedicated MRI scanner (Siemens) using a standard birdcage head coil. Six to 14 series of 128 volumes each were acquired with 18 interleaved coronal slices (2 mm thick with no gap between slices) and a gradient echo, echo planar sequence with a 128 square matrix leading to an in-plane resolution of 1.5 × 1.5 mm2 [repetition time (TR), 2 s; echo time (TE), 41 ms; flip angle, 90°]. A partial Fourier factor of 7/8 was used to acquire an asymmetric fraction of k-space to reduce the acquisition time. The posterior edge of the acquisition volume was aligned in the midsagittal plane with the posterior edge of the corpus callosum to cover the posterior thalamus. Echo-planar images were compared with a coaligned high-resolution anatomical scan of the same subject's brain taken at the beginning of the session (fast low-angle shot; TR, 150 ms; TE, 4.6 ms; flip angle, 90°; 256 × 256 matrix; six averages).
The subjects' heads were surrounded by foam to reduce head movements; one subject (S3) also used a bite bar.
Data analysis.
To compensate for subject head movement and scanner drift occurring during individual scanning runs and across a scanning session, all volumes acquired in each experiment and scanning run were registered (Jenkinson et al., 2002) to the same volume acquired in one of the sessions. We positioned the acquisition field of view in very similar locations for each subject relative to landmarks visible in the localizer scans across different scanning sessions to facilitate intersession registration; when necessary, the registration algorithm was initialized with the transformation matrix obtained by registering the intersession anatomical images. During the registration procedure, each volume was upsampled to twice the resolution in each spatial dimension. For each voxel in the volume, the linear trend in the fMRI time series was subtracted and the time series was divided by its mean intensity, converting the data to units of percentage signal modulation. The time series of each voxel were averaged across 10 repeated scanning runs of the identical stimulus condition as follows. The images obtained during the first cycle of visual stimulation (40 s) were discarded to avoid transient effects of signal saturation and to allow the hemodynamics to reach steady state. Therefore, the time series of each voxel contained 120 time points representing six cycles of visual stimulation.
A Fourier analysis was performed to identify regions of interest (ROIs) containing voxels activated by the stimulus (Bandettini et al., 1993; Engel et al., 1997). For each voxel, the amplitude and phase (the temporal delay relative to the stimulus onset) of the harmonic at the stimulus frequency were determined by a Fourier transform of the mean time series of the voxel. The correlation coefficient r between the harmonic and the time series was computed as the amplitude of the harmonic component divided by the square root of the time series power. Because the bow tie stimuli contained two frequency components, the main rotation frequency and double that frequency, r was computed using the maximum of the two harmonics. To ensure that the same groups of voxels were compared across experiments, the ROIs were composed of voxels that were significantly activated by each of the stimuli. To do so, an initial ROI was composed from the set of voxels significantly activated by the average of the mean time series from the two attentional stimuli. Statistical maps were thresholded at r ≥ 0.25, corresponding to an uncorrected p < 0.0038. ROIs for each LGN and SC were identified as contiguously activated voxel clusters in their anatomical locations, as determined from registered high-resolution structural images of each subject. After these initial ROIs were defined from the attentional stimuli, they were further restricted to voxels also activated at r ≥ 0.25 by the average of the 100 and 10% contrast stimuli.
The responses evoked by the attended and unattended sectors of the stimuli in experiments 1 and 2 were determined separately for each voxel. Mean time series of one stimulus period were calculated by averaging all stimulus cycles across scanning runs. To compute the smoothed response while avoiding edge effects of the smoothing, three identical raw series were concatenated and smoothed with a five-point moving average, and the middle of the three series was extracted. The smoothed single-period average time series were then deconvolved from the hemodynamic response by fitting to a generative response model. The model consisted of two square wave sources, each with the same variable width w but different variable amplitudes a1 and a2. The two sources were always out of phase by one-half stimulus period, but their absolute phase position ϕ was free to vary. This model is depicted in supplemental Figure 1A (available at www.jneurosci.org as supplemental material). The model was then convolved with a standard hemodynamic response function (mixture of gammas) in supplemental Figure 1B (available at www.jneurosci.org as supplemental material) to yield the convolved response model in supplemental Figure 1C (available at www.jneurosci.org as supplemental material). In the convolved response model, the larger impulse is shifted by the hemodynamic delay such that its response peaks the middle of the response period, and the smaller impulse is shifted so that its peak occurs at the end and wraps around to the beginning of the response period. The convolved model response was converted to percentage change, and the best-fitting parameters (a1, a2, w, and ϕ) were obtained through an optimization procedure. The parameters a1 and a2 represent the response amplitude to the attended and unattended wedges, respectively. w represents the duration of the response to each wedge and therefore the size of the receptive field of the voxel. ϕ indicates the response delay, which can be converted to the angular polar coordinate of the receptive field location within the visual field of the voxel, and was corrected based on the hemispheric location of each voxel to ensure that a1 always corresponded to the attended wedge stimulus. Attentional modulation indices (AMIs) were calculated from the response amplitudes: AMI = (a1 − a2)/(a1 + a2). For each subject and stimulus, the mean AMI was calculated for the LGN and SC, pooled across hemispheres.
To determine the contrast sensitivity of voxels and therefore potentially classify voxels as containing predominantly M or P neurons, we calculated a contrast modulation index (CMI) based on the response amplitudes to the 100% (A100%) and 10% (A10%) contrast stimuli: CMI = (A100% − A10%)/(A100% + A10%). M neurons are expected to exhibit a smaller response difference between 100 and 10% contrast stimuli than P neurons (Sclar et al., 1990; Tootell et al., 1995; Schneider et al., 2004) and were therefore expected to exhibit smaller CMIs. To test whether the attentional modulation depended on the CMI, the voxels in each ROI were divided into two groups, one with CMI < 0.25 and the other with CMI ≥ 0.25, and analyzed separately. General linear models were computed with SPSS software (version 16.0.1; SPSS).
Results
Behavioral results
In the dot motion task, the attended portion of the stimulus contained 35–40% coherent motion, and the subjects detected a mean (±SEM) of 38.1 ± 7.0% of the changes in the direction of this motion. For the color and shape feature conjunction task, the subjects detected 67.5 ± 5.2% of the unique features, a significantly greater detection rate than in the motion task (two-tailed t test of the weighted mean, t(5.6) = 3.37; p = 0.028).
To test whether performance varied throughout the visual field, the location of the attended stimulus was recorded each time a subject detected a change in the stimulus. The visual field was subdivided into 12 sectors, and for each subject, we computed the fraction of correct detections of changes over all experimental runs that occurred within each sector. These data were not available for one subject for the motion stimulus, and this subject was therefore omitted from this analysis. The mean across subjects is plotted in Figure 2A. Because the motion task was significantly more difficult than the feature conjunction task, we compared the results between the two stimulus types by computing the fraction of each subject's total responses for each stimulus that occurred within each sector, as shown in Figure 2B. There were no significant differences between the different directions in visual space, between the two stimuli, nor was there a significant interaction between stimulus and direction, suggesting that subjects' performance in the two experiments was uniform throughout the visual field.
Figure 2.

Behavioral results. The polar plots show the distribution of the subjects' detection responses throughout the visual field. A, The mean fraction of correct detections is plotted for each location. The solid line represents the dot motion stimulus, and the dashed line indicates the color and shape feature conjunction stimulus. The shaded area depicts the extent of the SEM across subjects. The polar angle coordinate represents a sector of the visual field; the right horizontal meridian (RHM), upper vertical meridian (UVM), left horizontal meridian (LHM), and lower vertical meridian (LVM) are labeled. B, For each stimulus, the mean number of detection responses at each location is plotted as a fraction of the subjects' total detection responses.
Definition of LGN and SC regions of interest
The LGN and SC were activated by both the colored shape and motion bow tie stimuli and the two contrast stimuli. ROIs were defined by identifying clusters of voxels in the correct anatomical locations that were significantly activated by the average of the dot motion and color/shape stimuli. Among the four subjects, the bow tie stimuli activated a volume of 129 ± 24 mm3 in the left LGN, 121 ± 24 mm3 in the right LGN, 110 ± 15 mm3 in the left SC, and 90 ± 15 mm3 in the right SC. Because one goal of our study was to examine the effects of attention on the M and P parts of the LGN, the ROIs that were defined on the basis of the responses evoked by the bow tie stimuli were further restricted by the criterion that the same voxels had to be significantly activated by the 100 and 10% contrast alternating hemifield stimuli. Overall, 22.8% of the voxels were excluded from additional analyses, because they were exclusively activated by the bow tie stimuli, but not significantly by the contrast stimuli. The resulting ROI volumes were 114 ± 20 mm3 in the left LGN, 107 ± 22 mm3 in the right LGN, 76 ± 14 mm3 in the left SC, and 51 ± 8 mm3 in the right SC.
For each of the voxels in each ROI, and separately for each of the dot motion and color/shape stimuli, the mean raw time series across the scanning runs was fit to a generative response model (see Materials and Methods) (supplemental Fig. 1, available at www.jneurosci.org as supplemental material) to determine the response amplitudes evoked by the attended and unattended portions of the stimuli. To ensure that only voxels with well characterized responses were further analyzed, we excluded voxels that had a response amplitude to either portion of the stimulus <0 or >5% signal change. The voxels excluded based on these criteria comprised 19.4% of the total. The voxels that survived all of the inclusion criteria composed volumes of 97 ± 17 mm3 in the left LGN, 91 ± 21 mm3 in the right LGN, 56 ± 12 mm3 in the left SC, and 36 ± 5 mm3 in the right SC.
General attention effects
The dot motion and color/shape stimuli evoked similar periodic responses in the LGN and SC, with the hemodynamic response increasing as each segment of the stimulus passed through the portion of the visual field represented by each voxel, and decreasing in response to a blank visual field (Fig. 3). To evaluate the effects of attention on neural signals in the LGN and SC, we calculated the response amplitudes evoked by the attended and unattended segments of the two types of stimuli by fitting a response model to the mean time series (see Materials and Methods). Data from two typical LGN voxels are shown in Figure 3. In Figure 3A, the first response was evoked by the attended segment of the motion stimulus, whereas the second response was evoked when the unattended segment passed through the same part of the visual field represented by this voxel. The resulting response amplitudes for the attended and unattended segments of the stimulus were approximately equal, and there was little attentional modulation. In contrast, the voxel in Figure 3B exhibited strong attentional modulation, and the response evoked by the attended segment of the stimulus was more than twice the amplitude of the response evoked by the unattended segment.
Figure 3.
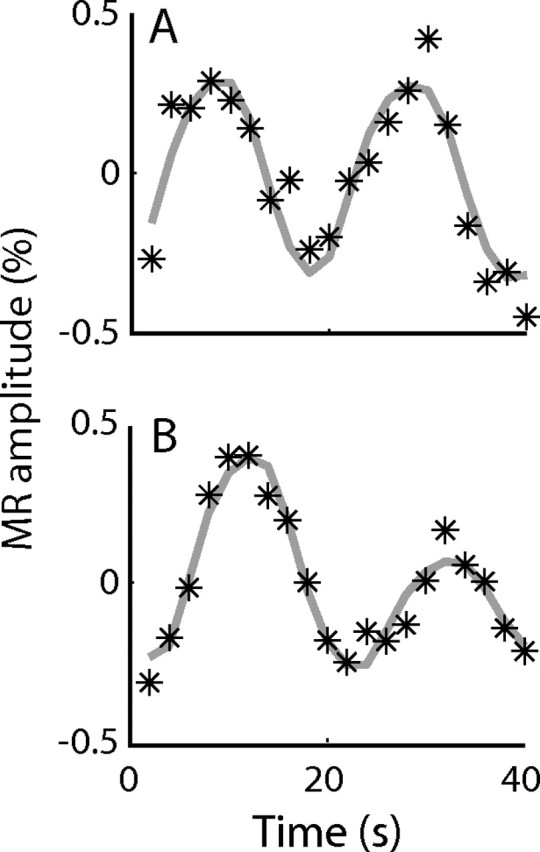
fMRI time series of individual voxels. Typical data for two LGN voxels are shown, fit to the response model. The peaks in the response occur when the segments of the stimulus rotate through the receptive fields of the voxels. For each voxel, the response to the attended stimulus occurs first, followed by the second response to the unattended stimulus. The voxel in A shows little attentional modulation between the attended and unattended segments of the stimulus. The voxel in B exhibits a large attentional modulation, as seen in the different heights of the two responses.
The mean response amplitudes were computed across all voxels in each ROI, for each stimulus and for each attentional condition. These mean amplitudes were then analyzed with a repeated-measures general linear model with attentional condition and stimulus type as repeated measures within each ROI. Because the stimulus type was not generally found to be a significant factor, the results are presented collapsed across stimulus type in Figure 4 and separated by stimulus type in supplemental Figure 2 (available at www.jneurosci.org as supplemental material). The mean response amplitudes averaged across subjects are plotted for each ROI and attention condition in Figure 4A. The results revealed a main effect of attention (F(1,6) = 532.4; p = 4.3 × 10⁻⁷), with the response evoked by the attended segment of the stimulus being larger than the response evoked by the unattended segment of the stimulus. There was no main effect of either the ROI (F(1,6) = 2.5; p = 0.16) or stimulus type (F(1,6) = 3.1; p = 0.13) on the response amplitudes, but there was a significant interaction between attention condition and ROI (F(1,6) = 203.1; p = 7.5 × 10⁻⁶), with the effect of attention being larger in the SC than the LGN. As is evident in Figure 4A, the response amplitudes in the SC evoked by the unattended segment of the stimuli were 40% less than those evoked by the attended segment of the stimuli (0.650 ± 0.048 vs 1.083 ± 0.051%). In contrast, in the LGN, the responses evoked by the unattended stimuli were only 10% less than the responses evoked by the attended stimuli (0.925 ± 0.048 vs 1.027 ± 0.051%). These general effects of attention on the response amplitudes were significant in the LGN and SC (F(1,6) = 38.9, p = 0.00078; F(1,6) = 696.6, p = 2.0 × 10⁻⁷, respectively).
Figure 4.
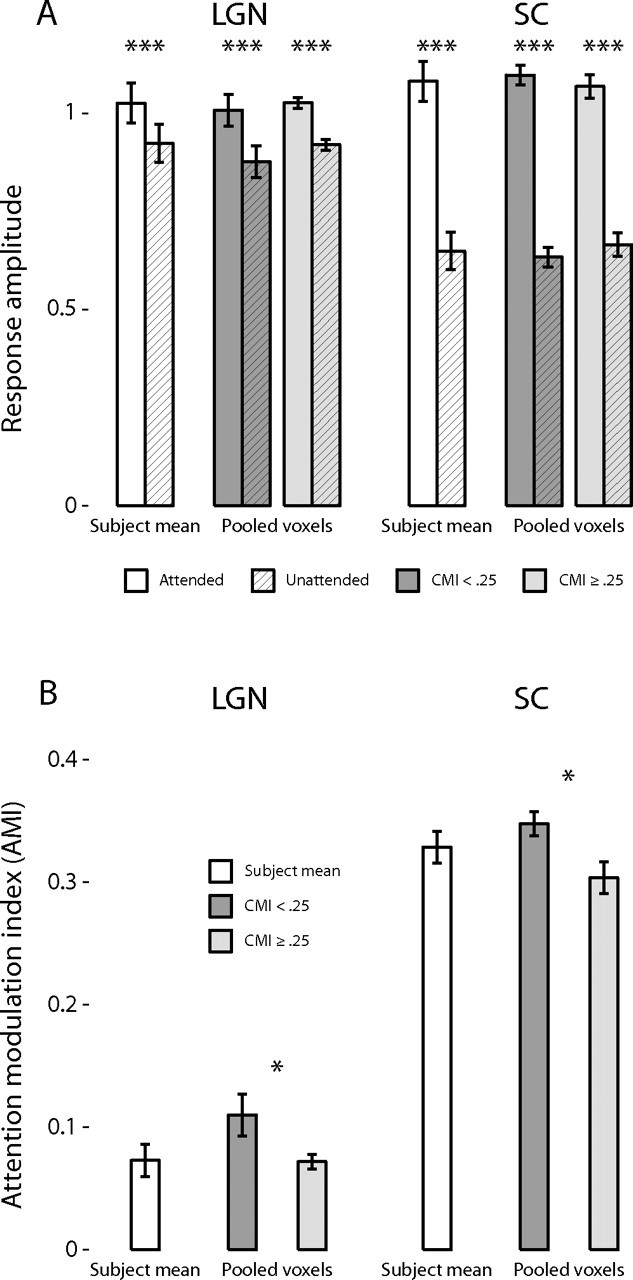
Effects of attention in the LGN and SC. A, The response amplitudes evoked by the dot motion and color/shape stimuli are shown for the LGN and SC. The amplitudes for the attended (white bars) and unattended (hatched bars) conditions are shown averaged across subjects; error bars indicate the SEM. The shaded bars show the same data pooled over all voxels and sorted into two different groups: voxels with CMI < 0.25 (darker bars) and voxels with CMI ≥ 0.25 (lighter bars). The hatched bars correspond to the unattended conditions; the unhatched bars correspond to the attended conditions. Significant differences in paired comparisons are marked with asterisks: *p < 0.05 and ***p < 0.001. B, AMIs are shown for the LGN and SC either averaged by subject (white bars) or voxels grouped by CMI (shaded bars).
To further quantify the effects of attention, an AMI was computed for each voxel: (a1 − a2)/(a1 + a2), where a1 is the amplitude of the response evoked by the attended segment of the stimulus, and a2 the amplitude of the response evoked by the unattended segment of the stimulus (see Materials and Methods). Thus, voxels with AMI > 0 exhibited attentional enhancement, and voxels with AMI < 0 exhibited attentional suppression. The AMI permits a direct comparison of the attention effects in subdivisions within a structure such as the M- or P-LGN and also across the nuclei and stimulus types. The distributions of AMIs from the voxels activated by the dot motion stimulus and by the shape/color stimulus are shown for the LGN in Figure 5, B and C, and for the SC in Figure 5, E and F. In the LGN, there were significant fractions of voxels that consistently exhibited either attentional enhancement or suppression: 39.9% of the voxels exhibited attentional enhancement for both stimuli, whereas 14.4% consistently exhibited attentional suppression. In the SC, the result was starkly different: 81.2% of the voxels consistently exhibited attentional enhancement, whereas only 1.5% of the voxels exhibited attentional suppression for both stimuli.
Figure 5.

Contrast modulation and attentional modulation in the LGN and SC. Distributions of the CMI (A, B) and AMI (D–G) are shown for all voxels in all subjects in the LGN (A–C) and SC (D–F). In A and B, voxels with CMI < 0.25 are shaded in gray. These same voxels appear shaded in the AMI distributions. In B and E, the AMI is shown for the dot motion stimulus in the LGN and SC, respectively. In C and F, the AMI is shown for the color and shape stimulus in the LGN and SC.
The mean AMIs were computed for each ROI and each subject and subjected to a repeated-measures general linear model, with the stimulus type as the repeated measure. The mean AMIs across subjects for each ROI are shown in Figure 4B. The main effect of ROI was significant (F(1,6) = 186.6; p = 9.6 × 10⁻⁶), with the AMI significantly larger in the SC than in the LGN (0.329 ± 0.013 vs 0.073 ± 0.013, respectively). There was no main effect of stimulus type (F(1,6) = 0.005; p = 0.95) or interaction between stimulus type and ROI (F(1,6) = 0.38; p = 0.56).
Although the subcortical areas investigated in the present study are not thought to be sensitive to motion coherence (Braddick et al., 2001), and although the attentional effects measured with the motion stimulus were consistent with those measured with the color/shape stimulus, we performed a control study to confirm that the modulations in the LGN and SC between the two sectors of the motion stimulus were caused by the attentional manipulation and not the difference in motion coherence. Two subjects were tested while viewing a coherent or a random-dot motion stimulus (see Materials and Methods), and ROIs for the LGN and SC were defined by responses evoked by a rotating flickering checkerboard stimulus. No significant signal was observed in either subject in the ROIs in response to changes from 50 to 0% coherence in a field of dots covering the visual field, either in the responses of individual voxels or in the mean time series averaged across all voxels in each of the LGN and SC ROIs.
To summarize the results computed across subjects, activity in both the LGN and SC was significantly enhanced by attention, with the enhancement in the SC being significantly larger than that in the LGN. Despite differences in stimulus features and task difficulty, there were no significant differences in the overall response amplitudes or attentional modulations between the dot motion and the color/shape conjunction stimuli in either ROI.
Contrast modulation and attentional modulation
One goal of the present study was to investigate potential differences in attentional modulation in the M and P parts of the LGN. As in our previous study, the contrast response function served to identify candidate voxels that received predominant M or P input (Schneider et al., 2004). M neurons are expected to exhibit a smaller response difference evoked by low (e.g., 10%) compared with high (e.g., 100%) contrast stimuli than P neurons (Sclar et al., 1990; Tootell et al., 1995; Schneider et al., 2004). As a quantitative measure of the contrast response difference, a CMI was calculated for each subject and each voxel within a given ROI. The CMI was computed based on the response amplitudes evoked by the 100% (A100%) and 10% (A10%) contrast alternating hemifield stimuli: CMI = (A100% − A10%)/(A100% + A10%). The distributions of CMIs for the LGN and SC are shown in Figure 5, A and D, respectively. Overall, the LGN was more strongly modulated in contrast than was the SC (Schneider and Kastner, 2005), with a mean CMI pooled across all subjects of 0.4820 ± 0.0050, compared with 0.1968 ± 0.0097 for the SC.
The AMI for each voxel, averaged across stimulus type, was plotted against the CMI for that voxel in Figure 6, A and B, for the LGN and SC, respectively. The mean AMI for each CMI was computed by smoothing these scatter plots with a Gaussian window (σ = 0.1), and is shown for both nuclei in Figure 6C. It is evident that the mean AMI is greater than zero, indicating attentional enhancement, over the range of CMI. Over the population of voxels, AMI tended to be larger for lower CMI. For the LGN, this was caused by a relative lack of attentionally suppressive voxels with low CMIs.
Figure 6.

Contrast and attentional modulation in the LGN and SC. A, B, The average AMI across the two stimulus types is plotted against the CMI for all voxels, pooled across subjects. Each dot represents a single voxel in the LGN (A) or SC (B). C, The mean AMI for each CMI is computed for the LGN (bottom curve) and SC (top curve) by smoothing the scatter plots in A and B with a Gaussian window (σ = 0.1). The shaded area represents the SEM.
To perform statistical tests, the pooled voxels were divided into two groups, one with CMI < 0.25 (Fig. 5, histogram bars shaded in gray), and the other with CMI ≥ 0.25, based on the assumption, also made in our previous study (Schneider et al., 2004), that voxels in the LGN within the lower tail of the CMI distribution were likely to contain large fractions of M neurons. As noted previously (Schneider et al., 2004), because of the variability in the anatomical locations of the voxels with CMI < 0.25, these voxels cannot be said to isolate the M layers, but as a group, their responses are likely to be dominated by M input. Of the 1336 voxels in the LGN ROIs among the subjects, 143 (10.7%) had CMI < 0.25. Although there could potentially be an overlap of M and P inputs for voxels with CMI ≈ 0.25, the large number of voxels with CMI > 0.25 ensures that in their pooled responses, the borderline voxels would be swamped in relation to the rest of the group dominated by P input. We chose not to further subdivide these responses to be consistent with criteria in our previous study and to present a conservative test such that only dramatic differences in responses would be observed. For comparison purposes, voxels in the SC were also divided into two groups using the same criterion, with 389 of 658 voxels (59.1%) having CMI < 0.25.
Independent analyses were performed with a repeated measures general linear model on the voxel groups in the LGN and SC. Each voxel was a separate case, with attentional condition and stimulus type as within-case factors, and CMI group as a between-case factor. Subsequently, the AMIs of the voxels were similarly analyzed. In the LGN, there was a significant main effect of attention on the amplitudes (F(1,1334) = 118.7; p < 10−16), with the responses evoked by the attended portion of the stimuli being significantly larger than those evoked by the unattended portion (1.019 ± 0.023 vs 0.899 ± 0.022%, respectively). There was no interaction between attentional condition and CMI group (F(1,1334) = 1.2; p = 0.28); in both CMI groups, the response amplitudes were significantly greater for the attended than unattended stimuli (F(1,1334) = 40.2, p < 10−9; F(1,1334) = 224.5, p < 10−16, respectively). There was no significant main effect of stimulus type on the response amplitudes (F(1,1334) = 0.002; p = 0.97) or CMI (F(1,1334) = 0. 48; p = 0.49), but there was a marginally significant interaction among attention condition, stimulus type and CMI (F(1,1334) = 3.732; p = 0.054). The mean amplitudes by voxel for each attention condition and CMI group are shown in Figure 4A, shaded bars. For the AMI in the LGN, there was a significant main effect of CMI (F(1,1334) = 4.8; p = 0.029), with the voxels in the CMI < 0.25 group having a larger attentional enhancement than the voxels in the CMI ≥ 0.25 group (0.110 ± 0.016 vs 0.072 ± 0.006, respectively). As noted above and in Figure 6, this effect was mainly attributable to a smaller fraction of voxels exhibiting attentional suppression in the CMI < 0.25 group than in the CMI > 0.25 group. There was no main effect of stimulus type on AMI (F(1,1334) = 2.4; p = 0.12). The mean AMIs for the LGN in each CMI group are shown in Figure 4B.
In the SC, there was a main effect of attention on the response amplitudes (F(1,656) = 1337.4; p < 10−16), with the attended segment of the stimuli evoking a significantly larger response (1.085 ± 0.017%) than that evoked by the unattended segment (0.650 ± 0.017%) in the pooled analysis. There was also a main effect of the stimulus type on the amplitudes (F(1,656) = 19.9; p = 9.6 × 10⁻⁶), with the response amplitudes being larger for the color/shape stimulus than for the dot motion stimulus (0.940 ± 0.025 vs 0.795 ± 0.021%, respectively), and a significant interaction between the effects of attention and stimulus type (F(1,656) = 4.0; p = 0.046), with the effects of attention somewhat smaller for the dot stimuli than for the color/shape stimuli. This interaction was not evident in the analysis of the AMI (below). The mean response amplitudes across voxels for each stimulus, attention condition, and CMI group are shown in supplemental Figure 2B, shaded bars (available at www.jneurosci.org as supplemental material). Although there was no main effect of CMI on the response amplitudes (F(1,656) = 0.001; p = 0.97), there was a significant interaction between attention and CMI (F(1,656) = 6.6; p = 0.010), with the difference between the responses to the attended and unattended segments of the stimuli being larger among the CMI < 0.25 group of voxels (1.099 ± 0.022 vs 0.634 ± 0.022%) than among the CMI ≥ 0.25 group (1.070 ± 0.026 vs 0.666 ± 0.027%). These effects of attention were significant in both CMI groups (F(1,656) = 936.7, p < 10−16; F(1,656) = 498.0, p < 10−16, respectively). The mean response amplitudes across voxels for each stimulus, attention condition, and CMI group are shown in Figure 4A, shaded bars. For the AMI in the SC, there was no significant effect of stimulus type (F(1,656) = 1.6; p = 0.21), but there was a main effect of CMI (F(1,656) = 5.9; p = 0.016), with the AMI larger for the CMI < 0.25 voxels than the CMI ≥ 0.25 voxels (0.348 ± 0.012 vs 0.304 ± 0.014, respectively). The mean AMIs by voxel in the SC are shown for each CMI group in Figure 4B.
To summarize the effects of attention in the LGN and SC among groups of voxels defined by their contrast modulation, in both structures, the voxels that were less modulated in contrast exhibited stronger attentional enhancement, independent of whether the attended stimulus was composed of moving fields of dots or shapes of different color.
Spatial distribution and specificity of attention effects
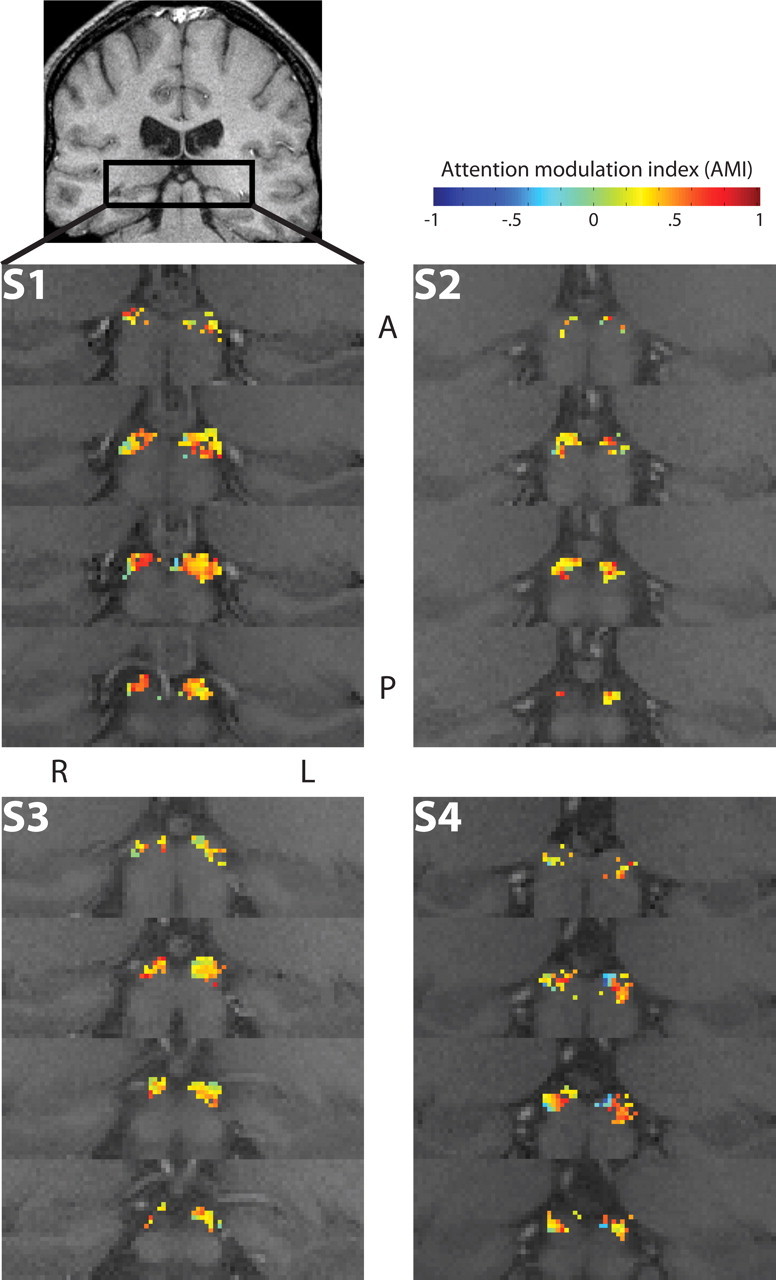
Both the LGN and SC contain retinotopic maps of the visual field that can be resolved in humans using high-resolution fMRI (Schneider et al., 2004; Schneider and Kastner, 2005), and it was therefore possible, by examining the attentional effects in individual voxels in relation to the locations of the voxels within the anatomical structure of the LGN and SC, to determine whether the effects of sustained attention varied in magnitude throughout the visual field. This analysis also provides a measure of the spatial specificity of the attentional effects. The mean AMIs averaged across both attentional stimuli are plotted for each voxel in the ROIs in Figure 7 for the LGN and Figure 8 for the SC. Whereas the voxels in the SC generally displayed attentional enhancement with AMI > 0, as indicated by the reddish colors, in the LGN, there were also substantial regions of attentional suppression with AMI < 0, as indicated by the bluish colors. This was a consistent result across the four subjects. There appears to be some internal structure within the LGN, with localized regions of relatively strong attentional enhancement, mixed among relatively weak but more expansive regions of attentional suppression.
Figure 7.
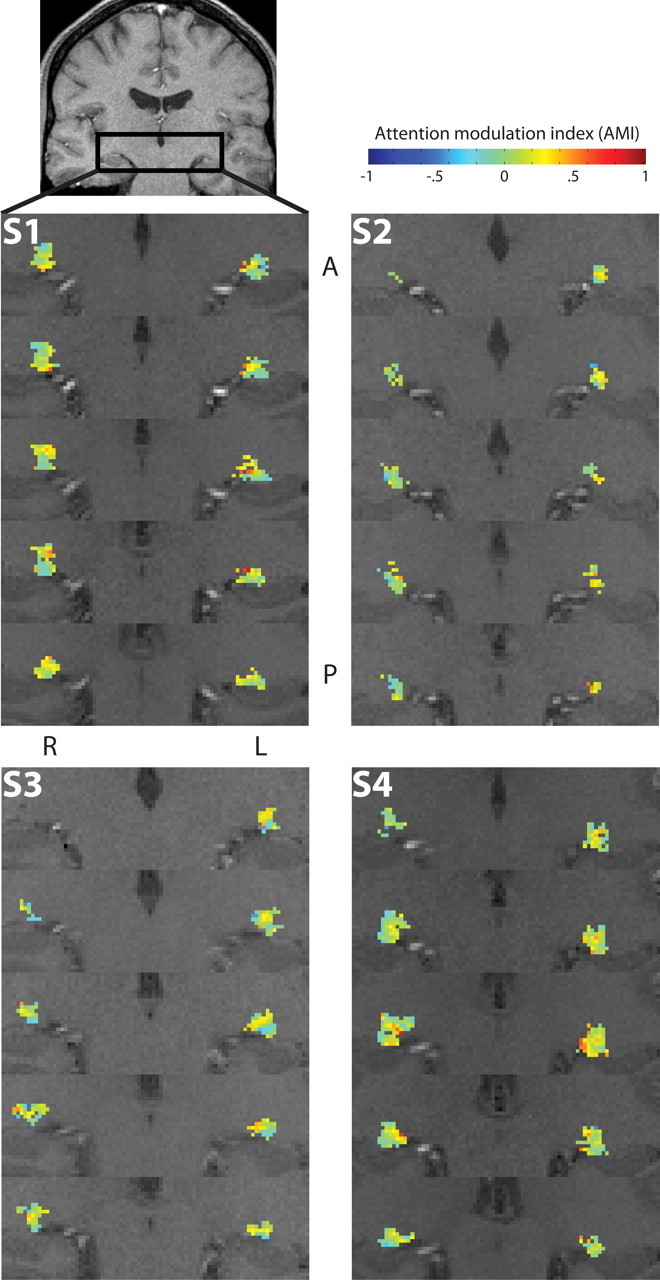
Spatial maps of attentional modulation effects in the LGN. Activations in the LGN are shown for all subjects. Voxels that were significantly activated by both the attention and the contrast stimuli constitute the ROI in the anatomical location of the LGN. Enhanced views of the region indicated in the coronal slice are shown in several sequential slices, arranged anterior (A) to posterior (P). The color of each voxel indicates the mean AMI across both the dot motion and color/shape stimuli for that voxel. The reddish colors indicate attentional enhancement (AMI > 0), such that the response to the attended segment of the stimulus was larger than the response to the unattended segment. The bluish colors indicate attentional suppression (AMI < 0). Left (L) and right (R) hemispheres are labeled.
Figure 8.
Spatial maps of attentional modulation effects in the SC. Activations in the SC are shown for all subjects. Conventions are as in Figure 7.
To examine the robustness of these regions, we split the LGN data in one-half (cycles 1, 4, and 6 vs cycles 2, 3, and 5) and calculated the mean AMI across stimulus type for the voxels in each one-half. A total of 80.3% of all of the voxels in the LGN ROIs across subjects had good deconvolution fits for both halves of the data. For these voxels, AMI was significantly correlated between the two halves (r = 0.13; p = 0.000021). The spatial locations of the areas of attentional enhancement and suppression in the LGN were generally consistent between the two halves of the data set, as depicted in supplemental Figure 3 (available at www.jneurosci.org as supplemental material). Interestingly, as shown in supplemental Figure 4 (available at www.jneurosci.org as supplemental material), the AMI for the full data set was not significantly correlated between stimulus types, and although there was a similar distribution of attentional enhancement or suppression in response to each stimulus, their spatial distribution differed. Together, these results suggest that the distribution of spatial attention enhancement and suppression effects within the LGN is not random and can differ in response to different stimuli.
The regions of attentional enhancement in the LGN tended to be located medially and to be oriented obliquely, similar to a region of constant polar angle representation (Schneider et al., 2004). Therefore, we examined whether regions of attentional enhancement or suppression corresponded to features in the retinotopic organization of the LGN. In Figure 9A, a comparison of the AMIs (left panel) and the polar angle retinotopic coordinate (right panel), as inferred from the phase parameter obtained during the fit of the response model to the hemodynamic response of each voxel, is shown for subject S4 for the LGN and S1 for the SC. In Figure 9B, the AMIs from each LGN voxel activated in the four subjects are plotted against its respective polar angle coordinate. Confirming our previous observations (Schneider et al., 2004), fewer voxels represented the vertical meridian than other areas of the visual field. The blue dashed line indicates AMI = 0 (i.e., no attentional modulation). Voxels located on the perimeter side of this line have AMI > 0, and those located on the center side have AMI < 0. The red shaded region indicates the 95% confidence interval of the AMI at that polar angle, as calculated by smoothing the data with a Gaussian with a SD of π/16 radians. The distribution of AMIs was relatively uniform across the visual field in the LGN, with each location in the visual field being represented by some voxels exhibiting attentional enhancement and others exhibiting suppression.
Figure 9.

Comparison of attentional modulation maps and retinotopic maps. A, In the left panel, the AMI is plotted for each voxel in the LGN of one subject. As in Figure 7, AMI is indicated by color, as shown on the color bar. In the right panel, the polar angle coordinate of the retinotopic representation of each voxel in the LGN is shown for the same subject. The colored disk indicates the mapping between color and the retinotopic location, with yellowish colors representing the upper hemifield and bluish colors the lower hemifield. B, For each voxel and each subject, the AMIs are plotted against the polar angle coordinate. Each dot represents a single voxel, with dots in the right side of the graph representing voxels in the left LGN, and dots on the left, the right LGN. The dashed blue line indicates AMI = 0 (i.e., no attentional modulation). AMI = −1, which is the maximum possible attentional suppression, is plotted in the center, and AMI = +1, the maximum attentional enhancement, is plotted at the perimeter. The red shaded area indicates the 95% confidence interval of the mean smoothed AMI at that polar angle coordinate. The meridian conventions are as in Figure 3. C, D, Results for the SC. All conventions are as in B and D.
The same data for the SC are shown in Figure 9, C and D. The AMIs for the SC were large and positive throughout most of the visual field, but interestingly, they became significantly negative near the upper vertical meridian. The functional significance of the attentional suppression in this area of the SC field is unclear. Near the lower vertical meridian, there were not enough voxels meeting the inclusion criteria to permit a comparison (Schneider and Kastner, 2005).
Eye movements
Although the LGN and SC exhibited retinotopic maps similar to those reported in previous studies (Schneider et al., 2004; Schneider and Kastner, 2005), thereby suggesting that subjects maintained fixation well, two of the subjects (S1 and S2) were retested under eye movement control while covertly tracking the bow tie stimuli to further rule out eye movements as a potential confounding factor. In both subjects, the dynamic gaze position appeared to randomly populate the space around the fixation point. To check for systematic changes in gaze position related to the stimulus, the time series of horizontal and vertical gaze positions were each averaged over the six scanning runs for each subject. A Fourier transform was performed on the mean time series for each coordinate to determine the spectral power at the rotation frequency of the stimulus. The amplitudes at the stimulus-related frequencies were small and similar to the noise at nearby frequencies: for S1, the amplitudes were 0.14 and 0.10° for the horizontal and vertical positions, and for S2, the amplitudes were 0.21 and 0.38°, respectively; for both subjects these amplitudes were much smaller than the range of the normal fixational eye movements. Therefore, the eye movement control data indicate that subjects did not systematically track the stimuli, and thus eye movements did not contaminate the experimental results.
Discussion
Activity in both the LGN and SC was modulated by sustained spatial attention, the effects of which were retinotopically specific and independent from the feature content of the stimuli, whether moving dots or transient colored shapes. The convergence of the results across stimuli support their generality given that the stimuli and tasks varied considerably in feature content, selection criterion, and difficulty. The attentional enhancement in the SC was markedly stronger than that in the LGN; whereas the SC exhibited nearly uniform enhancement throughout its structure, except near the vertical meridian, the LGN contained regions of both enhancement and suppression. In both the LGN and SC, groups of voxels that were the least sensitive to changes in stimulus contrast tended to be most strongly enhanced by attention. In the LGN, this suggests that the M layers are more strongly enhanced by sustained attention than the P layers.
Attentional modulation in the LGN has been reported in three other studies (Vanduffel et al., 2000; O'Connor et al., 2002; McAlonan et al., 2008). The first report of attentional modulation in the LGN was a deoxyglucose study in the macaque (Vanduffel et al., 2000). In this study, when a monkey attended to the orientation features of a stimulus, activity in the M layers of the LGN was suppressed at retinotopic locations just peripheral to the stimulus, compared with a spatial attention task, in which no such suppression was observed. There was little difference in modulation between the two tasks at retinotopic locations representing the stimulus, or in the P layers of the LGN. In the present study, rather than comparing modulations between two types of attentional tasks, we compared the responses evoked by attended stimuli to those evoked by unattended stimuli, and we did observe attentional modulation in the area of the LGN that represented the stimulus. In fact, because we defined our ROIs based on the responses to the stimulus, our analyses were restricted to portions of the LGN representing the stimulus, which, given the retinal magnification factor with eccentricity (Schneider et al., 2004), encompassed the vast majority of the LGN volume. We observed attentional modulation throughout the structure of the LGN, and therefore we conclude that the effects of attention are not limited to the M layers of the LGN. Although we were not able to isolate the individual LGN layers at the spatial resolution used in this study, the correlation between contrast sensitivity and attentional modulation suggests that the response enhancement was stronger in the M than in the P layers. This finding corroborates accounts of selective attention suggesting that the M neurons are essential for the allocation of attentional resources (Cheng et al., 2004). However, our results also show that, although the attentional modulation was stronger in LGN voxels likely to be dominated by M input, they were not confined to these portions of the LGN.
Our findings nicely converge with the results of a recent electrophysiology study that examined effects of spatial attention in M and P neurons of LGN as well as TRN neurons in monkeys trained on a stimulus matching task. It was shown that both M and P neurons were modulated by attention with an effect size of ∼10% in the population, similar to the magnitude of attention effects measured with hemodynamic signals in the present study (McAlonan et al., 2008). Furthermore, a distribution of attentional effects in individual neurons showed both weak suppression and generally stronger enhancement effects, similar to our observations at the level of single voxels. Importantly, the physiology results suggest that the attention effects in the LGN are mediated through inhibitory control of TRN neurons.
The third study, an fMRI investigation of the human LGN (O'Connor et al., 2002), reported enhanced responses to a peripheral flickering checkerboard when attention was directed to it instead of a competing task at the fixation point; increasing the difficulty of the central task increased the magnitude of this effect. In addition, attending to a flickering checkerboard stimulus presented in one hemifield increased its response relative to an ignored checkerboard presented simultaneously in the opposite hemifield. This latter experiment, which was most comparable with those in the present study, produced an effect with an AMI of 0.0925, comparable with the mean AMI of 0.073 ± 0.013 measured in the present study in the LGN.
O'Connor et al. (2002) used standard resolution fMRI, which does not permit investigating the subdivisions of the LGN, and reported modulatory effects on the LGN as a whole. In the present study, we used higher-resolution fMRI and were able to detect attentional effects in individual LGN voxels. With the higher resolution, we were not only able to investigate differential effects of sustained attention on the M- and P-LGN, but also to determine the retinotopic specificity of the attentional effects. Surprisingly, we observed robust clusters of attentional enhancement or suppression within the LGN structure, and we were able to determine that the locations of these clusters were not directly correlated to the retinotopic organization. Each retinotopic polar angle location appeared to be represented by some voxels exhibiting attentional enhancement and others exhibiting suppression. The existence of suppressive regions is a novel finding, although its functional and structural significance within the LGN is unclear. The suppressive regions within the LGN are different from the zones of suppression that might surround a “spotlight” of attentional enhancement or from the suppression that has been observed in the unattended regions of the visual field (Tootell et al., 1998; Brefczynski and DeYoe, 1999); rather, the suppressive regions in the LGN are those in which the response to the attended one-half of the stimulus was weaker than the response to the unattended one-half that was located in the opposite hemifield. The initial responses of neurons in the adjacent thalamic reticular nucleus are suppressed by attention (McAlonan et al., 2008), but its connections to the LGN are inhibitory (Yingling and Skinner, 1976) and are unlikely to be responsible for the suppression effects observed in parts of the LGN.
Compared with the LGN, the magnitude of the attentional modulation in the SC was quite large. On average, the response amplitudes evoked by the unattended sector of the stimuli were 40% less than those evoked by the attended sector. This compares to a 10% modulation in the LGN. The SC belongs to a distributed network of brain areas, including the frontal eye field (FEF), responsible for eye movements and shifts in attention (for review, see Wurtz and Albano, 1980; Sparks, 1986; Moschovakis et al., 1996; Sparks, 2002; Krauzlis, 2004a; Shipp, 2004). The connection from the FEF to SC is highly topographically organized (Sommer and Wurtz, 2000). One of the primary functions of the SC may be to orient attention in space and to prepare orienting motor responses, but a role for the SC in sustained attention has not yet been established.
Previous studies have shown that the SC is modulated by attention during transient spatial cueing and eye movement tasks. In an fMRI study, the SC was more strongly activated during an overt search task compared with nondirected eye movements (Gitelman et al., 2002). Several electrophysiological studies in the macaque have shown that responses in neurons in the intermediate layer of the SC are enhanced during covert shifts of attention, when stimuli are spatially cued (Robinson and Kertzman, 1995; Gattass and Desimone, 1996; Kustov and Robinson, 1996; Bell et al., 2004; Fecteau et al., 2004; Ignashchenkova et al., 2004; Lee and Keller, 2006). In the macaque, neurons in the rostral SC exhibited an increase of activity in response to visual motion that would subsequently be a target for pursuit, similar to the increases in activity that occur before a saccade (Krauzlis, 2004b). The results of the present study establish the importance of the SC in sustained spatial attention, in addition to its functional role in relation to saccadic eye movements or in reaction to spatial cues. In contrast to these results, preliminary results from a recent electrophysiology study suggest that only the FEF, but not the SC, is modulated by endogenous shifts in attention, whereas both structures are modulated by reflexive shifts of attention (McPeek and Lee, 2007). Additional research will be necessary to address this discrepancy in findings from electrophysiology and neuroimaging.
In addition to being modulated by spatial attention, the SC can be modulated by feature-based attention. Previous functional imaging studies have found that SC activity is modulated by selective attention to motion (Büchel et al., 1998) or shape (Corbetta et al., 1991). In these studies, however, the attentional enhancement in the SC was not shown to be spatially specific and could possibly be attributed to changes in motivation or arousal. In the present study, the attended and unattended sectors of the stimuli were constantly present on the screen, and attention was constantly deployed during the task, which rules out nonspecific arousal as a source of the attentional effects. In addition, we found that the attentional effects did not depend on the difference in features between the two distinct types of stimuli we used.
In conclusion, activity in two of the subcortical visual nuclei, the LGN and SC, can be modulated by sustained spatial attention. The attentional modulation in the SC was especially prominent, indicating its importance in spatially directing and sustaining attention. Our results suggest that both attentional enhancement and suppression can be observed throughout the structure of the LGN, and that M parts of the LGN may be less likely to exhibit suppression than the P parts. High-resolution fMRI will prove useful in future studies to further define the effects of cognitive control on the different processing streams that originate in separate classes of retinal ganglion cells and remain disjoint in the subcortex before converging in the cortex.
Footnotes
This work was supported by National Institutes of Health Grants 2R01 MH64043, 1R01 EY017699, 2P50 MH62196, and T32 MH065214, and National Science Foundation Grant BCS-0633281.
References
- Bandettini PA, Jesmanowicz A, Wong EC, Hyde JS. Processing strategies for time-course data sets in functional MRI of the human brain. Magn Reson Med. 1993;30:161–173. doi: 10.1002/mrm.1910300204. [DOI] [PubMed] [Google Scholar]
- Bell AH, Fecteau JH, Munoz DP. Using auditory and visual stimuli to investigate the behavioral and neuronal consequences of reflexive covert orienting. J Neurophysiol. 2004;91:2172–2184. doi: 10.1152/jn.01080.2003. [DOI] [PubMed] [Google Scholar]
- Braddick OJ, O'Brien JM, Wattam-Bell J, Atkinson J, Hartley T, Turner R. Brain areas sensitive to coherent visual motion. Perception. 2001;30:61–72. doi: 10.1068/p3048. [DOI] [PubMed] [Google Scholar]
- Brainard DH. The psychophysics toolbox. Spat Vis. 1997;10:433–436. [PubMed] [Google Scholar]
- Brefczynski JA, DeYoe EA. A physiological correlate of the “spotlight” of visual attention. Nat Neurosci. 1999;2:370–374. doi: 10.1038/7280. [DOI] [PubMed] [Google Scholar]
- Büchel C, Josephs O, Rees G, Turner R, Frith CD, Friston KJ. The functional anatomy of attention to visual motion. A functional MRI study. Brain. 1998;121:1281–1294. doi: 10.1093/brain/121.7.1281. [DOI] [PubMed] [Google Scholar]
- Cheng A, Eysel UT, Vidyasagar TR. The role of the magnocellular pathway in serial deployment of visual attention. Eur J Neurosci. 2004;20:2188–2192. doi: 10.1111/j.1460-9568.2004.03675.x. [DOI] [PubMed] [Google Scholar]
- Corbetta M, Miezin FM, Dobmeyer S, Shulman GL, Petersen SE. Selective and divided attention during visual discriminations of shape, color, and speed: functional anatomy by positron emission tomography. J Neurosci. 1991;11:2383–2402. doi: 10.1523/JNEUROSCI.11-08-02383.1991. [DOI] [PMC free article] [PubMed] [Google Scholar]
- Creutzfeldt OD, Lee BB, Elepfandt A. A quantitative study of chromatic organisation and receptive fields of cells in the lateral geniculate body of the rhesus monkey. Exp Brain Res. 1979;35:527–545. doi: 10.1007/BF00236770. [DOI] [PubMed] [Google Scholar]
- Derrington AM, Lennie P. Spatial and temporal contrast sensitivities of neurones in lateral geniculate nucleus of macaque. J Physiol. 1984;357:219–240. doi: 10.1113/jphysiol.1984.sp015498. [DOI] [PMC free article] [PubMed] [Google Scholar]
- Dreher B, Fukada Y, Rodieck RW. Identification, classification and anatomical segregation of cells with X-like and Y-like properties in the lateral geniculate nucleus of old-world primates. J Physiol. 1976;258:433–452. doi: 10.1113/jphysiol.1976.sp011429. [DOI] [PMC free article] [PubMed] [Google Scholar]
- Engel SA, Glover GH, Wandell BA. Retinotopic organization in human visual cortex and the spatial precision of functional MRI. Cereb Cortex. 1997;7:181–192. doi: 10.1093/cercor/7.2.181. [DOI] [PubMed] [Google Scholar]
- Fecteau JH, Bell AH, Munoz DP. Neural correlates of the automatic and goal-driven biases in orienting spatial attention. J Neurophysiol. 2004;92:1728–1737. doi: 10.1152/jn.00184.2004. [DOI] [PubMed] [Google Scholar]
- Gattass R, Desimone R. Responses of cells in the superior colliculus during performance of a spatial attention task in the macaque. Rev Bras Biol. 1996;56:257–279. [PubMed] [Google Scholar]
- Gitelman DR, Parrish TB, Friston KJ, Mesulam MM. Functional anatomy of visual search: regional segregations within the frontal eye fields and effective connectivity of the superior colliculus. Neuroimage. 2002;15:970–982. doi: 10.1006/nimg.2001.1006. [DOI] [PubMed] [Google Scholar]
- Ignashchenkova A, Dicke PW, Haarmeier T, Thier P. Neuron-specific contribution of the superior colliculus to overt and covert shifts of attention. Nat Neurosci. 2004;7:56–64. doi: 10.1038/nn1169. [DOI] [PubMed] [Google Scholar]
- Jenkinson M, Bannister P, Brady M, Smith S. Improved optimisation for the robust and accurate linear registration and motion correction of brain images. Neuroimage. 2002;17:825–841. doi: 10.1016/s1053-8119(02)91132-8. [DOI] [PubMed] [Google Scholar]
- Krauzlis RJ. Recasting the smooth pursuit eye movement system. J Neurophysiol. 2004a;91:591–603. doi: 10.1152/jn.00801.2003. [DOI] [PubMed] [Google Scholar]
- Krauzlis RJ. Activity of rostral superior colliculus neurons during passive and active viewing of motion. J Neurophysiol. 2004b;92:949–958. doi: 10.1152/jn.00830.2003. [DOI] [PubMed] [Google Scholar]
- Kustov AA, Robinson DL. Shared neural control of attentional shifts and eye movements. Nature. 1996;384:74–77. doi: 10.1038/384074a0. [DOI] [PubMed] [Google Scholar]
- Lee KM, Keller EL. Symbolic cue-driven activity in superior colliculus neurons in a peripheral visual choice task. J Neurophysiol. 2006;95:3585–3595. doi: 10.1152/jn.01071.2005. [DOI] [PMC free article] [PubMed] [Google Scholar]
- McAlonan K, Cavanaugh J, Wurtz RH. Guarding the gateway to cortex with attention in visual thalamus. Nature. 2008;456:391–394. doi: 10.1038/nature07382. [DOI] [PMC free article] [PubMed] [Google Scholar]
- McPeek RM, Lee BT. Roles of superior colliculus and frontal eye field in reflexive and top-down attention shifts. Soc Neurosci Abstr. 2007;33:717–10. [Google Scholar]
- Merigan WH, Maunsell JH. How parallel are the primate visual pathways? Annu Rev Neurosci. 1993;16:369–402. doi: 10.1146/annurev.ne.16.030193.002101. [DOI] [PubMed] [Google Scholar]
- Moschovakis AK, Scudder CA, Highstein SM. The microscopic anatomy and physiology of the mammalian saccadic system. Prog Neurobiol. 1996;50:133–254. doi: 10.1016/s0301-0082(96)00034-2. [DOI] [PubMed] [Google Scholar]
- O'Connor DH, Fukui MM, Pinsk MA, Kastner S. Attention modulates responses in the human lateral geniculate nucleus. Nat Neurosci. 2002;5:1203–1209. doi: 10.1038/nn957. [DOI] [PubMed] [Google Scholar]
- Pelli DG. The VideoToolbox software for visual psychophysics: transforming numbers into movies. Spat Vis. 1997;10:437–442. [PubMed] [Google Scholar]
- Petit L, Beauchamp MS. Neural basis of visually guided head movements studied with fMRI. J Neurophysiol. 2003;89:2516–2527. doi: 10.1152/jn.00988.2002. [DOI] [PubMed] [Google Scholar]
- Robinson DL, Kertzman C. Covert orienting of attention in macaques. III. Contributions of the superior colliculus. J Neurophysiol. 1995;74:713–721. doi: 10.1152/jn.1995.74.2.713. [DOI] [PubMed] [Google Scholar]
- Schmitz B, Käsmann-Kellner B, Schäfer T, Krick CM, Grön G, Backens M, Reith W. Monocular visual activation patterns in albinism as revealed by functional magnetic resonance imaging. Hum Brain Mapp. 2004;23:40–52. doi: 10.1002/hbm.20046. [DOI] [PMC free article] [PubMed] [Google Scholar]
- Schneider KA, Kastner S. Visual responses of the human superior colliculus: a high-resolution functional magnetic resonance imaging study. J Neurophysiol. 2005;94:2491–2503. doi: 10.1152/jn.00288.2005. [DOI] [PubMed] [Google Scholar]
- Schneider KA, Richter MC, Kastner S. Retinotopic organization and functional subdivisions of the human lateral geniculate nucleus: a high-resolution functional magnetic resonance imaging study. J Neurosci. 2004;24:8975–8985. doi: 10.1523/JNEUROSCI.2413-04.2004. [DOI] [PMC free article] [PubMed] [Google Scholar]
- Sclar G, Maunsell JH, Lennie P. Coding of image contrast in central visual pathways of the macaque monkey. Vision Res. 1990;30:1–10. doi: 10.1016/0042-6989(90)90123-3. [DOI] [PubMed] [Google Scholar]
- Shapley R, Kaplan E, Soodak R. Spatial summation and contrast sensitivity of X and Y cells in the lateral geniculate nucleus of the macaque. Nature. 1981;292:543–545. doi: 10.1038/292543a0. [DOI] [PubMed] [Google Scholar]
- Sherman SM, Koch C. The control of retinogeniculate transmission in the mammalian lateral geniculate nucleus. Exp Brain Res. 1986;63:1–20. doi: 10.1007/BF00235642. [DOI] [PubMed] [Google Scholar]
- Shipp S. The brain circuitry of attention. Trends Cogn Sci. 2004;8:223–230. doi: 10.1016/j.tics.2004.03.004. [DOI] [PubMed] [Google Scholar]
- Sommer MA, Wurtz RH. Composition and topographic organization of signals sent from the frontal eye field to the superior colliculus. J Neurophysiol. 2000;83:1979–2001. doi: 10.1152/jn.2000.83.4.1979. [DOI] [PubMed] [Google Scholar]
- Sparks DL. Translation of sensory signals into commands for control of saccadic eye movements: role of primate superior colliculus. Physiol Rev. 1986;66:118–171. doi: 10.1152/physrev.1986.66.1.118. [DOI] [PubMed] [Google Scholar]
- Sparks DL. The brainstem control of saccadic eye movements. Nat Rev Neurosci. 2002;3:952–964. doi: 10.1038/nrn986. [DOI] [PubMed] [Google Scholar]
- Tootell RB, Reppas JB, Kwong KK, Malach R, Born RT, Brady TJ, Rosen BR, Belliveau JW. Functional analysis of human MT and related visual cortical areas using magnetic resonance imaging. J Neurosci. 1995;15:3215–3230. doi: 10.1523/JNEUROSCI.15-04-03215.1995. [DOI] [PMC free article] [PubMed] [Google Scholar]
- Tootell RB, Hadjikhani N, Hall EK, Marrett S, Vanduffel W, Vaughan JT, Dale AM. The retinotopy of visual spatial attention. Neuron. 1998;21:1409–1422. doi: 10.1016/s0896-6273(00)80659-5. [DOI] [PubMed] [Google Scholar]
- Vanduffel W, Tootell RB, Orban GA. Attention-dependent suppression of metabolic activity in the early stages of the macaque visual system. Cereb Cortex. 2000;10:109–126. doi: 10.1093/cercor/10.2.109. [DOI] [PubMed] [Google Scholar]
- Wiesel TN, Hubel DH. Spatial and chromatic interactions in the lateral geniculate body of the rhesus monkey. J Neurophysiol. 1966;29:1115–1156. doi: 10.1152/jn.1966.29.6.1115. [DOI] [PubMed] [Google Scholar]
- Wurtz RH, Albano JE. Visual-motor function of the primate superior colliculus. Annu Rev Neurosci. 1980;3:189–226. doi: 10.1146/annurev.ne.03.030180.001201. [DOI] [PubMed] [Google Scholar]
- Yingling CD, Skinner JE. Selective regulation of thalamic sensory relay nuclei by nucleus reticularis thalami. Electroencephalogr Clin Neurophysiol. 1976;41:476–482. doi: 10.1016/0013-4694(76)90059-6. [DOI] [PubMed] [Google Scholar]