Abstract
We conducted behavioral and EEG experiments to identify physiological correlates of perceptual binding during two types of binocular rivalry: (1) conventional ‘eye’ rivalry where perception alternates between the two monocular images presented one to each eye and (2) interocular ‘percept’ rivalry, where perception alternates between percepts formed by grouping complementary hemifields one from each eye. We employed ‘frequency-tagging’ by flickering a grating in each hemifield of each eye at different frequencies to elicit SSVEP responses specific to each hemifield of each eye. When the gratings in complementary visual fields of the two eyes were congruent in color and orientation, robust interocular ‘percept’ rivalry was observed with roughly equal probability to conventional ‘eye’ rivalry. The SSVEPs evoked by the flickering gratings were enhanced by conscious perception at both posterior and frontal electrodes only during conventional ‘eye’ rivalry and not during interocular ‘percept’ rivalry, suggesting that dominance of one eye is the basis of most previous reports of SSVEP modulation by conscious perception. We also observed nonlinear SSVEP responses at the sums of our four fundamental frequencies. These combination responses were only produced by flicker in complementary visual hemifields – in the same eye or across eyes, but never by incongruent flickering gratings that occupy the same visual field across eyes, suggesting that they are related to the binding of the visual hemifields (monocular or interocular) into a coherent percept. These combination responses were modulated by the type of rivalry experienced by the observer, but not by the specific conscious perception. Neural processes related to perceptual binding of both rival percepts take place during binocular rivalry even when only one percept is consciously perceived. This suggests that conventional ‘eye’ and interocular ‘percept’ rivalry both involve competition between percepts.
1. Introduction
Binocular rivalry arises when two incongruent images are presented one to each eye of the observer. The two images compete for conscious perception, resulting in alternating episodes of perceptual dominance, usually lasting about 2 secs, during which only one image is visible to the observer. The other image is suppressed and not perceived. The source of competition in binocular rivalry has been a subject of debate since its discovery. One notion is that rivalry occurs between eyes (Lee & Blake, 2004) at the first stages of binocular interaction between monocular pathways, presumably early in the visual system (Blake & Logothetis, 2002). Another view is that rivalry is competition between two percepts presumably higher up in visual processing (Blake and Logothetis, 2002) and even in the frontal lobes (Tononi et al., 1998; Srinivasan et al., 1999; Srinivasan and Petrovic, 2006). This view supports the idea that binocular rivalry is a useful paradigm to investigate conscious perception in EEG (Lansing 1964; Cobb and Morton 1967; Brown and Norcia, 1997; Koernbach et al., 1999; Roeber and Schrager, 2004; Srinivasan, 2004), MEG (Tononi et al., 1998; Srinivasan et al., 1999; Srinivasan and Petrovic, 2006), neurophysiological (Leopold and Logothetis, 1996; Logothetis et al., 1996; Fries et al., 2002), or fMRI studies (Lumer et al., 1998; Tong et al., 1998; Polonsky et al., 2000).
In these physiological experiments on binocular rivalry, the two incongruent images presented one to each eye always formed a single coherent percept. Such stimuli could give rise to competition between the eyes and competition between percepts. The physiological evidence obtained in studies using rival unitary monocular images appears to support both interpretations. Leopold and Logothetis (1996) recorded single cell activity in V1, V2, V4, and MT while monkeys reported grating orientation during binocular rivalry. While most of the recorded cells in V1 and V2 always responded to their preferred grating orientation, activity in only 18% of the cells was modulated by the perceived dominance/nondominance of their preferred stimulus. A higher percentage of cells in V4 (34%) and MT (43%) were modulated by perceptual dominance. In a follow-up study, Sheinberg and Logothetis (1997) recorded from cells in IT, where almost 90% of recorded cells were modulated by conscious perception. Human MEG and EEG studies using whole head recording have also demonstrated robust increases in power and phase-locking of frontal lobe responses to flicker presented to one eye during conscious perception of the flicker (Srinivasan et al., 1999; Srinivasan, 2004; Srinivasan and Petrovic, 2006). While these monkey and human studies suggest that the degree of modulation increases as one moves up the visual pathway, this implies neither that rivalry takes place higher up in the visual system, nor between percepts. For one thing, at least some cells early in the visual system do appear to modulate their firing rate with conscious perception (Leopold and Logothetis, 1996), and greater selectivity in higher stages of the visual system may just reflect the consequences of the activity of these cells. The sensitivity of early visual areas to conscious perception has also been reported in local field potentials (Fries et al., 1997) and fMRI studies (Polonsky et al., 2000).
Psychophysical studies have demonstrated the existence of percept rivalry by manipulating the timing of inputs to each eye. Binocular rivalry has been observed between two images that were flickered one to each eye, but never presented simultaneously to the observer (O’Shea and Crassini, 1984; Srinivasan and Petrovic, 2006). The images were presented in alternation, with a brief dark period between the images. When the monocular flicker frequency was < 4 Hz, the observers primarily experienced a unitary flicker that alternated between the two images. When the flicker frequency was > 4 Hz, the observers primarily experienced two single-image flickers that exhibit conventional rivalry with episodes of perceptual dominance of each single-image flicker. These observations are consistent with earlier psychophysical studies of the Gestalt flicker frequency (van de Grind, et al., 1973). The rivalry observed in these study is between two percepts of single image flicker rather than between the individual images presented to the two eyes.
Another technique used to demonstrate percept rivalry is to rapidly swap the stimuli between the eyes. One study swapped stimuli between the eyes every 333 msec while flickering the images at 18 Hz (Logothetis et al. 1996). They found that observers’ experiences were similar to that of conventional rivalry, with episodes of dominance lasting about 2 sec – much longer than the stimuli swap rate. Lee and Blake (1999) extended this study by using stimuli swap rates ranging from 1.4 Hz (stimulus exchanged every 722 msec) to 6 Hz (167 msec) and instructed the observer to categorize their perceptual experience. A “slow, irregular change,” longer than the stimulus swap rate, signified percept rivalry; “fast, rapid changes” occurring several times per second suggested eye rivalry. They showed that percept rivalry is seen under limited conditions – at a swap rate of about 300–400 msec, a spatial frequency of about 6–7 cpd, and when stimuli were abruptly and not gradually swapped. With other stimulus parameters, eye rivalry was mostly reported. In a further extension of this experimental method, it has also been shown that both eye and percept rivalry can co-exist (Bonneh et al., 2001) supporting the notion of competition at multiple levels depending on stimulus parameters in these displays. Recently developed neural models (Wilson, 2003) incorporate a hierarchy of competition between eyes early in the visual system and competition between percepts later in the visual system to explain these data.
Physiological effects specific to competition between percepts in binocular rivalry have not yet been identified, primarily due to the use of rivalry between unitary monocular images in all physiological experiments. The phenomenon of rivalry between two percepts formed by interocular grouping of complementary image fragments, first reported by Diaz-Caneja in 1928 (see translation by Alais et al., 2000) and subsequently investigated by Wade (1973) and Kovacs et al (1996), have also provided evidence of percept rivalry. In the study by Kovacs et al (1996) complementary random fragments of two images were distributed between the two eyes. The observers were able to experience rivalry between two coherent images formed by grouping relevant elements from both eyes. In this case, perceptual competition seems to be the source of rivalry, since the two rival percepts are each constructed from inputs to both eyes. In the present paper, we further investigated this phenomenon using psychophysical and physiological methods to identify neural correlates of percept rivalry. The results demonstrate that the competing percepts are always perceptually bound during both conventional ‘eye’ rivalry and interocular ‘percept’ rivalry.
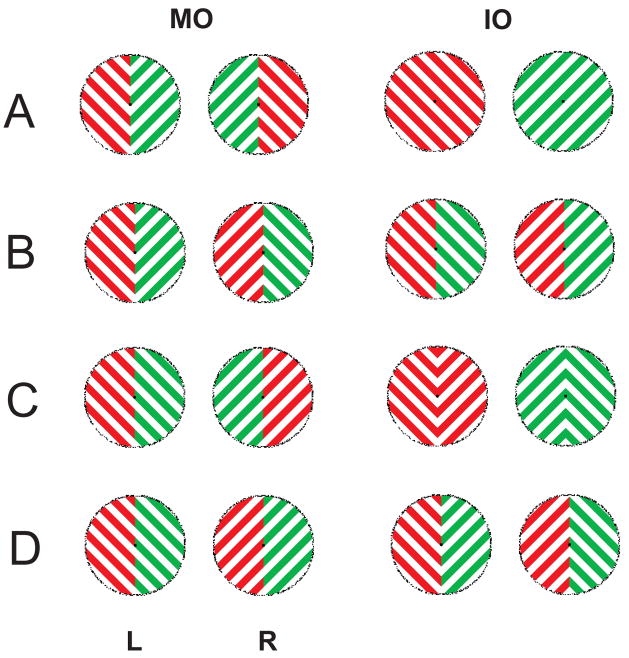
We first carried out a psychophysical experiment (Experiment 1) to contrast the percepts reported for each of the exemplar displays shown in Figure 1. In order to make use of these displays for a subsequent EEG experiment (Experiment 2), the grating presented in each hemifield of each eye was flickered at a distinct rate as exemplified in Figure 2 for display A. In each of displays A–D when the two images in the upper row are presented one to each eye, the observer may perceive one of the monocular images presented to each eye, corresponding to conventional ‘eye’ rivalry between the eyes (MO rivalry). In this case, when the image presented to one eye is perceived, the image presented to the other eye is not perceived. Alternatively, interocular ‘percept’ rivalry can take place between two percepts constructed by interocular grouping of complementary hemifields of each monocular image (IO rivalry). As shown in Figure 1, in this case, one hemifield from each eye is perceived, while the other pairing of hemifields is not perceived.
Figure 1.
The left column shows the stimuli consisting of square wave gratings that are sine-flickered. The images were presented to observers, one to each eye, through a stereoscope. A–D are examples of one permutation. In this permutation, the left visual field of the left eye is always shown a red grating sloping downward. Three other permutations were used with red sloping upward and green sloping upward or downward in the left visual field. Green and red colors were psychophysically matched for brightness. MO percepts correspond to the stimuli presented into each eye, while the right column shows the corresponding possible IO percepts. Observers reported dominance by pushing one of four buttons representing four possible perceived shapes, regardless of color.
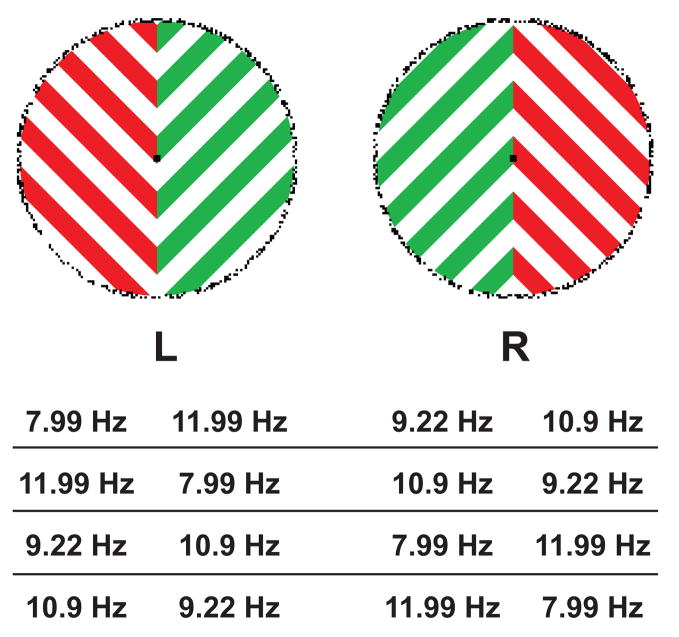
Figure 2.
Possible frequency assignments to the sine-flickered gratings, shown for the example stimuli of Figure 1A. The frequency of the flicker corresponds to one sinusoidal luminance cycle (light-dark-light). The 8 and 11 Hz, and 9 and 12 Hz flickers are always placed in different eyes and opposite visual fields to avoid 1 Hz beats. For the behavioral experiment (Experiment 1) all four display types shown in Figure 1 were sine-flickered as shown here for Figure 1A.
In our displays, observers can potentially group relevant hemifields of an image based on certain common characteristics (eye, color, and orientation). The results of experiment 1 indicated that only for displays of the type shown in Figure 1A there is roughly equal probability of MO rivalry and IO rivalry; for displays B–D, MO rivalry is mostly reported. We used only displays of type shown in Figure 1A in Experiment 2, and recorded steady-state visual evoked potentials (SSVEPs) at each flicker frequency corresponding to each visual field of each eye. We contrasted the modulations of the SSVEPs specific to each hemifield of each eye between episodes of dominance and suppression, to identify correlates of conscious perception specific to the grating presented in each hemifield of each eye during the two types of rivalry.
We then made use of nonlinear properties of SSVEPs to investigate the binding of the hemifields into a coherent percept. SSVEPs have long been reported to show combination responses at nf1±mf2 when two flickers are presented at frequencies f1 and f2, where m and n are positive integers (Zemon and Ratliff, 1984; Regan and Regan, 1988; Regan, 1989). In our experiment, we detected the first order combination responses at the sums of the flicker frequencies (i.e., f1 + f2). These nonlinear SSVEPs clearly reflect neural populations responding to the pair of stimuli each flickering at a different frequency, and thus potentially relate to binding the corresponding images into a coherent percept. We examined whether these combination responses are sensitive to the type of rivalry the subject experienced (IO rivalry versus MO rivalry), to examine the role of binding of percepts in each type of rivalry.
2. Results
Experiment 1: Psychophysical results
The purpose of Experiment 1 was to contrast the observers reports for the 4 types of displays shown in Figure 1 (A–D) in 6 subjects. The examples shown in Figure 1 are a subset of the displays, with a fixed red grating in the left visual field of the left eye, out of a total of 16 different displays shown to each subject in order to counterbalance color and orientation. Each display was also shown 4 times to each subject to counterbalance flicker frequencies, as shown in Figure 2 for an example display of type A, for a total of 64 trials. Psychophysical data was collected for each of the displays as discussed in the Methods section. The observers were instructed to indicate the form of the figure perceived, ignoring the color. The four forms were lines and arrows of opposite orientation corresponding either to the images presented to each eye (MO rivalry) or the images formed by interocular grouping of complementary hemifields across the two eyes (IO rivalry) depending on the stimuli as shown in Figure 1.
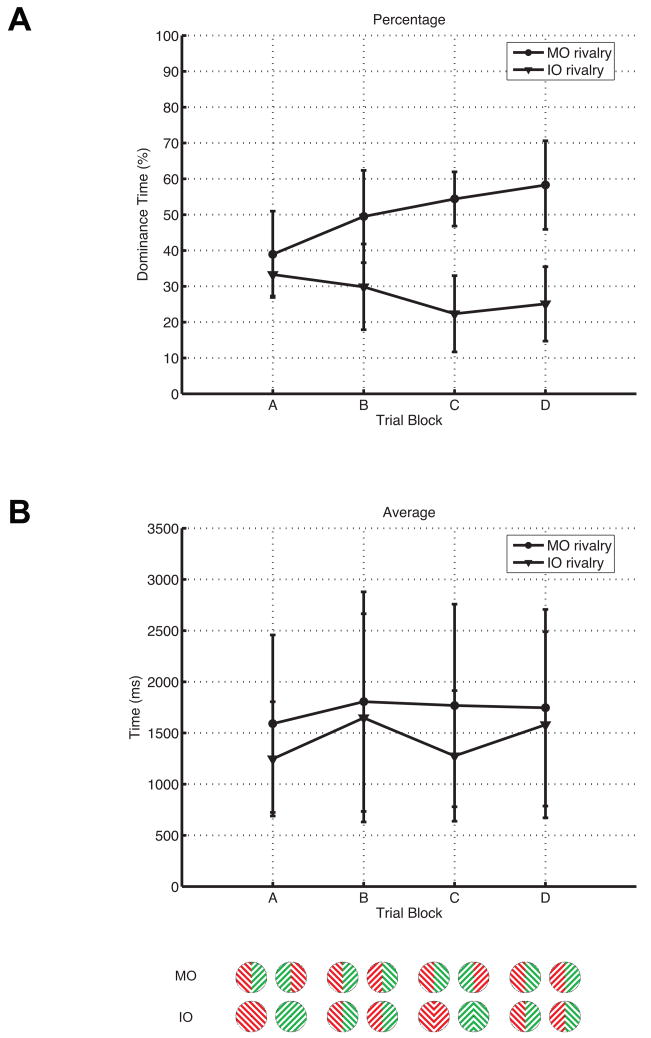
Total dominance time of MO and IO rivalry for six observers are plotted as percentage of total trial time in Figure 3A, and mean dominance times (i.e. average length of a reported episode of perceptual dominance) are plotted for each display type in Figure 3B. Mean dominance time is roughly equal (~1.5 sec) across the four display types. Thus, the differences in total dominance time between MO and IO rivalry is due to the number of dominance episodes. MO rivalry was reported more frequently, at around 50–60%, compared to around 20–30% for IO rivalry, for displays of type B–D. In comparison, observers experienced roughly equal amounts of MO and IO rivalry for displays of type A (30–40%). The total is less than 100% due to periods where the subject depressed none of the four switches during transitions between episodes of perceptual dominance. We fit a gamma distribution f (x)= λr/Γ(r)xr−1 exp(−λ x) to the distribution of durations of episodes of dominance normalized to the mean duration using the data from all six subjects using only the data from displays of type A (Logothetis et al., 1996). The parameters of the theoretical distribution were similar during MO rivalry (r=4.77, λ = 513 sec−1) and IO rivalry (r=5.37, λ = 5.94 sec −1).
Figure 3.
Behavioral results. (A) Shown are the total dominance times (during which observers experienced either MO or IO rivalry) for each of the four types of displays exemplified in Figure 1, plotted as percentages of total trial time. The dominance time is pooled over six observers, with MO rivalry plotted as circles, and IO rivalry plotted as triangles. Example percepts corresponding to each display type are shown at the bottom of the figure. Observers experienced roughly equal amounts of MO and IO rivalry when presented displays of type A, but saw more MO rivalry with the other 3 types of displays. (B) Plotted are the average dominant episode durations across the four display types. Average episode lengths do not differ significantly across the four display types, suggesting that the differences in total dominance time were due to the number of dominance episodes.
The data suggest that the line percept, coupled with color, serves as the strongest cue for interocular grouping of hemifields to form a coherent percept. Compared to the other experimental conditions, when presented displays of type A, observers reported more episodes of IO rivalry and consequentially less episodes of MO rivalry. In contrast, with the other three display types MO rivalry was favored over IO rivalry. In particular, MO rivalry between two percepts of mixed colored lines were favored over IO rivalry between two percepts of solid colored arrows when observers were presented displays of type C. This suggests that the junction in the arrow percept is a weaker grouping cue than the line percept in displays of type A despite the same color cue in both conditions.
Experiment 2: Psychophysical results
On the basis of the results of Experiment 1 we carried out the EEG experiment using only the displays of the type shown by the example in Figure 1A, with the same color and orientation presented in the complementary visual fields of the two eyes. By choosing this display we ensured similar number of episodes of the two types of rivalry facilitating comparisons of the EEG data. There were 4 such displays counterbalancing color and orientation, each presented on 4 separate trials flickered at different frequencies as shown in Figure 2 for one exemplar display. Psychophysical data on the distribution of durations of dominance episodes from this experiment were consistent with our data from Experiment 1 with displays of type A.
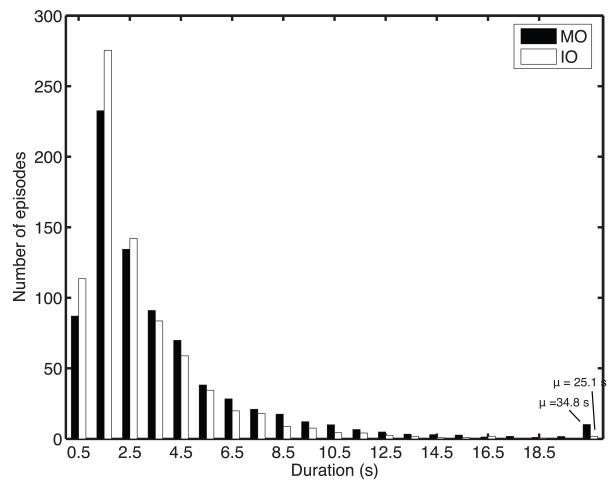
Since there was only 16 trials, we were able to collect substantially more psychophysical data in Experiment 2. We noticed that subjects would go through longer periods of alternation between the two percepts of MO rivalry than periods of alternation between the two percepts of IO rivalry. Moreover, they would never systematically alternate between one IO rivalry percept and one MO rivalry percept. We further examined the distribution of episodes of continuous alternation between percepts classified as MO and IO rivalry. We defined a rivalry state of each type (MO rivalry or IO rivalry) as a series of alternations between episodes of the two competing percepts corresponding to that rivalry type, with gaps no longer than 500 ms, to allow time for the subject to indicate with the switches the change of percept. In Figure 4, we plot the distributions of duration of rivalry states combining all observers. The rivalry state of IO rivalry is characterized by more episodes of shorter durations (< 5 secs), while more longer durations (> 5 secs) were seen for the rivalry state of MO rivalry, especially at durations > 20 sec (Wilcoxon rank-sum test, z ~ 11.5). The last bin in Figure 4 plots the average duration and number of episodes for MO and IO rivalry > 20 sec. Long episodes of MO rivalry are more frequent and of longer duration. This difference accounts for the small advantage for MO rivalry with this display as shown for Experiment 1 in Figure 3. These results suggest that MO rivalry is a more stable rivalry state than IO rivalry.
Figure 4.
Rivalry duration distributions. Shown are histograms of the durations of rivalry states of MO and IO rivalr, ignoring gaps < 500 ms. Plotted are the average of histograms over all observers. The last bin plots the average of all MO and IO rivalry durations > 20 sec. For MO rivalry, there were ~10 episodes, μ = 34.8 sec; for IO rivalry, there was ~1 episode, μ = 25.1 sec.
Experiment 2: Fundamental SSVEP responses and conscious perception
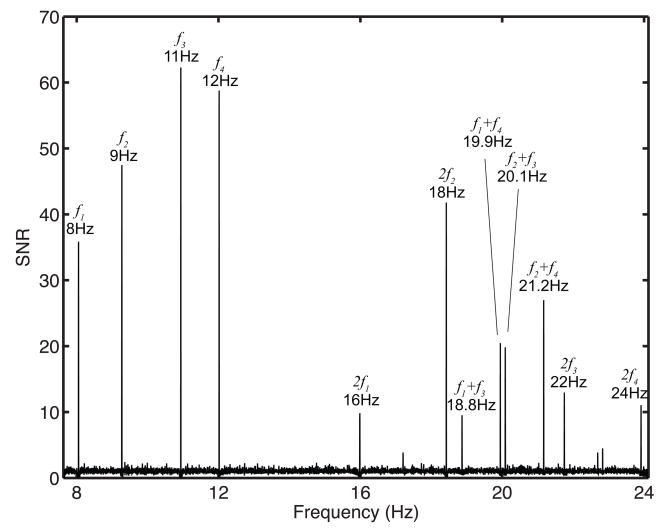
For each trial EEG data collected at 128 channels was Fourier transformed to calculate the power spectrum with very high frequency resolution (Δf ~ 0.003 Hz). The power spectrum was normalized to calculate the SNR spectrum by normalizing the power at each frequency to the average power in a narrow band (Δf ~ 0.03 Hz) surrounding each frequency, as discussed in the Methods section. Responses to stimuli flicker frequencies and combination frequencies could be seen in the SNR spectra of individual trials. Figure 5 plots, for one observer, the SSVEP SNR spectrum averaged over all 16 trials at a channel directly over the occipital lobe (Oz). Peaks of the four flicker frequencies – 8, 9, 11, and 12 Hz – are readily visible, along with their second harmonics. Also visible are peaks of nonlinear responses at the sums of the flicker frequencies. These peaks, produced presumably by the pairing of hemifields across and between eyes, can be seen at 19.9 Hz (8 + 12 Hz, MO rivalry), 20.1 Hz (9 + 11 Hz, MO rivalry), 18.9 Hz (8 + 11 Hz, IO rivalry), and 21.2 Hz (9 + 12 Hz, IO rivalry). Moreover, peaks generated by combinations of the 8 + 9 Hz and 11 + 12 Hz flicker were not observed above the noise floor. These combination frequencies corresponded to pairs of flickering stimuli that occupied the same region of visual space one in each eye; these pairs of frequencies correspond to the flickers that are rivaling.
Figure 5.
Steady-state EEG responses. Plotted is the SNR spectrum of a single observer, averaged over 16 trials. Peaks of the four fundamental flicker frequencies (f1 = 8, f2 = 9, f3 = 11, and f4 = 12 Hz) and their second harmonics are shown. We also report peaks for nonlinear combination responses (f1+f3 = 18.8 Hz, f1+f4 = 19.9 Hz, f2+f3 = 20.1 Hz, and f2+f4 = 21.2 Hz). However, combination responses for f1+f2 = 17.2 Hz and f3+f4 = 22.8 Hz were not observed above the noise (spontaneous activity). These flicker frequency pairs occupy the same visual space across both eyes.
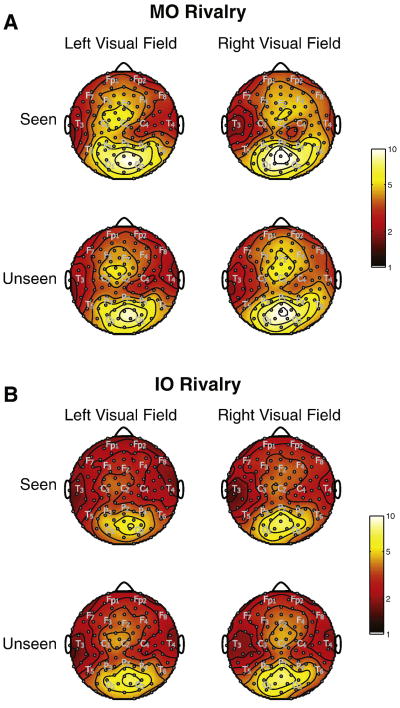
Topographic maps of log(SNR) for the fundamental frequencies for the same observer are shown in Figure 6, sorted by perceptual dominance reports, rivalry conditions, and visual field. Figure 6A and 6B show maps for MO and IO rivalry, respectively. We overlaid approximate positions of electrodes in the 10/20 system. For all conditions, the highest SNR was observed over posterior occipital and parietal electrodes, with a peak also observed over midline frontal areas. The frontal response is stronger and more widespread, including lateral frontal areas, during MO rivalry in comparison to IO rivalry. Since the spatial distribution of the response was consistent for left and right visual field flicker, we combined these responses for further analyses.
Figure 6.
Topographic maps of log(SNR) for one observer, plotted for fundamental frequencies. (A) plots MO and (B) plots IO rivalry conditions. Plots are subdivided into seen and unseen rivalry, and left and right visual fields. SNR was calculated, as described in the text, from the power spectrum by dividing power by the average power from 10 surrounding frequency bins. The SNR maps were averaged over the four fundamental flicker frequencies. The approximate locations of some 10/20 EEG electrodes are indicated by gray lettering.
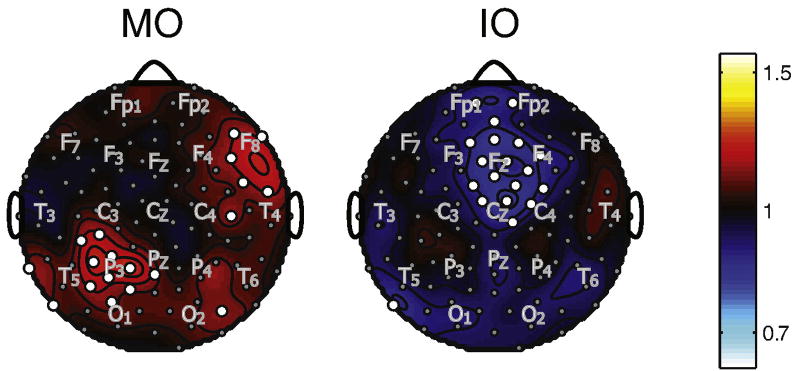
Figure 7 plots, on a log scale, topographic SNR differences of the response to each flicker between periods when the flicker was seen and periods when the flicker was not seen, averaged over the four fundamental frequencies and across the six subjects. White circles indicate channels with significant differences. The significance testing was performed using a bootstrap procedure described in the Methods section. During MO rivalry, SSVEP responses to the flicker in each visual hemifield are elevated bilaterally at posterior electrodes when the flicker is consciously perceived; this effect was strongest at left parietal electrodes across the observers. In addition, lateral temporal and prefrontal electrodes over the right hemisphere show increased power during conscious perception. In contrast, no significant elevation of the SSVEP was observed during IO rivalry when the flicker was consciously perceived. Instead, a significant decrease is observed at electrodes over midline frontal areas, and a decrease is observed at posterior channels, which did not reach significance at any channel.
Figure 7.
Summary of log(SNR) differences of seen vs. unseen MO and IO rivalry for the average over fundamental frequencies. Significant channels are labeled with white dots. The approximate locations of some 10/20 EEG electrodes are indicated by gray lettering. SSVEP responses showed an increase over left parietal and right frontal lobes during seen MO rivalry and a decrease during seen IO rivalry over midline frontal areas.
Experiment 2: Nonlinear SSVEP responses and perceptual binding
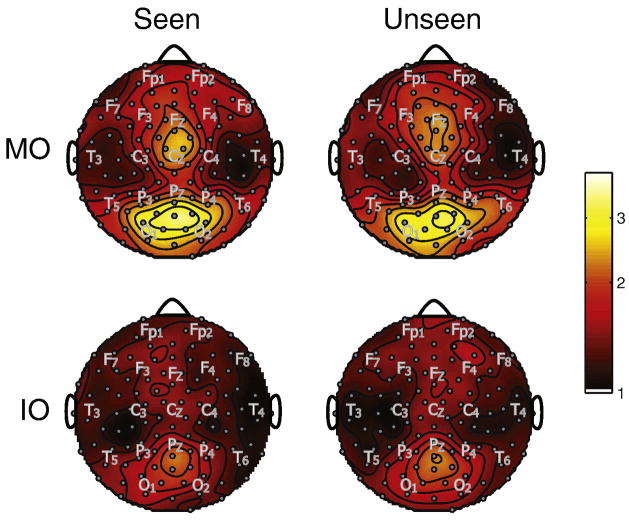
Figure 8 plots topographic maps in one subject of log(SNR) for the average over the combination frequencies corresponding to the percepts during MO rivalry (8 + 12 = 19.9 Hz; 9 + 11 = 20.1 Hz) and the percepts during IO rivalry (8 + 11 = 18.9 Hz; 9 + 12 = 21.2 Hz). The combination response is much stronger for MO rivalry frequencies than IO rivalry frequencies. We did not carry out any specific statistical test of this difference, since it was obvious at each channel for any observation. For MO rivalry, significant responses were observed over occipital, parietal, and midline frontal areas; during IO rivalry combination responses were observed mainly over central occipital and parietal regions. We did not observe significant differences in the combination response when the associated pairs of stimuli were seen versus when they were not seen for either MO rivalry or IO rivalry (not shown).
Figure 8.
Topographic maps of log(SNR) for one observer, plotted for combination frequencies. SNR was calculated, as described in the text, from the power spectrum by dividing power by the average power from 10 surrounding frequency bins. The SNR maps were averaged over four combination flicker frequencies. The approximate locations of some 10/20 EEG electrodes are indicated by gray lettering.
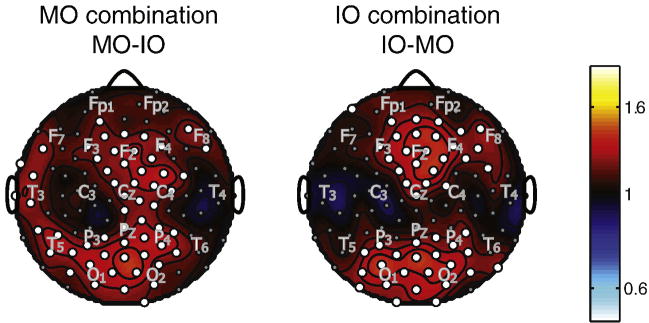
Our main focus in analyzing the nonlinear SSVEP responses was to determine of they were specific to the rivalry state of the observer. The rivalry state was defined as a period during which the observer alternates between the two percepts of one type of rivalry. We contrasted the response at the MO and IO combination frequencies between the rivalry state of MO rivalry and the rivalry state of IO rivalry averaged across subjects. Figure 9 plots the difference in log(SNR) at the MO combination frequencies between the rivalry states of MO rivalry and IO rivalry, during which only one of the percepts of that state is consciously perceived. The same plot was produced for IO combination response frequencies, but with log (SNR) during the rivalry state of MO rivalry subtracted from log (SNR) during the rivalry state of IO rivalry. Channels with significant differences are indicated with a white circle. Combination responses were stronger during their own respective rivalry state; MO combination frequencies were stronger during the rivalry state of MO rivalry, and IO combination responses were stronger during the rivalry state of IO rivalry. In both cases, increases were seen over midline frontal and occipital/parietal electrodes. Increases at the combination frequencies for MO rivalry extended to more lateral electrodes bilaterally over the frontal electrodes and at left temporal electrodes.
Figure 9.
Summary of log(SNR) differences the average of MO (8 + 12 = 19.9 Hz; 9 + 11 = 20.1 Hz) and IO (8 + 11 = 18.9 Hz; 9 + 12 = 21.2 Hz) combination frequencies between the rivalry states of MO and IO rivalry. For MO combination frequencies, the SNR in the rivalry state of IO rivalry was subtracted from the SNR in the rivalry state of MO rivalry. For the IO combination frequencies, SNR in the MO rivalry state was subtracted from the SNR in the rivalry state of IO rivalry. Significant channels are labeled with white dots. Gray lettering indicates the approximate locations of some 10/20 EEG electrodes. The MO and IO combination frequencies were enhanced during their corresponding rivalry state.
3. Discussion
Grouping of visual hemifields by eye, orientation, and color cues
We enabled competition between four percepts by using stimuli conducive to both conventional ‘eye’ rivalry between two percepts corresponding to images presented to each eye (MO rivalry) and interocular ‘percept’ rivalry between two percepts constructed by interocular grouping of complementary hemifields, one from each eye (IO rivalry). We manipulated the color and orientation of gratings presented in each hemifield of each eye as exemplified in Figure 1. Psychophysical results in Figure 3 suggest that, by default, subjects will experience rivalry between the images presented to each eye (MO rivalry); the eye is the strongest cue to grouping hemifields in our displays. With the displays of the type shown in Figure 1 B–D, observers reported more MO rivalry regardless of the congruence of orientation or color across the two visual hemifields – even for displays of type C where the images presented to each eye were incongruently colored lines and percepts obtained by interocular grouping (IO rivalry) were solid-colored arrows. Only when the two complementary hemifiields across the eyes were congruent in color and orientation, as in the displays of the type shown in Figure 1A, were the episodes of IO rivalry observed with comparable frequency to MO rivalry.
We found that the subjects did not alternate between a monocular percept and an interocular percept, but only between the two possible percepts of a rivalry state (MO rivalry or IO rivalry). In general there were longer duration MO rivalry states where the subject alternated between the two images presented one to each eye, and more numerous but shorter duration IO rivalry states where the subject alternated between the two images formed by interocular grouping of complementary hemifields. The duration of an episode of perceiving one percept was comparable in duration (~ 1,5 s) during the two types of rivalry.
Fundamental SSVEP responses are enhanced during MO rivalry and suppressed during IO rivalry
Our experimental setup delivered stimuli at four distinct frequencies, allowing us to track SSVEP responses to each visual hemifield using frequency tagging. Using observers’ reports of perceptual dominance, we sorted the data by the rivalry state (MO rivalry or IO rivalry) and by whether the hemifield was consciously perceived (seen or not seen). Significant increases in the SSVEP signal-to-noise ratio (SNR) to each hemifield over left parietal and right temporal regions were observed when the corresponding hemifield was seen during MO rivalry, but not during IO rivalry During IO rivalry, SSVEP SNR over midline frontal areas were suppressed when the corresponding hemifield was perceived. The increase in SNR during MO rivalry dominance is consistent with previous MEG power and coherence results (Tononi et al., 1998; Srinivasan et al., 1999). This suggests these increases observed over frontal areas in these earlier may be related specifically to eye dominance. Decreases in SNR over midline frontal regions during seen IO rivalry as compared to unseen IO rivalry suggest that signal from neural populations in areas of medial frontal cortex responding to a hemifield may be suppressed when that hemifield is perceived in conjunction with the complementary hemifield of the other eye. Eye movements have been shown to be a significant factor in switches in perceptual dominance (van Dam and van EE, 2006). IO rivalry episodes in our subjects might be easily disrupted with eye movements possibly explaining the observed suppression. A greater sensitivity of IO rivalry to eye movements might also explain the shorter durations of the IO rivalry state.
Combination SSVEP responses depend on rivalry type and not on conscious perception
We observed first-order combination SSVEP responses at the sums of the flicker frequencies that were possible only through nonlinear neuronal integration of flicker frequency pairs. Moreover, we recorded these combination responses primarily to frequency pairs originating from opposite hemifields. Frequency pairs that occupied the same visual space across both eyes yielded very little combination responses. These frequency pairs corresponded to the retinotopically matched but incongruent stimuli presented to each eye. Although Regan and Regan (1988) recorded combination responses to stimuli presented one to each eye in the same visual space, their study made use of congruent stimuli. With congruent stimuli, these responses are not distinguishable from the noise floor. This finding supports the notion that the combination responses we observed reflect neural systems that are related to the binding together of two visual hemifields.
Examing the MO and IO rivalry combination frequencies separately, we found that they were modulated by rivalry state but not by the conscious perception of the pair of hemifields. MO combination responses were enhanced during the rivalry state of MO rivalry, i.e., when they were alternating between the two possible monocular percepts, in comparison to the rivalry state of IO rivalry, i.e., when they were alternating between the two interocularly grouped percepts. The same is true for IO combination responses – SNR is enhanced during the rivalry state of IO rivalry in comparison to the rivalry state of MO rivalry. Comparisons between episodes of dominance and suppression of the specific percepts did not reach significance. We conclude that the neural populations contributing the combination responses are not influenced by conscious perception during MO rivalry or IO rivalry. If this were so, one would expect the combination frequency SNR to be modulated by perceptual dominance during MO and IO rivalry.
Binding of rival percepts during binocular rivalry
We observed nonlinear SSVEP responses to flickers in complementary hemifields, either in the same eye or different eyes, but not to the rivaling flickers that occupied the same visual space. These combination responses were apparently modulated by the type of rivalry experienced by the observers, but not by conscious perception. If we assume combination responses reflect neural systems closely related to binding the visual hemifields into a coherent percept, then the data suggest that the perceptual binding is strengthened during their corresponding rivalry types, and suppressed only when the subject experiences the other rivalry type. This means that even during conventional ‘eye’; rivalry, the two possible percepts, each consisting of complementary hemifields of one eye, are always bound together. This implies that any competition between eyes early in visual processing is not sufficient to prevent the binding of the two potential percepts in later stages of visual processing. If eye competition were influencing the binding of percepts further up in visual processing, the combination responses would have been sensitive to the specific percept perceived by the observer. Since neural processes related to percept binding take place specifically for the two rival percepts in one rivalry type, we can conclude that competition between the percepts contributes to both conventional ‘eye’ and interocular ‘percept’ forms of binocular rivalry.
4. Experimental Procedure
Experiment 1: Psychophysics
We conducted a psychophysical experiment to determine whether any of the stimulus configurations shown in Figure 1 is equally favorable to MO and IO rivalry, thus allowing contrasts between the two types of rivalry in an EEG experiment. Behavioral data were obtained from six right-handed adults (3 female and 3 male) aged 21–29. Informed consent was obtained from each observer.
Stimuli
Rivaling images consisting of red or green square wave gratings housed within a static fusing annulus were delivered, one to each eye, through a stereoscope. The stimuli were produced by a Power Mac G4 using Matlab (Natick, MA) and the Psychophysics Toolbox (Brainard, 1997), and displayed on a 19″ monitor (Viewsonic PF790) with a vertical refresh rate of 120 Hz.
Four types of stimuli (examples shown in Figure 1 A–D, top row) were tested, distinguished by their forms (lines or arrows) and features (orientation and/or color). The examples shown in this figure are 4 image pairs out of a total of 16 image pairs; in all of these examples, the image in the left visual field of the left eye is red and angled at 45 in one direction. The other 12 images (not shown) counterbalance color and orientation. Every image presented to each eye was of mixed color (red/green). In the pair of images shown in Figure 1A and 1B, gratings in the left half of each monocular image were angled at 45º in one direction, while gratings in the right half of the image were angled at 45º in the opposite direction. The resulting images appear as V-shaped arrows within the annulus, with the junction at the vertical meridian; one eye was shown upward pointing arrows while the other eye received downward pointing arrows. In Figure 1A, the pair of images presented one to each eye is incongruent with distinct color and orientation. Figure 1B shows a similar pair of stimuli with orthogonal orientation but identical colors in each hemifield. Figure 1C and D show two other pairs of images that each have the same orientation in the left and right hemifield but different colors; in Figure 1C the gratings presented to each eye have opposite color and orthogonal orientation in each hemifield while in Figure 1D they have the same color and orthogonal orientation.
Each half of each monocular image was presented sinusoidally in time at different flicker rates: 7.99, 9.22, 10.90, and 11.99 Hz. These frequencies are integer divisors of the vertical refresh frequency of the monitor and correspond to a complete light-dark-light cycle of the flicker. For simplicity, we have labeled these frequencies as 8, 9, 11, and 12 Hz, respectively. We restricted frequency pairings to prevent beats slower than 2 Hz within each eye; the 8 and 12 Hz flickers, and the 9 and 11 Hz flickers were always paired in the same eye. An example stimulus, with all possible frequency configurations, is shown in Figure 2. We counterbalanced color, shape, and frequency (2 × 2 × 4) to yield 16 trials for each of conditions A–D, and for a total of 64 trials.
Perceptual Classification of the Rivaling Percepts
The four possible percepts to stimuli are shown in Figure 1 A–D. In conventional ‘eye’ rivalry the observer perceived one of the two images that are presented, one to each eye as shown in the upper row; we refer to these two percepts collectively as MO rivalry, as the observer perceives the two hemifields presented to one eye and suppresses the two hemifields presented to the other eye. Alternatively, the observers can perceive percepts by joining together the outer or inner halves of the two images as shown in the lower row; we refer to these two percepts as IO rivalry since the observer’s percept is formed from grouping together hemifields from each eye. The stimuli in Figure 1B are of the same shape as 1A, and the percepts during MO rivalry are again mixed colored arrows, as shown in the middle row. However, during IO rivalry, the observers perceive lines of mixed color (Figure 1B lower). The stimuli in Figure 1C and 1D are both mixed-color gratings angled in the same direction in both hemifields, and the gratings were orthogonal between the two eyes. The MO rivalry percepts correspond to the images presented to each eye. In IO rivalry, the observers may group the inner or outer hemifields of each eye to form arrows of the same color (Figure 1C lower), or arrows of mixed colors (Figure 1D lower).
Psychophysical luminance matching
Prior to the experiment, the observer is shown a color wheel consisting of alternating red, green, black, white, and gray panels. With a key press, the colors of each panel were rapidly rotated between the five colors to generate apparent motion. If the luminance of the green panel were psychophysically lower than that of the red panel, the wheel would appear to rotate clockwise. If the green luminance were higher, the wheel would appear to rotate counterclockwise. Observers adjusted the green luminance until the wheel appeared to be flickering in place – indicating that the red and green colors were psychophysically equivalent in luminance.
Procedure
Observers were presented 64 trials in two behavioral sessions. Each session was divided into four blocks of 8 trials, with each trial lasting 100 sec. Observers reported periods of dominance by pushing one of four buttons representing four possible dominant percepts based only on form, ignoring color: 1) up arrows, 2) down arrows, 3) upward lines (with positive slope), and 4) downward lines (with negative slope) (Figure 1). Buttons were depressed for as long as their corresponding percepts are dominant. Depending on stimulus type, response buttons represented either MO or IO rivalry. For example, percepts of lines were considered IO rivalry using stimuli in Figure 1A, whereas with Figure 1D, they were categorized as MO rivalry.
Experiment 2: SSVEP recording
The results from the behavioral study indicated that the stimulus configuration shown in Figure 1A produced approximately equal amounts of MO and IO rivalry in our observers. We carried out EEG recordings of linear and nonlinear steady-state responses using only this display.
Stimuli
Stimuli of the type shown in Figure 1A of the behavioral study were used, with the same psychophysical luminance adjustments. The same four flicker frequencies were used: f1 = 8 Hz, f2 = 9Hz, f3 = 11 Hz, f4 = 12 Hz. Again, the 8 and 12 Hz flicker, and the 9 and 11 Hz flicker were always paired in the same eye. As shown in Figure 1A, observers perceive mixed colored lines during MO rivalry, and solid colored arrows during IO rivalry. Counterbalancing color, shape, and frequency within and between eyes yielded 16 trials in total.
Procedure
Trial lengths were extended to 300 sec. Observers were presented a total of 16 trials, while using the same reporting scheme as the behavioral study.
EEG recording
EEG data were collected from six observers from the behavioral study, using a 128 channel Geodesic Sensor Net (Tucker, 1993), which provides uniform spatial sampling of the scalp surface subtending an angle of 120 degrees form vertex. Eight electrodes were disabled to allow stimulus information to be synchronized with the EEG recording, while ten outer rim electrodes were discarded due to artifacts, reducing the number of available EEG channels to 110. EEG signals were recorded with a vertex reference, analog low-pass filtered at 50 Hz, and sampled at 1000 Hz.
Photocells attached to the monitor allowed the data acquisition system to record the timing of each unique flicker rate. Observers’ responses were recorded by a response pad connected to the EEG system. We generated four square-wave response functions, with a value of 1 for as long as observers depressed buttons corresponding to the four possible dominant percepts, and a value of 0 when the buttons are released. For the displays used in experiment 2, response functions corresponding to arrow percepts represent either seen or unseen MO rivalry, and those corresponding to line percepts represent either seen or unseen IO rivalry.
Data Analysis
High-resolution steady-state responses to the four fundamental and six combination frequencies (7.99 Hz + 11.99 Hz, 9.22 + 10.9 Hz, 7.99 + 10.9 Hz, 9.22+ 11.99 Hz, 7.99 + 9.22 Hz, and 10.9 + 11.99 Hz) were estimated by calculating the Fourier transform Fm(f) of the ~300 sec EEG recordings (Δf ~ 0.003 Hz), with the exact interval determined by the first and last presentation of the stimuli. Fourier coefficients were calculated after multiplying the EEG time series by the each of the response functions associated with each trial response function This corresponds to convolving the frequency spectra of the EEG data with the frequency spectra of the response functions (Srinivasan et al., 1999) which accurately recovers the spectrum in each condition if the response function faithfully reflects the changes in perceptual state. The power spectrum at each frequency fn at each channel m was calculated as:
| (1) |
At each frequency, the signal-to-noise ratio (SNR) at each channel was calculated as the ratio of the power at the stimulus flicker frequency and average power of 10 surrounding bins (Δf ~ 0.03 Hz):
| (2) |
The SNR of SSVEP signals is a measure of synchronization within a narrow frequency band surrounding the flicker frequency, in this case Δf ~ 0.003 Hz. As discussed extensively in previous SSVEP studies of binocular rivalry (Srinivasan et al., 1999; Srinivasan, 2004) and spatial attention (Ding et al., 2006), SSVEPs depend on both the amplitude and phase-locking of synaptic activity within this frequency band. In studies of binocular rivalry, episodic changes of conscious perception from second to second result in measurable modulations of the SSVEP. In addition to the general SSVEP mechanisms of amplitude gain and phase-locking, these modulations also reflect the consistency in amplitude and phase modulation across the episodes of perceptual dominance/nondominance.
For each flicker frequency, we generated four sets of data, labeled as Seen MO, Unseen MO, Seen IO, or Unseen IO. The labeling of the EEG data depends on observers’ reported percepts – with each report of dominant, seen MO or IO stimulus, there is a corresponding suppressed, unseen MO or IO stimulus. For example, in Figure 1A, if the red gratings in the left eye were presented at 8 Hz and the observer reported seeing downward arrows, that segment of the 8 Hz EEG time series would be labeled as Seen MO. In the meantime, the red gratings in the right eye would be presented at 11 Hz, and thus the same time segment in the 11 Hz EEG time series would be labeled as Unseen MO. Conversely, if the observer reported seeing upward arrows, the labeling is reversed.
We normalized each SNR by the mean SNR across channels and then averaged the response at four flicker frequencies and then averaged across visual fields. For the nonlinear combination response data, SNR data were averaged over MO (8 + 12 = 19.9 Hz, and 9 + 11 = 20.1 Hz) or IO (8 + 11 = 18.9 Hz, and 9 + 12 = 21.2 Hz) combination frequencies. Combination responses for 8 + 9 Hz, and 11 + 12 Hz signals were not observed and thus not included in the analysis.
Statistical Analysis
We constructed 95% confidence intervals on estimated distributions of log(SNR) and log(SNR) differences between conditions by conducting a permutation test: observer responses were randomly paired with EEG data recordings within the set of 16 trials. Fourier coefficients, power spectra, and SNR were calculated using the same data analysis method. For each channel, we collected 5000 permutation samples to estimate a distribution of log(SNR) difference. Log(SNR) differences were considered significant at the 0.05% level if the difference was outside the 95% confidence interval on the mean difference. We only accepted significant results when more than 5% of channels (i.e., 6 channels) showed a significant effect.
Acknowledgments
This research was supported by a grant from the NIH R01-MH68004. The authors wish to thank Prof. Charles Chubb and Prof. Emily Grossman of the Department of Cognitive Sciences at UC Irvine for many useful comments. We also want to thank one of the reviewers for guiding us to the relevant history of research into the phenomena of interocular grouping.
Footnotes
Publisher's Disclaimer: This is a PDF file of an unedited manuscript that has been accepted for publication. As a service to our customers we are providing this early version of the manuscript. The manuscript will undergo copyediting, typesetting, and review of the resulting proof before it is published in its final citable form. Please note that during the production process errors may be discovered which could affect the content, and all legal disclaimers that apply to the journal pertain.
References
- Alais D, O’Shea RP, Mesana-Alais C, Wilson IG. On binocular alternation. Perception. 2000;29:1437–1445. doi: 10.1068/p3017. [DOI] [PubMed] [Google Scholar]
- Blake R, Logothetis NK. Visual Competition. Nature Reviews Neuroscience. 2002;3:13–21. doi: 10.1038/nrn701. [DOI] [PubMed] [Google Scholar]
- Bonneh Y, Sagi D, Karni A. A transition between eye and object rivalry determined by stimulus coherence. Vision Research. 2001;41:981–9. doi: 10.1016/s0042-6989(01)00013-x. [DOI] [PubMed] [Google Scholar]
- Brown RJ, Norcia AM. A method for investigating binocular rivalry in real-time with the steady-state VEP. Vision Research. 1997;170:2401–8. doi: 10.1016/s0042-6989(97)00045-x. [DOI] [PubMed] [Google Scholar]
- Brainard DH. The psychophysics toolbox. Spatial Vision. 1997;10:433–436. [PubMed] [Google Scholar]
- Cobb WA, Morton HB. Cerebral potentials evoked by pattern reversal and their suppression in visual rivalry. Nature. 1967;216:1123–1125. doi: 10.1038/2161123b0. [DOI] [PubMed] [Google Scholar]
- Ding J, Sperling G, Srinivasan R. Attentional modulation of SSVEP power depends on the network tagged by the flicker frequency. Cerebral Cortex. 2006;16:1016–29. doi: 10.1093/cercor/bhj044. [DOI] [PMC free article] [PubMed] [Google Scholar]
- Fries P, Roelfsema PR, Engel AK, Konig P, Singer W. Synchronization of oscillatory responses in visual cortex correlates with perception in interocular rivalry. Proceedings of the National Academy of Sciences of the United States of America. 1997;94:12699–12704. doi: 10.1073/pnas.94.23.12699. [DOI] [PMC free article] [PubMed] [Google Scholar]
- Fries P, Schröder J-H, Roelfsema PR, Singer W, Engel AK. Oscillatory neuronal synchronization in primary visual cortex as a correlate of stimulus selection. The Journal of Neuroscience. 2002;22:3739–3754. doi: 10.1523/JNEUROSCI.22-09-03739.2002. [DOI] [PMC free article] [PubMed] [Google Scholar]
- Koernbach C, Schroger E, Jacobsen T, Roeber U. Effects of consciousness on human brain waves following binocular rivalry. NeuroReport. 1999;10:713–716. doi: 10.1097/00001756-199903170-00010. [DOI] [PubMed] [Google Scholar]
- Kovacs I, Papathomas TV, Yang M, Feher A. When the brain changes its mind: Interocular grouping during binocular rivalry. Proceedings of the National Academy of Sciences of the United States of America. 1996;93:15508–15511. doi: 10.1073/pnas.93.26.15508. [DOI] [PMC free article] [PubMed] [Google Scholar]
- Lansing RW. Electroencephalographic correlates of binocular rivalry in man. Science. 1964;146:1325–1327. doi: 10.1126/science.146.3649.1325. [DOI] [PubMed] [Google Scholar]
- Lee S-H, Blake R. Rival ideas about binocular rivalry. Vision Research. 1999;39:1447–1454. doi: 10.1016/s0042-6989(98)00269-7. [DOI] [PubMed] [Google Scholar]
- Lee S-H, Blake R. A fresh look at interocular grouping during binocular rivalry. Vision Research. 2004;44:983–991. doi: 10.1016/j.visres.2003.12.007. [DOI] [PubMed] [Google Scholar]
- Leopold DA, Logothetis NK. Activity changes in early visual cortex reflect monkeys’ percepts during binocular rivalry. Nature. 1996;379:549–553. doi: 10.1038/379549a0. [DOI] [PubMed] [Google Scholar]
- Logothetis NK, Leopold DA, Sheinberg DL. What is rivaling during binocular rivalry? Nature. 1996;380:621–624. doi: 10.1038/380621a0. [DOI] [PubMed] [Google Scholar]
- Lumer ED, Friston KJ, Rees G. Neural correlates of perceptual rivalry in the brain. Science. 1998;280:1930–1934. doi: 10.1126/science.280.5371.1930. [DOI] [PubMed] [Google Scholar]
- O’Shea R, Crassini B. Binocular rivalry occurs without simultaneous presentation of rival stimuli. Percept Psychophys. 1984;36:266–276. doi: 10.3758/bf03206368. [DOI] [PubMed] [Google Scholar]
- Polonsky A, Blake R, Braun J, Heeger DJ. Neuronal activity in human primary visual cortex correlates with perception during binocular rivalry. Nature. 2000;3:1153–1159. doi: 10.1038/80676. [DOI] [PubMed] [Google Scholar]
- Regan MP, Regan D. A frequency domain technique for characterizing nonlinearities in biological systems. Journal of Theoretical Biology. 1988;133:293–317. [Google Scholar]
- Roeber U, Schroger E. Binocular rivalry is partly resolved at early processing stages with steady and flickering presentation: a human event-related potential study. Neuroscience Letters. 2004;371:51–55. doi: 10.1016/j.neulet.2004.08.038. [DOI] [PubMed] [Google Scholar]
- Sheinberg DL, Logothetis NK. The role of temporal cortical areas in perceptual organization. Proceedings of the National Academy of Sciences of the United States of America. 1997;94:3408–3413. doi: 10.1073/pnas.94.7.3408. [DOI] [PMC free article] [PubMed] [Google Scholar]
- Srinivasan R, Russell DP, Edelman GM, Tononi G. Increased synchronization of neuromagnetic responses during conscious perception. The Journal of Neuroscience. 1999;19:5435–5448. doi: 10.1523/JNEUROSCI.19-13-05435.1999. [DOI] [PMC free article] [PubMed] [Google Scholar]
- Srinivasan R. Internal and external neural synchronization during conscious perception. International Journal of Bifurcation and Chaos. 2004;14:825–842. doi: 10.1142/S0218127404009399. [DOI] [PMC free article] [PubMed] [Google Scholar]
- Srinivasan R, Petrovic S. MEG phase follows conscious perception during binocular rivalry induced by visual stream segregation. Cerebral Cortex. 2006;5:597–608. doi: 10.1093/cercor/bhj016. [DOI] [PMC free article] [PubMed] [Google Scholar]
- Tononi G, Srinivasan R, Russell DP, Edelman GM. Investigating neural correlates of conscious perception by frequency tagged neuromagnetic responses. Proc Natl Acad Sci. 1998;95:3198–3203. doi: 10.1073/pnas.95.6.3198. [DOI] [PMC free article] [PubMed] [Google Scholar]
- Tong F, Nakayama K, Vaughan JT, Kanwisher N. Binocular rivalry and visual awareness in human extrastriate cortex. Neuron. 1998;21:753–759. doi: 10.1016/s0896-6273(00)80592-9. [DOI] [PubMed] [Google Scholar]
- Tucker DM. Spatial sampling of head electrical fields: the geodesic sensor net. Electroencephalography and Clinical Neurophysiology. 1993;87:154–163. doi: 10.1016/0013-4694(93)90121-b. [DOI] [PubMed] [Google Scholar]
- van Dam van EE. Retinal image shifts, but not eye movements per se, cause alternations in awareness during binocular rivalry. Journal of Vision. 2006;6:1172–1179. doi: 10.1167/6.11.3. [DOI] [PubMed] [Google Scholar]
- van de Grind WA, Grusser OJ, Lunkenheimer HU. Temporal transfer properties of the afferent visual system: Psychophysical, neurophysiological, and theoretical investigations. In: Jung R, editor. Handbook of sensory physiology. 1973. pp. 431–573. [Google Scholar]
- Wade NJ. Contour synchrony in binocular rivalry. Perception and Psychophysics. 1973;13:423–425. [Google Scholar]
- Wilson HR. Computational evidence for a rivalry hierarchy in vision. Proceedings of the National Academy of the Sciences. 2003;100:14499–14503. doi: 10.1073/pnas.2333622100. [DOI] [PMC free article] [PubMed] [Google Scholar]
- Zemon V, Ratliff F. Intermodulation components of the visual evoked potential: responses to lateral and superimposed stimuli. Biological Cybernetics. 1984;50:401–8. doi: 10.1007/BF00335197. [DOI] [PubMed] [Google Scholar]


