Abstract
Genotoxic agents such as ionizing radiation trigger cell cycle arrest at the G1/S and G2/M checkpoints, allowing cells to repair damaged DNA before entry into mitosis. DNA damage-induced G1 arrest involves p53-dependent expression of p21 (Cip1/Waf-1), which inhibits cyclin-dependent kinases and blocks S phase entry. While much of the core DNA damage response has been well-studied, other signaling proteins that intersect with and modulate this response remain uncharacterized. In this study, we identify Suppressor of Cytokine Signaling (SOCS)-3 as an important regulator of radiation-induced G1 arrest. SOCS3-deficient fibroblasts fail to undergo G1 arrest and accumulate in the G2/M phase of the cell cycle. SOCS3 knockout cells phosphorylate p53 and H2AX normally in response to radiation, but fail to upregulate p21 expression. In addition, STAT3 phosphorylation is elevated in SOCS3-deficient cells compared to WT cells. Normal G1 arrest can be restored in SOCS3 KO cells by retroviral transduction of WT SOCS3 or a dominant-negative mutant of STAT3. Our results suggest a novel function for SOCS3 in the control of genome stability by negatively regulating STAT3-dependent radioresistant DNA synthesis, and promoting p53-dependent p21 expression.
Keywords: SOCS3, Cell cycle, Signaling, p21, STAT3, DNA damage
1. Introduction
The suppressors of cytokine signaling (SOCS) are a large family of proteins that were initially identified as inhibitors of Janus (Jak) kinase signaling in response to cytokine stimulation. A subfamily of these genes, which includes well-characterized members such as SOCS1 and SOCS3, are induced by the signal transducers and activators of transcription (STATs), and function to block Jak–STAT signaling and cytokine-driven proliferation [1–3]. While SOCS are generally considered part of a negative feedback loop that act as STAT-induced STAT inhibitors, it has become clear that they have unexpected effects beyond the STAT signaling pathway and can regulate fundamental processes such as inflammation, T cell development, embryonic development and gliosis after spinal cord injury [4–18]. DNA damaging agents such as ionizing radiation activate a rapid biochemical response pathway so as to prevent DNA synthesis in cells containing DNA damage in order to preserve genome integrity. The DNA damage response is a fundamental process, as mutations in the pathway result in increased sensitivity to DNA replication errors, defects in immune function, and increased risk of cancer [19–22]. There are two major cell cycle targets of the DNA damage response, namely the G1/S and G2/M checkpoints. Damaged DNA triggers a genetic program that stalls a cell at one of these major checkpoints until damage is repaired or the cells undergo apoptosis. This response is complex, but the best characterized component of the DNA damage response involves proximal activation of the Ataxia Telangiectasia Mutated (ATM) serine/threonine kinase, p53 protein stabilization and the transcriptional activation of p53-dependent genes [23]. Distinct cell cycle-related proteins are responsible for the G1/S and G2/M arrest. In particular, p21 (Waf-1), a p53 target gene that is induced by ionizing radiation (IR) binds to CDK4/cyclinD and CDK6/cyclinD complexes and inhibits the G1–S transition. Targeted mutation of the p21 gene results in late-onset cancers in mice and loss of G1 arrest in cells exposed to DNA damaging agents [24–27].
While the DNA damage response pathway is critical in managing genotoxic stress, the outcome of the response is highly dependent on cellular context. Clearly, other signaling pathways activated in the cell at the time of DNA damage can modulate the response and alter the output of DNA damage-induced signal transduction. Multiple mutations in tumor cells cause resistance to IR-induced cell cycle arrest and apoptosis, thereby decreasing the effectiveness of radiotherapy [19–22]. Likewise, abnormal activation of survival, growth and proliferative signaling pathways can interfere with the DNA damage response, as many of these pathways instruct the cell to proliferate even in the presence of DNA lesions [28–31].
The Jak–STAT pathway is often mutated or aberrantly activated in multiple tumors, and correlates with increased proliferation and tumor aggressiveness [30,31]. STAT signaling is known to induce the expression of multiple genes that can antagonize the p53-dependent component of the DNA damage response, such as Bcl-2, Bcl-xL, cyclin D1, the ser/thr kinase Pim-1, and the transcription factor c-Myc, among others [30,31]. Although SOCS proteins are known to regulate signaling pathways (including STATs) that impact the radiation response, until recently there have been no studies demonstrating a correlation between SOCS expression and radiosensitivity.
Our laboratory has recently found that SOCS3 has a radioprotective effect, as SOCS3-deficient fibroblasts display enhanced sensitivity to DNA damaging agents in a clonogenic survival assay [32]. In the present study, we have identified a molecular link between SOCS3 expression and the DNA damage response. We demonstrate that SOCS3-deficient cells fail to undergo G1 cell cycle arrest in response to radiation. Further, we demonstrate that this defect is likely due to uncontrolled STAT3 signaling in irradiated cells, which results in repression of p21 gene expression. These findings have implications for the regulation of radiation responses in both normal tissues and tumor cells, and suggest that targeting the STAT3-SOCS3 signaling loop may effectively modulate radiation responses clinically.
2. Materials and methods
2.1. Cell culture
The MEF cell lines were described previously [32,33] and were maintained at 37 °C and 5% CO2 in Dulbecco’s modified Eagle’s medium (Mediatech, Herndon, VA) supplemented with 10% FBS (Omega Scientific, Tarzana, CA), L-glutamine and penicillin/streptomycin (Mediatech).
2.2. Radiation treatments
Exponentially growing cells were treated with a 10 Gy dose of ionizing irradiation from a 137Cs source. Plates were given a 5 Gy dose, then rotated 180° and treated with the remaining 5 Gy.
2.3. Cell cycle analysis
Irradiated cells were harvested at the indicated times by trypsinization, washed in cold PSB (BioWhittaker, Walkersville, MD), and pelleted by centrifugation. The supernatant was aspirated and the cells resuspended in 500 μl ice cold PBS. To fix the cells, 500 μl ice cold ethanol (Pharmco, Brookfield, CT) was added to the each sample, while vortexing. The fixed cells were held in this solution at −20 °C for 20 min or until needed. The fixed cells were pelleted by centrifugation, washed once with cold PBS, and resuspended in PBS with 5 μg/ml propidium iodide (PI) (Gibco, Carlsbad, CA) and 1 μg/ml RNase (Qiagen, Valencia, CA) at an appropriate concentration for flow cytometry. Prepared cells were shielded from light and immediately analyzed by flow cytometry on a FACSCaliber instrument utilizing Cell Quest software.
2.4. Retroviral-mediated gene transduction
C-terminally FLAG tagged SOCS3 cloned into the retroviral expression vector pMX-IRES-GFP has been described previously [4]. To stably infect the wild-type and SOCS3 KO MEF cell lines, lines PlatE cells were transfected with the SOCS3 retroviral plasmid using the Effectene lipid-based transfection reagent (Qiagen). At 48, 72, and 96 h after transfection 5 ml of supernatant were harvested from the PlatE cells and filtered to remove any cells. The virus containing media was then mixed with polybrene (8 mg/ml final concentration) (Sigma, St. Louis, MO) and added directly to the cells. 48 h after the final infection, the target cells were washed and cultured normally. Cells were sorted by flow cytometry to select the GFP expressing population.
2.5. RT-PCR
Primers were custom ordered from Invitrogen (Carlsbad, CA) and reconstituted in sterile water to provide a 0.2 mM working concentration. Primers were designed with the Invitrogen OligoPerfect Designer to amplify a 150–200 base pair internal sequence for each target. Individual sequences are available upon request. Radiation treated cells were harvested by washing with PBS and adding Trizol (Invitrogen) directly to the culture plate. The standard Trizol protocol was followed as indicated by the supplier. Superscript III (Invitrogen) was used to perform the reverse transcription using oligo dT and random hexamer (Invitrogen). The cDNA was subjected to standard PCR techniques using the Taq enzyme (New England Biolabs) and dNTPs from Invitrogen. Reactions were analyzed on a 2% agarose gel. The primer sequences used in this study are as follows: p53 fwd 5′-GCGTAAACGCTTCGAGATGT-3′; p53 rev 5′-TATGGCGGGAAGTAGACTGG-3′; Cyclin E fwd 5′-CCATTGCCTCCAAAGACAGT-3′; Cyclin E rev 5′-CACTTCCATCCAAGGCATCT-3′; p27 fwd 5′-TTGCGGGTCTCAGGCAAACTCT-3′; p27 rev 5′-TCTGTTCTGTTGGCCCTTTT-3′; PI3K p55 fwd 5′-GCTTGTTCTGTGGTTGCAGA-3′; PI3K p55 rev 5′-GTGCTGAACCAGGGATGTCT-3′; PI3K p50_ fwd 5′-CAAAGCGGAGAACCTATTGC-3′; PI3K p50_ rev 5′-CCGGTGGCAGTCTTGTTAAT-3′; p21 fwd 5′-GTACTTCCTCTGCCCTGCTG-3′; p21 rev 5′-AATCTGTCAGGCTGGTCTGC-3′; Cyclin D1 fwd 5′-CACAACGCACTTTCTTTCCA-3′; Cyclin D1 rev 5′-ACCAGCCTCTTCCTCCACTT-3′; Cyclin B fwd 5′-TGGACTACGACATGGTGCAT-3′; Cyclin B rev 5′-CAGGTGCTGCATAACAGGAA-3′; BAX fwd 5′-TGCAGAGGATGAATTGCTGAC-3′; BAX rev 5′-GATCAGCTCGGGCACTTTAG-3′; Bcl-2 fwd 5′-GGTGGTGGAGGAACTCTTCA-3′; Bcl-2 rev 5′-ATGCCGGTTCAGGTACTCAG-3′; Bcl-xl fwd 5′-TTCGGGATGGAGTAAACTGG-3′; Bcl-xl rev 5′-TGGATCCAAGGCTCTAGGTG-3′; Cyclin A fwd 5′-CTTGGCTGCACCAACAGTAA-3′; Cyclin A rev 5′-AGCAATGAGTGAAGGCAGGT-3′; c-Myc fwd 5′-CAACGTCTTGGAACGTCAGA-3′; c-Myc rev 5′-TCGTCTGCTTGAATGGACAG-3′; Pim-1 fwd 5′-GATCATCAAGGGCCAAGTGT-3′; Pim-1 rev 5′-GATGGTTCCGGATTTCTTCA-3′; IL-6 fwd 5′-TCCTTCCTACCCCAATTTCC-3′; IL-6 rev 5′-CGCACTAGGTTTGCCGAGTA-3′; 14-3-3_ fwd 5′-TGGCCCTGAACTTTTCAGTC-3′; 14-3-3_ rev 5′-GATGAGGGTGCTGTCCTTGT-3′; GADD45 fwd 5′-TGAGCTGCTGCTACTGGAGA-3′; GADD45 rev 5′-TCCCGGCAAAAACAAATAAG-3′.
2.6. Western blots, immunoprecipitation, and SDS-PAGE
Approximately 1×10⁷ cells were irradiated and harvested at the indicated times by direct addition of ice cold lysis buffer containing 150 mM NaCl, 50 mM Tris–HCl, 2 mM EDTA, 0.875% Brij 97 (Sigma), 0.125% Nonidet P-40 (British Drug Houses, Poole, UK),10 μg/ml aprotinin (ICN, Aurora, OH),10 μg/ml leupeptin (ICN),1 mM phenylmethylsulfonyl fluoride (PMSF) (Sigma), and 1 mM Na3VO4 (Sigma). Cells were lysed for 10 min on ice before centrifuging at 12,000 ×g for 5 min at 4 °C to remove nuclei. Whole cell lysates were prepared by the addition of sample buffer and boiling for 5 min. STAT3 immunoprecipitations were made by adding polyclonal anti-STAT3 antibodies (Santa Cruz Biotechnology, Santa Cruz, CA) and protein A-Sepharose beads (Sigma). Samples were bound at 4 °C with gentle agitation for 4 h before being washed 3 times in ice cold PBS. Laemmli Sample Buffer (BioRad, Hercules, CA) containing 50 μl/ml β-mercaptoethanol (BioRad) was then added directly to the beads and boiled as above.
Proteins were resolved by SDS-PAGE and transferred to PVDF membranes (Millipore, Bradford, MA). The membranes were probed with appropriate antibodies diluted 1:1000 in PBS plus 0.1% Tween-20 and 3% BSA (Sigma). Primary antibodies were bound at room temperature for 2 h with gentle shaking, washed 3 times with PBS-Tween 20, 10 min each, and probed with a 1:5000 dilution of either horseradish peroxidase-labeled anti-mouse or anti-rabbit secondary antibodies (Amersham Biosciences, Buckinghamshire, UK) as appropriate. After washing, the proteins were detected by the chemiluminescent substrate WesternDura (Pierce, Rockford, IL) and film (Deneville, Metuchen, NJ). The antibodies used in this study were: rabbit anti-pY705 STAT3, rabbit anti-STAT3, rabbit anti-pS727 STAT1, rabbit anti-p21, rabbit anti-pT308 Akt, mouse anti-pErk (Santa Cruz) and rabbit anti-pS15 p53, rabbit anti-p53 (Cell Signaling Technology, Boston, MA).
2.7. Flow cytometry
2.7.1. Annexin V staining
Treated cells were detached from the plate with versene (Gibco, Carlsbad, CA), pelleted and resuspended in a solution of 10 mM Hepes (pH 7.4),140 mM NaCl, 2.5 mM CaCl2 (Sigma) plus a 1:20 dilution of FITC conjugated Annexin V (BD Biosciences, San Jose, CA) and 5 μg/ml propidium iodide (PI) (Gibco). Cells were incubated at room temperature for 15 min in the dark, then diluted in 300 μl of the same solution without Annexin V or PI. Cells were immediately analyzed by flow cytometry.
2.7.2. H2AX staining
Exponentially growing cells were irradiated and harvested by trypsinization after 45 min. These cells were washed and resuspended in cold PBS. An equal amount of ice cold ethanol was added to the cells while vortexing and the cells were placed at −20 °C for 30 min. The fixed cells were pelleted and washed with Tris Buffered Saline (TBS) [6.05 g Tris and 8.76 g NaCl in 1 l H2O, pH 7.5 (Sigma)]. TBS containing 0.4% FBS (Omega Scientific) and 0.1% Triton-X (Sigma) was added and the cells were incubated for 10 min and room temperature. FITC coupled anti-H2AX antibody (Upstate, Lake Placid, NY) was added at a dilution of 1:15 as directed by the manufacturer. The cells were then incubated in the dark at room temperature with gentle agitation for 2 h. Cells were then resuspended in TBS for analysis by flow cytometry.
2.7.3. Statistical analysis
Results of RT-PCR and western blotting were quantitated by densitometry and data from at least three replicate experiments was analyzed by student’s t-test to determine statistical significance.
3. Results
3.1. Defective cell cycle arrest in SOCS3-deficient cells after irradiation
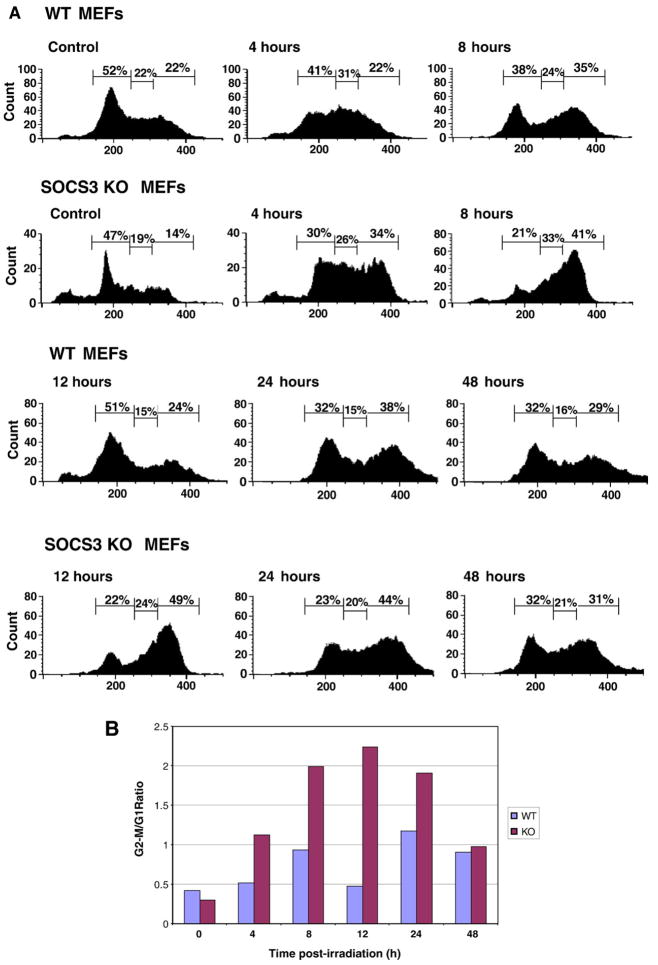
In a previous study, our laboratory determined that SOCS3 has a radioprotective effect, as SOCS3+ cells display greater viability in a clonogenic survival assay after exposure to ionizing radiation than SOCS3-deficient cells [32]. In order to further explore the mechanism of SOCS3-mediated radioprotection, we investigated proximal events in the DNA damage response, comparing murine embryonic fibroblasts (MEFs) from wild-type (WT) and SOCS3-knockout mice. We examined both radiation-induced cell cycle arrest and apoptosis. In Fig. 1A, MEFs were exposed to 10 Gy ionizing radiation, and DNA content was determined by measuring propidium iodide uptake. Exposure of WT MEFs to ionizing radiation resulted in cell cycle arrest in the G1 and G2/M phases. We observed the accumulation of cells in G1 and G2–M at the 6 hour time point, and the arrest continued through the 24 hour time point (Fig. 1A). At 48 hour post-irradiation, the cell cycle profile re-distributed to resemble unirradiated cells, due to recovery from DNA damage, and resumption of normal cell cycle progression. However, we observed that G1 arrest in SOCS3-deficient cells was markedly impaired. At 8 and 12 hour post-irradiation, the percentage of WT cells in G1 arrest was 38% and 51%, whereas the percentage of SOCS3 KO cells in G1 arrest was 21% and 22%, respectively. In addition, we also observed preferential G2/M accumulation of SOCS3-deficient cells compared to WT MEFs following radiation. The percentage of cells in G2/M arrest at the 8 and 12 hour time points was 35% and 24% for WT cells, and 41% and 49% in SOCS3-deficient MEFs.
Fig. 1.
SOCS3-deficient cells fail to undergo GI arrest in response to DNA damage. Panel A. Approximately 1×10⁷ murine embryonic fibroblasts (MEFs) from WT or SOCS3 knockout mice were exposed to 10 Gy ionizing radiation and DNA content was determined by propidium iodide staining, as described in the Materials and methods. Cell cycle analysis was performed in unirradiated cells and at the indicated time points after irradiation, up to 48 h. Panel B. The data in Panel A are expressed as the ratio of cells in G2/M:G1 after irradiation in WT  or SOCS3-deficient
  cells.
The ratio of cells in G2/M:G1 in irradiated versus unirradiated cells is shown in Fig. 1B, and shows that G1 arrest SOCS3-deficient cells was markedly impaired, with most cells accumulating in the G2/M phase. This effect was most pronounced between 8 and 24 hour post-irradiation. Whereas the G2/M:G1 ratio was between 0.5 and 1.0 in irradiated WT cells, it ranged from 1.9–2.2 in irradiated SOCS3 KO cells at the 8, 12, and 24 hour time points, suggesting that the G1 arrest component of the DNA damage response was defective in SOCS3-deficient MEFs.
3.2. Normal levels of radiation-induced apoptosis in SOCS3-deficient MEFs
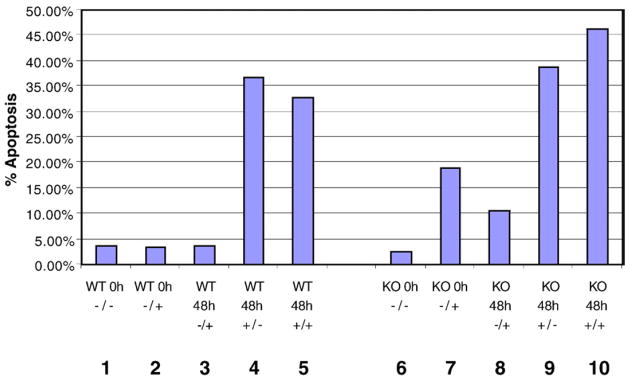
We also analyzed apoptosis in irradiated MEFs by measuring Annexin V staining 48 h after irradiation. As shown in Fig. 2, unirradiated WT and SOCS3 KO MEFs showed a basal level of 2–3% apoptotic cells (columns 1 and 6). Forty-eight hours after irradiation, we did not observe a significant difference in the levels of cell death, as both cell lines were 36%–38% apoptotic. As a control, we measured apoptosis in cells treated with leukemia inhibitory factor (LIF). In a previous study, it was shown that LIF-dependent signaling was altered from anti-apoptotic to pro-apoptotic in SOCS3-deficient MEFs [33]. In agreement with the previous study, we observed significant apoptosis (19%) in LIFtreated SOCS3 KO cells, but no increase in apoptosis of WT MEFs following LIF stimulation (compare columns 2 and 7).
Fig. 2.
SOCS3-deficient MEFs undergo radiation-induced apoptosis to the same extent as WT MEFs. WT and SOCS3 knockout MEFs were treated with 10 Gy ionizing radiation alone or in combination with 50 ng/ml leukemia inhibitory factor (LIF), and cells were analyzed by flow cytometry for Annexin V reactivity and propidium iodide uptake at the indicated time points. The treatments are labeled as LIF/radiation below each column. As a control, WT and SOCS3-deficient MEFS were also treated with LIF alone.
3.3. SOCS3 regulates p21 expression in irradiated cells
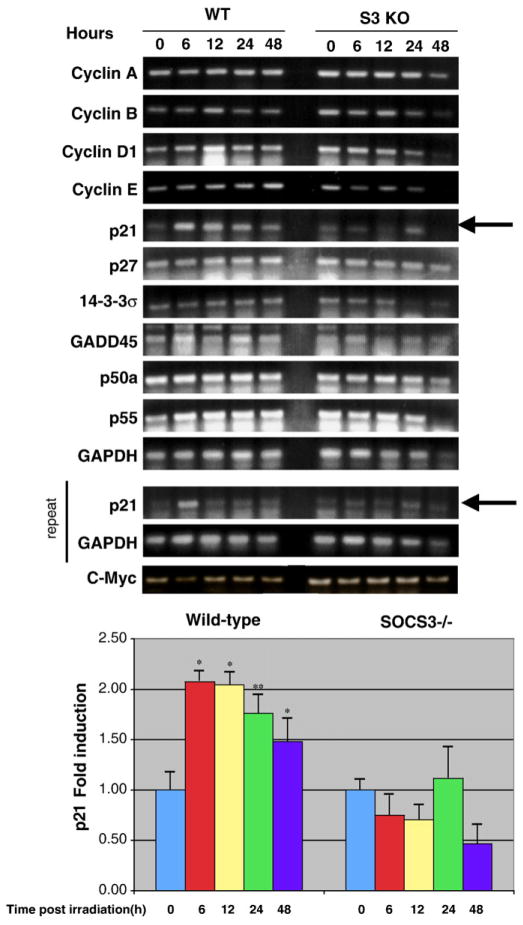
We next explored potential mechanisms of the altered cell cycle arrest profile we observed in SOCS3-deficient MEFs. One of the major events in the DNA damage response is transcriptional activation of p53-induced genes. We analyzed the expression of p53-dependent genes known to be involved in DNA damage-induced cell cycle arrest in WT and SOCS3 KO MEFs. We also determined the mRNA levels of cyclin genes that we reasoned might be altered in SOCS3 KO cells. We performed RT-PCR on RNA isolated from WT and SOCS3-deficient MEFs over a 48 hour time course following radiation. As shown in Fig. 3, p21 (Waf-1), a p53-dependent gene known to be important in cell cycle arrest, was markedly induced in WT MEFs following irradiation. In contrast, p21 was not upregulated in SOCS3 KO MEFs, suggesting that dysregulation of p21 gene induction may be a factor in the G1 arrest defect. Other cell cycle arrest genes, such as p27 and 14-3-3σ were not affected by the SOCS3 mutation. Moreover, we did not observe any significant differences in the expression of cyclins A, B, D1, and E between WT and SOCS3 KO MEFs.
Fig. 3.
SOCS3-deficient cells fail to upregulate p21 mRNA after irradiation. Approximately 1×10⁷ WT or SOCS3 knockout MEFs were irradiated as described in Fig. 1. Messenger RNA was isolated at the indicated time points and mRNA levels for several cyclin and p53-dependent genes were determined by reverse transcription-polymerase chain reaction (RT-PCR). Results were quantitated by densitometry and are expressed as mean±SEM. Statistical analysis was performed using the Students t-test. *p<0.01, **p <0.05, n=3.
3.4. Constitutive STAT3 and STAT1 phosphorylation in SOCS3-deficient MEFs
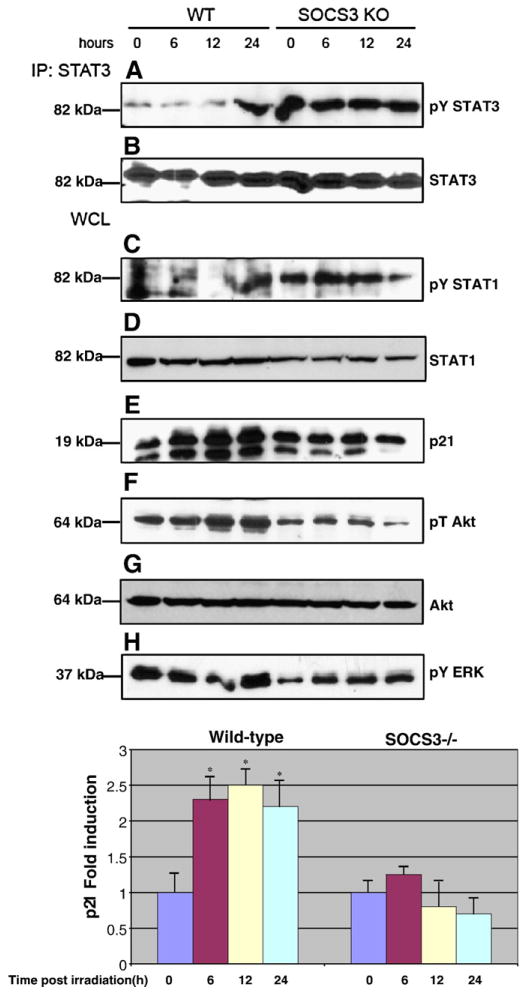
We next characterized the cells for signaling abnormalities and induction of p21 protein in response to radiation. In previous studies, it was demonstrated that genetic ablation of SOCS3 results in abnormally high levels of STAT1 and STAT3 tyrosine phosphorylation [12–14,33]. In addition, a recent study showed that SOCS3-deficient cells display impaired Akt activation in response to cytokine stimulation [33]. As shown in Fig. 4, we also observe these signaling defects in irradiated cells. WT MEFs induced STAT1 and STAT3 phosphorylation late in the radiation response, at 24 h after exposure to 10 Gy. In contrast, STAT1 and STAT3 phosphorylation were constitutive in SOCS3 KO MEFs. Furthermore, Akt phosphorylation was impaired in SOCS3 KO MEFs compared to WT MEFs. In agreement with our RT-PCR data, we observed induction of p21 protein in WT MEFs following irradiation, but p21 failed to be induced in SOCS3 KO cells in response to radiation.
Fig. 4.
SOCS3-deficient cells display altered phosphorylation of STATs and Akt, and reduced p21 protein expression compared to WT cells. Approximately 1×10⁷ WT or SOCS3-deficient MEFs were irradiated as in Fig. 1, and protein extracts were analyzed by Western blotting either directly (bottom 4 panels) or after immunoprecipitation with an anti-STAT3 antibody (top two panels). Extracts were analyzed for phosphorylated STAT3 (panel A), phosphorylated STAT1 (panel C), p21 (panel E), phospho-Akt (panel F), or phospho-ERK (panel H). P21 results were quantitated by densitometry and are expressed as mean±SEM. Statistical analysis was performed using the Students t-test. *p<0.01, n=3.
3.5. SOCS3 deficiency does not affect p53 or H2AX phosphorylation
In a recent study, STAT3 was shown to regulate p53-dependent responses by binding to the p53 promoter and repressing p53 gene expression [34]. Thus, we reasoned that lack of p21 gene induction in SOCS3 KO cells might result from STAT3-dependent p53 gene repression. In order to address this issue, we determined p53 phosphorylation and p53 protein expression levels in WT and SOCS3-deficient MEFs, before and after radiation. As shown in Fig. 5A, we did not observe any differences in p53 expression levels between WT and SOCS3 KO MEFs. Furthermore, the magnitude and kinetics of radiation-dependent p53 phosphorylation were similar in both cell types. We also analyzed another marker of early events in the DNA damage response, histone H2AX phosphorylation [35,36]. After irradiation, cells were fixed and stained with a phospho-H2AX antibody and analyzed by flow cytometry. Fig. 5B shows the ratio of H2AX staining (mean fluorescence intensity) in irradiated:unirradiated cells from WT and SOCS3 KO MEFs. In both cell types, we observed approximately two-fold induction of phospho-H2AX following radiation.
Fig. 5.
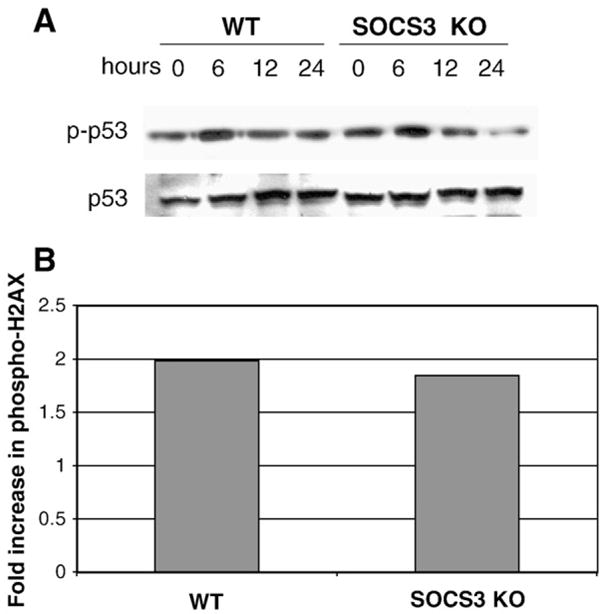
Proximal events in the DNA damage response are unaffected by SOCS3-deficiency. Approximately 1×10⁷ WT or SOCS3-deficient MEFs were irradiated as in Fig. 1. (Panel A) Protein extracts were processed at the indicated time points, followed by Western blotting for phosphorylated p53 (top panel) or total p53 protein (bottom panel). (Panel B) Irradiated cells were analyzed for phosphorylated H2AX by flow cytometry as described in the Materials and methods. Results are expressed as the fold increase in H2AX mean fluorescence intensity (MFI) in irradiated:unirradiated controls.
3.6. STAT3 is a major SOCS3 target in the DNA damage response
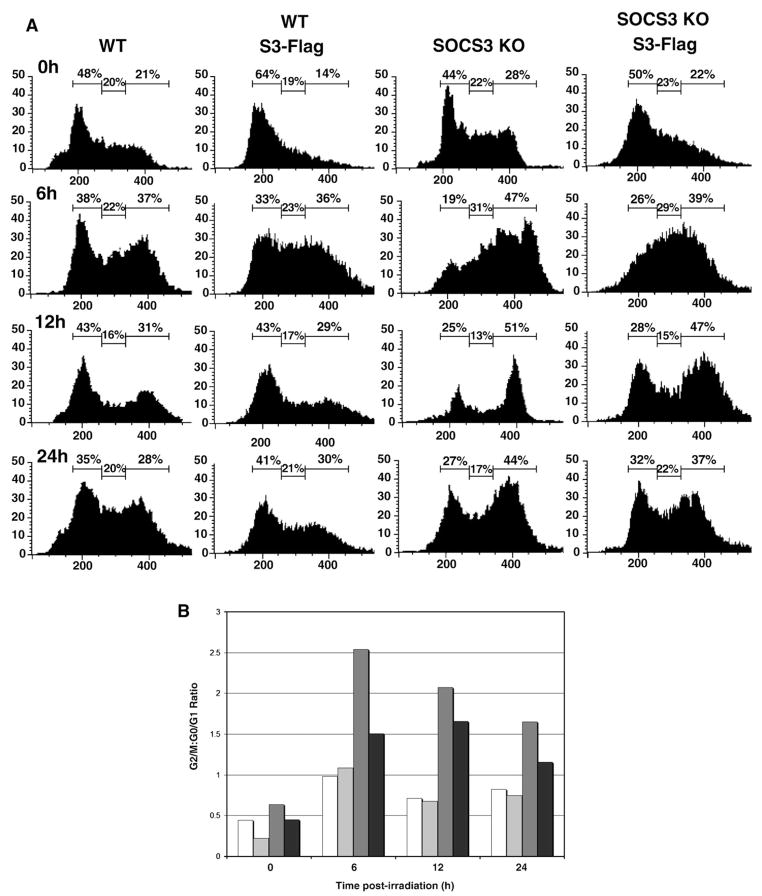
We next employed a genetic approach to identify the major factors responsible for the G1 arrest defect in SOCS3 KO cells. First, we reconstituted the SOCS3 KO MEFs with WT SOCS3 by retroviral gene transduction, and analyzed cell cycle arrest in response to radiation. As shown in Fig. 6A and B, re-introduction of WT SOCS3 into the KO MEFs partially rescued normal radiation-induced G1 arrest. At the 6 h, 12 h and 24 hour time points, the percentage of cells in G0/G1 was increased in reconstituted SOCS3 KO MEFs compared to the parental cell line in response to radiation. These results are presented graphically in Fig. 6B. At the 6, 12, and 24 hour time points, the G2/M:G1 ratio in SOCS3 KO/SOCS3 reconstituted cells was 2.47/1.5, 2.04/1.67, and 1.62/1.16 respectively, demonstrating rescue of G1 arrest in the reconstituted MEFs.
Fig. 6.
Reconstitution of SOCS3-deficient MEFs with WT SOCS3 restores G1 arrest. Panel A. WT and SOCS3-deficient MEFs were transduced with a retrovirus encoding WT SOCS3, as described in the Materials and methods and stable infectants were isolated by flow cytometry. Cells were irradiated and analyzed for DNA content by flow cytometry as in Fig. 1. Panel B. Results in Panel A were represented as G2/M:G1 ratio in WT MEFs □, WT expressing SOCS3 , SOCS3 KO
 , and SOCS3 KO reconstituted with SOCS3■.
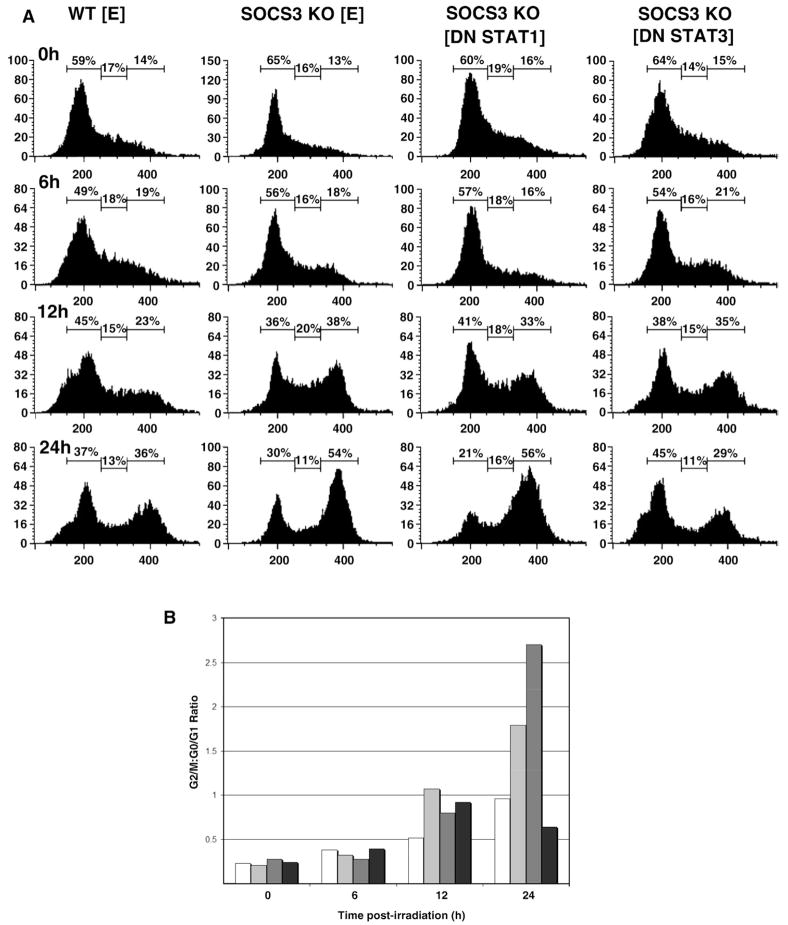
We were also interested in determining which SOCS3-regulated signaling pathways were involved in the DNA damage response. We performed cell cycle analysis of irradiated cells and compared G1 arrest in WT and SOCS3-deficient MEFs, as well as SOCS3 KO MEFs expressing dominant-negative (DN) mutants of STAT1 or STAT3. Data in Fig. 5 suggested that activated STAT1 and/or STAT3 might play a role in modulating G1 arrest in SOCS3−/− cells. Furthermore, a previous demonstrated that LIF-induced apoptosis in SOCS3−/− MEFs could be reversed by expressing DN STAT3 [33]. As shown in Fig. 7A and B, introduction of DN STAT3 reversed the G1 cell cycle arrest defect in the SOCS3 KO MEFs, in particular at the 24 hour time point. In Fig. 7B, the ratio of cells in G2/M:G0/G1 shows that 24 h after irradiation, SOCS3 KO MEFs failed to undergo G1 arrest, and this defect was even more pronounced in cells expressing DN STAT1. Strikingly, expression of DN STAT3 restored the G2/M:G0/G1 ratio to WT levels. At the 24 hour time point, the G2/M:G1 ratios for WT, SOCS3 KO, and DN STAT3 MEFs was 0.97, 1.8, and 0.64, respectively.
Fig. 7.
Expression of dominant-negative STAT3 in SOCS3-deficient MEFs restores radiation-induced GI arrest. Panel A. SOCS3-deficient MEFs were transduced with retrovirus encoding DN STAT1, DN STAT3 or a negative control vector [E], as described in the Materials and methods and stable infectants were isolated by flow cytometry. Cells were irradiated and analyzed for DNA content by flow cytometry as in Fig. 1. Panel B. Results in Panel A were represented as G2/M:G1 ratio in WT MEFs□, SOCS3 KO MEF , SOCS3 KO expressing DN STATI
 , and SOCS3 KO expressing DN STAT3■.
4. Discussion
In the present study, we have identified a novel function for SOCS3 in the regulation of the DNA damage response. SOCS3-deficient cells displayed a defect in radiation-induced cell cycle arrest. Specifically, SOCS3-deficient MEFs failed to undergo G1 arrest in response to ionizing radiation, continued through S phase, and accumulated at the G2/M checkpoint. In contrast, WT MEFs, in contrat arrested in both G1 and G2/M phase. We have examined the mechanism of dysregulated cell cycle arrest in SOCS3 KO cells. We have found that the most proximal events in the DNA damage response, namely p53 and H2AX phosphorylation were normal in SOCS3 KO MEFs, and the levels of p53 protein were unaffected by the SOCS3 mutation. However, SOCS3−/− cells failed to upregulate p21 (Waf-1) after DNA damage. The G1 arrest defect was partially reversed by expression of WT SOCS3, while expression of a dominant-negative STAT3 mutant completely restored G1 arrest in SOCS3-deficient fibroblasts. These data suggest that SOCS3 regulates p21 gene expression and cell cycle arrest primarily through its negative regulation of STAT3 signaling, and support a novel function for SOCS3 in the response to genotoxic stress. Our data suggest that SOCS3 controls the DNA damage response by inhibiting STAT3-dependent radio-resistant DNA synthesis and promoting DNA repair by supporting p21 expression and G1 arrest. Thus, SOCS3 supports cell cycle arrest by inhibiting p21 gene repression by STAT3. These findings may have implications for tumor biology and treatment, and may also impact on the effectiveness of anti-tumor radiotherapy.
Our study was aimed to identify the molecular basis of the radioprotective effect of SOCS3 that we observed in clonogenic survival assays [32]. We have found that SOCS3 has a highly specific effect on the DNA damage response. We observed that G1 arrest in SOCS3−/− MEFs was markedly impaired, with cells accumulating at the G2/M checkpoint, suggesting that G1 arrest was defective in the absence of SOCS3. As p53-mediated apoptosis is also a hallmark of the DNA damage response, we also analyzed radiation-induced cell death in WT and SOCS3−/− fibroblasts. Interestingly, we found that radiation-induced apoptosis was unaffected by the SOCS3 mutation. Thus, we conclude that SOCS3 has a specific role in the regulation of the DNA damage response, contributing to G1 arrest but is likely not involved in the control of radiation-induced G2/M arrest or apoptosis.
We confirmed our cell cycle analysis by examining radiation-induced gene expression, which also supported a role for SOCS3 in controlling G1 arrest. In a screen of several genes involved in either G1 or G2/M cell cycle arrest, we found that only the p21 gene was differentially regulated by radiation in WT and SOCS3−/− MEFs. Specifically, p21 mRNA increased after irradiation of WT cells but failed to be induced in SOCS3-deficient cells. These data suggest that SOCS3 supports DNA damage-induced cell cycle arrest by promoting p21 gene induction.
We did not observe differences in the regulation of p53-inducible genes that regulate G2/M arrest, namely GADD45 and 14-3-3 sigma. Since we observed aberrant accumulation of SOCS3-deficient cells at the G2/M checkpoint, we cannot formally exclude the possibility that there are also effects of SOCS3 on G2/M arrest which may contribute to the preferential accumulation of cells at this checkpoint. However, our data show that G1 arrest is clearly impaired in cell lacking SOCS3. Genetic reconstitution experiments have shown that STAT3 is the major SOCS3 target in the DNA damage response. Retroviral transduction of WT SOCS3 partially restored radiation-induced G1 arrest in SOCS3−/− MEFs. Strikingly, we found that ectopic expression of DN STAT3 completely reversed the G1 arrest defect and restored G1 arrest in response to DNA damage to WT levels. Consistent with this observation, we also determined that STAT3 tyrosine phosphorylation is markedly elevated and constitutive in SOCS3 KO fibroblasts, whereas it is phosphorylated at very low level basally WT MEFs and is induced only 24 h after exposure to radiation.
Thus, our results indicate that in the radiation response, uncontrolled STAT3 signaling antagonizes G1 arrest by repressing the expression of the p21 gene, and that SOCS3 negatively regulates this activity, resulting in p21 expression and cell cycle arrest. Recent studies on the role of STAT3 in the regulation of cell cycle progression and p21 expression have generated conflicting findings. Interleukin (IL)-6 stimulation has been shown to induce p21 expression in a STAT3-dependent manner in cells that respond to IL-6 with growth arrest and/or differentiation [37–41]. However, other studies have shown that cytokines which trigger cell proliferation activate STAT3-dependent p21 downregulation, which drives the cell through the G1/S transition [42]. In support of this model, mice with a targeted deletion of STAT3 in mammary tissue displayed precocious expression of p21 [43]. In addition, granulocyte colony stimulating factor (G-CSF) induced p21 downregulation in murine myeloid cell line BaF/3, but activated p21 expression in BaF/3 cells expressing DN STAT3 [44], suggesting that STAT3 represses p21 expression in proliferating cells. Importantly, it has been shown that in late stage melanoma, the ability of STAT3 to induce p21 is lost, resulting in increased tumor aggressiveness and increased cell proliferation [45]. These studies suggest that STAT3 activation can generate distinct transcriptional outputs, and that STAT3 can induce or repress p21, depending on the cellular environment. In particular, when cells are triggered to proliferate, STAT3 functions to repress p21 expression and drive the cells into S phase. Our data suggest that SOCS3 is part of a STAT3-inducible negative feedback loop, and plays a role in determining the outcome of STAT3 signaling in the context of the DNA damage response.
The p21 protein has been shown to induce both G1 and G2/M arrest in in vitro studies. However, it is clear that the major function of p21 is to activate G1 arrest in response to DNA damage [27,46–49]. In several studies, cells from p21-deficient mice failed to undergo G1 arrest in response to DNA damaging agents [46,47]. These findings are consistent with our conclusion that SOCS3 promotes G1 arrest in irradiated cells by acting on the STAT3-p21 pathway. Indeed, the cell cycle arrest profile of p21-deficient cells resembles the profile of SOCS3-deficient cells in response to DNA damaging agents [46,47]. Clearly, there are other molecules that are likely to play a role in the abnormal response to DNA damage in SOCS3 KO cells. In particular, other STAT3-dependent genes may be involved in antagonizing cell cycle arrest. One such gene is cyclin D1, a STAT3 target gene that plays a key role in activating CDK4/CDK6 kinase activity and driving cells through G1 [30,31]. Our RT-PCR results, however, indicate that cyclin D1 mRNA was not aberrantly upregulated in SOCS3−/− fibroblasts. Thus, we conclude that SOCS3 regulates the DNA damage response primarily by modulating STAT3 repression of p21.
The molecular basis of STAT3-mediated p21 gene repression is not well understood and is currently being investigated. Recent studies indicate that STAT3 can repress p21 expression by either direct or indirect mechanisms. It has been shown that the p21 promoter has three STAT binding sites which are capable of recruiting STAT3 [50]. Recently, it was demonstrated that STAT3 represses p21 expression by directly binding the p21 promoter, binding the NcoA/SRC1a cofactor, but failing to recruit the histone acetylase CBP300 and RNA polymerase [51,52]. Thus, one possible mechanism for the failure to induce p21 expression after irradiation in SOCS3 KO fibroblasts might be altered STAT3 transcriptional complexes on the p21 promoter.
Alternatively, there are at least two potential indirect mechanisms by which STAT3 may repress p21 expression in our system. One of these involves direct transcriptional repression of the p53 gene by STAT3 [34]. Since p21 is a p53 target gene, reduced p53 expression would impair p21 transcriptional upregulation following DNA damage. Our data indicate, however, that the proximal events following radiation, including p53 phosphorylation, are not impaired in SOCS3-deficient cells, and total p53 protein levels are unaffected by the SOCS3 mutation. Thus, repression of p53 expression by activated STAT3 is not likely to play a role in our system.
Finally, a third possible mechanism for STAT3-dependent p21 gene repression may involve the action of a STAT3 target gene. The c-Myc protooncogene, a STAT3 target gene, has been shown to repress p21 gene expression and activate cell cycle progression [53–56]. Thus, enhanced STAT3 activation in SOCS3 KO cells might lead to p21 gene repression through the action of c-Myc on the p21 promoter. The molecular basis of p21 gene repression in SOCS3-deficient MEFs following DNA damage may involve one or more of the above mechanisms and is currently under investigation in our laboratory.
Our findings indicate that the balance between proliferation and cell cycle arrest following DNA damage requires strict regulation of the STAT3 transcription factor. Following DNA damage in WT cells, STAT3 signaling is repressed by SOCS3, which favors cell cycle arrest through induction of p21, among other genes. In the absence of SOCS3, STAT3 activation is uncontrolled and the balance is shifted toward p21 gene repression, proliferation, and progression through the G1 phase of the cell cycle. Thus, SOCS3 may be a key factor in the decision between cell cycle arrest or radioresistant DNA synthesis following DNA damage. Since tumor cells have altered responses to ionizing radiation compared to non-transformed cells, targeting the STAT3–SOCS3 pathway may modulate radiation sensitivity and be of therapeutic benefit.
References
- 1.Endo TA, Masuhara M, Yokouchi M, Suzuki R, Sakamoto H, Mitsui K, Matsumoto A, Tanimura S, Ohtsubo M, Misawa H, Miyazaki T, Leonor N, Taniguchi T, Fujita T, Kanakura Y, Komiya S, Yoshimura A. Nature. 1997;387:921. doi: 10.1038/43213. [DOI] [PubMed] [Google Scholar]
- 2.Naka T, Narazaki M, Hirata M, Matsumoto T, Minamoto S, Aono A, Nishimoto N, Kajita T, Taga T, Yoshizaki K, Akira S, Kishimoto T. Nature. 1997;387:924. doi: 10.1038/43219. [DOI] [PubMed] [Google Scholar]
- 3.Starr R, Willson TA, Viney EM, Murray LJ, Rayner JR, Jenkins BJ, Gonda TJ, Alexander WS, Metcalf D, Nicola NA, Hilton DJ. Nature. 1997;387:917. doi: 10.1038/43206. [DOI] [PubMed] [Google Scholar]
- 4.Cacalano NA, Sanden D, Johnston JA. Nat Cell Biol. 2001;3:460. doi: 10.1038/35074525. [DOI] [PubMed] [Google Scholar]
- 5.Sitko JC, Guevara CI, Cacalano NA. J Biol Chem. 2004;279:37662. doi: 10.1074/jbc.M404007200. [DOI] [PubMed] [Google Scholar]
- 6.Yasukawa H, Sasaki A, Yoshimura A. Annu Rev Immunol. 2000;18:143. doi: 10.1146/annurev.immunol.18.1.143. [DOI] [PubMed] [Google Scholar]
- 7.Alexander WS, Hilton DJ. Annu Rev Immunol. 2004;22:503. doi: 10.1146/annurev.immunol.22.091003.090312. [DOI] [PubMed] [Google Scholar]
- 8.Kile BT, Schulman BA, Alexander WS, Nicola NA, Martin HM, Hilton DJ. Trends Biochem Sci. 2002;27:235. doi: 10.1016/s0968-0004(02)02085-6. [DOI] [PubMed] [Google Scholar]
- 9.De Sepulveda P, Okkenhaug K, Rose JL, Hawley RG, Dubreuil P, Rottapel R. EMBO J. 1999;18:904. doi: 10.1093/emboj/18.4.904. [DOI] [PMC free article] [PubMed] [Google Scholar]
- 10.Rui L, Yuan M, Frantz D, Shoelson S. J Biol Chem. 2002;277:42394. doi: 10.1074/jbc.C200444200. [DOI] [PubMed] [Google Scholar]
- 11.Park SH, Kim KE, Hwang HY, Kim TY. DNA Cell Biol. 2003;22:131. doi: 10.1089/104454903321515931. [DOI] [PubMed] [Google Scholar]
- 12.Yasukawa H, Ohishi M, Mori H, Murakami M, Chinen T, Aki D, Hanada T, Takeda K, Akira S, Hoshijima M, Hirano T, Chien KR, Yoshimura A. Nat Immunol. 2003;4:551. doi: 10.1038/ni938. [DOI] [PubMed] [Google Scholar]
- 13.Lang R, Pauleau AL, Parganas E, Takahashi Y, Mages J, 1hle JN, Rutschman R, Murray PJ. Nat Immunol. 2003;4:546. doi: 10.1038/ni932. [DOI] [PubMed] [Google Scholar]
- 14.Croker BA, Krebs DL, Zhang JG, Wormald S, Willson TA, Stanley EG, Robb L, Greenhalgh CJ, Forster I, Clausen BE, Nicola NA, Metcalf D, Hilton DJ, Roberts AW, Alexander WS. Nat Immunol. 2003;4:540. doi: 10.1038/ni931. [DOI] [PubMed] [Google Scholar]
- 15.Seki Y, Inoue H, Nagata N, Hayashi K, Fukuyama S, Matsumoto K, Komine O, Hamano S, Himeno K, Inagaki-Ohara K, Cacalano N, O’Garra A, Oshida T, Saito H, Johnston JA, Yoshimura A, Kubo M. Nat Med. 2003;9:1047. doi: 10.1038/nm896. [DOI] [PubMed] [Google Scholar]
- 16.Roberts AW, Robb L, Rakar S, Hartley L, Cluse L, Nicola NA, Metcalf D, Hilton DJ, Alexander WS. Proc Natl Acad Sci U S A. 2001;98:9324. doi: 10.1073/pnas.161271798. [DOI] [PMC free article] [PubMed] [Google Scholar]
- 17.Okada S, Nakamura M, Katoh H, Miyao T, Shimazaki T, Ishii K, Yamane J, Yoshimura A, Iwamoto Y, Toyama Y, Okano H. Nat Med. 2006;12:829–834. doi: 10.1038/nm1425. [DOI] [PubMed] [Google Scholar]
- 18.Emery B, Cate HS, Marriott M, Merson T, Binder MD, Snell C, Soo PY, Murray S, Croker B, Zhang JG, Alexander WS, Cooper H, Butzkueven H, Kilpatrick TJ. Proc Natl Acad Sci U S A. 2006;103:7859–7864. doi: 10.1073/pnas.0602574103. [DOI] [PMC free article] [PubMed] [Google Scholar]
- 19.Eastman A. J Cell Biochem. 2004;91:223. doi: 10.1002/jcb.10699. [DOI] [PubMed] [Google Scholar]
- 20.Efeyan A, Serrano M. Cell Cycle. 2007;6:1006. doi: 10.4161/cc.6.9.4211. [DOI] [PubMed] [Google Scholar]
- 21.Owa T, Yoshino H, Yoshimatsu K, Nagasu T. Curr Med Chem. 2001;8:1487. doi: 10.2174/0929867013371996. [DOI] [PubMed] [Google Scholar]
- 22.Bartek J, Lukas J. FEBS Lett. 2001;490:117. doi: 10.1016/s0014-5793(01)02114-7. [DOI] [PubMed] [Google Scholar]
- 23.Lavin MF. Int J Biochem Cell Biol. 1999;31:735. doi: 10.1016/s1357-2725(99)00028-x. [DOI] [PubMed] [Google Scholar]
- 24.Deng C, Zhang P, Harper JW, Elledge SJ, Leder P. Cell. 1995;82:675. doi: 10.1016/0092-8674(95)90039-x. [DOI] [PubMed] [Google Scholar]
- 25.Adnane J, Jackson RJ, Nicosia SV, Cantor AB, Pledger WJ, Sebti SM. Oncogene. 2000;19:5338. doi: 10.1038/sj.onc.1203956. [DOI] [PubMed] [Google Scholar]
- 26.Missero C, Di Cunto F, Kiyokawa H, Koff A, Dotto GP. Genes Dev. 1996;10:3065. doi: 10.1101/gad.10.23.3065. [DOI] [PubMed] [Google Scholar]
- 27.Gartel AL, Radhakrishnan SK. Cancer Res. 2005;65:3980. doi: 10.1158/0008-5472.CAN-04-3995. [DOI] [PubMed] [Google Scholar]
- 28.Schafer R, Schramme A, Tchernitsa OI, Sers C. Recent Results Cancer Res. 2007;176:7. doi: 10.1007/978-3-540-46091-6_2. [DOI] [PubMed] [Google Scholar]
- 29.Yoshimura A. Cancer Sci. 2006;97:439. doi: 10.1111/j.1349-7006.2006.00197.x. [DOI] [PMC free article] [PubMed] [Google Scholar]
- 30.Leeman RJ, Lui VW, Grandis JR. Expert Opin Biol Ther. 2006;6:231. doi: 10.1517/14712598.6.3.231. [DOI] [PubMed] [Google Scholar]
- 31.Haura EB, Turkson J, Jove R. Nat Clin Pract Oncol. 2005;2:315. doi: 10.1038/ncponc0195. [DOI] [PubMed] [Google Scholar]
- 32.Zhou H, Miki R, Eeva M, Fike FM, Seligson D, Yang L, Yoshimura A, Teitell MA, Jamieson CA, Cacalano NA. Clin Cancer Res. 2007;13:2344. doi: 10.1158/1078-0432.CCR-06-2303. [DOI] [PubMed] [Google Scholar]
- 33.Lu Y, Fukuyama S, Yoshida R, Kobayashi T, Saeki K, Shiraishi H, Yoshimura A, Takaesu G. J Biol Chem. 2006;281:36683. doi: 10.1074/jbc.M607374200. [DOI] [PubMed] [Google Scholar]
- 34.Niu G, Wright KL, Ma Y, Wright GM, Huang M, Irby R, Briggs J, Karras J, Cress WD, Pardoll D, Jove R, Chen J, Yu H. Mol Cell Biol. 2005;25:7432. doi: 10.1128/MCB.25.17.7432-7440.2005. [DOI] [PMC free article] [PubMed] [Google Scholar]
- 35.Thiriet C, Hayes JJ. Mol Cell. 2005;18:617. doi: 10.1016/j.molcel.2005.05.008. [DOI] [PubMed] [Google Scholar]
- 36.Lowndes NF, Toh GW. Curr Biol. 2005;15:R99. doi: 10.1016/j.cub.2005.01.029. [DOI] [PubMed] [Google Scholar]
- 37.Moran DM, Mattocks MA, Cahill PA, Koniaris LG, McKillop IH. J Surg Res. 2008;147:23–33. doi: 10.1016/j.jss.2007.04.022. [DOI] [PMC free article] [PubMed] [Google Scholar]
- 38.Nicholson SE, Willson TA, Farley A, Starr R, Zhang JG, Baca M, Alexander WS, Metcalf D, Hilton DJ, Nicola NA. EMBO J. 1999;18:375. doi: 10.1093/emboj/18.2.375. [DOI] [PMC free article] [PubMed] [Google Scholar]
- 39.Nakajima K, Yamanaka Y, Nakae K, Kojima H, Ichiba M, Kiuchi N, Kitaoka T, Fukada T, Hibi M, Hirano T. EMBO J. 1996;15:3651. [PMC free article] [PubMed] [Google Scholar]
- 40.Minami M, Inoue M, Wei S, Takeda K, Matsumoto M, Kishimoto T, Akira S. Proc Natl Acad Sci U S A. 1996;93:3963. doi: 10.1073/pnas.93.9.3963. [DOI] [PMC free article] [PubMed] [Google Scholar]
- 41.Yamanaka Y, Nakajima K, Fukada TH, Hibi M, Hirano EMBO J. 1996;15:1557. [PMC free article] [PubMed] [Google Scholar]
- 42.Karras JG, McKay RA, Lu T, Pych J, Frank DA, Rothstein TL, Monia BP. Cell Immunol. 2000;202:124. doi: 10.1006/cimm.2000.1661. [DOI] [PubMed] [Google Scholar]
- 43.Chapman RS, Lourenco PC, Tonner E, Flint DJ, Selbert S, Takeda K, Akira S, Clarke AR, Watson CJ. Genes Dev. 1999;13:2604. doi: 10.1101/gad.13.19.2604. [DOI] [PMC free article] [PubMed] [Google Scholar]
- 44.Fukada T, Ohtani T, Yoshida Y, Shirogane T, Nishida K, Nakajima K, Hibi M, Hirano T. EMBO J. 1998;17:6670. doi: 10.1093/emboj/17.22.6670. [DOI] [PMC free article] [PubMed] [Google Scholar]
- 45.Florenes VA, Lu C, Bhattacharya N, Rak J, Sheehan C, Slingerland JM, Kerbel RS. Oncogene. 1999;18:1023. doi: 10.1038/sj.onc.1202382. [DOI] [PubMed] [Google Scholar]
- 46.Deng C, Zhang P, Harper JW, Elledge SJ, Leder P. Cell. 1995;82:675. doi: 10.1016/0092-8674(95)90039-x. [DOI] [PubMed] [Google Scholar]
- 47.Brugarolas J, Chandrasekaran C, Gordon JI, Beach D, Jacks T, Hannon GJ. Nature. 1995;377:552. doi: 10.1038/377552a0. [DOI] [PubMed] [Google Scholar]
- 48.Waldman T, Kinzler KW, Vogelstein B. Cancer Res. 1995;55:5187. [PubMed] [Google Scholar]
- 49.Bae I, Fan S, Bhatia K, Kohn KW, Fornace AJ, Jr, O’Connor PM. Cancer Res. 1995;55:2387. [PubMed] [Google Scholar]
- 50.Chin YE, Kitagawa M, Su WC, You ZH, 1wamoto Y, Fu XY. Science. 1996;272:719. doi: 10.1126/science.272.5262.719. [DOI] [PubMed] [Google Scholar]
- 51.Barre B, Avril S, Coqueret O. J Biol Chem. 2003;278:2990. doi: 10.1074/jbc.M210422200. [DOI] [PubMed] [Google Scholar]
- 52.Giraud S, Bienvenu F, Avril S, Gascan H, Heery DM, Coqueret O. J Biol Chem. 2002;277:8004. doi: 10.1074/jbc.M111486200. [DOI] [PubMed] [Google Scholar]
- 53.Mukherjee S, Conrad SE. J Biol Chem. 2005;280:17617. doi: 10.1074/jbc.M502278200. [DOI] [PubMed] [Google Scholar]
- 54.Shirogane T, Fukada T, Muller JM, Shima DT, Hibi M, Hirano T. Immunity. 1999;11:709. doi: 10.1016/s1074-7613(00)80145-4. [DOI] [PubMed] [Google Scholar]
- 55.Gartel AL, Shchors K. Exp Cell Res. 2003 Feb 1;283(1):17–21. doi: 10.1016/s0014-4827(02)00020-4. [DOI] [PubMed] [Google Scholar]
- 56.Coller HA, Grandori C, Tamayo P, Colbert T, Lander ES, Eisenman RN, Golub TR. Proc Natl Acad Sci U S A. 2000;97:3260. doi: 10.1073/pnas.97.7.3260. [DOI] [PMC free article] [PubMed] [Google Scholar]


