Abstract
Background
Initiation of combination antiretroviral therapy (ART) results in higher total CD4 cell counts, a surrogate for immune reconstitution. Whether the baseline CD4 cell count affects reconstitution of immune cell subsets has not been well characterized.
Methods
Using data from 978 patients (621 with comprehensive immunological assessments) from the AIDS [Acquired Immunodeficiency Syndrome] Clinical Trials Group protocol 384, a randomized trial of initial ART, we compared reconstitution of CD4+, CD4+ naive and memory, CD4+ activation, CD8+, CD8+ activation, B, and natural killer cells among patients in different baseline CD4+ strata. Reference ranges for T cell populations in control patients negative for human immunodeficiency virus (HIV) infection were calculated using data from AIDS Clinical Trials Group protocol A5113.
Results
Patients in the lower baseline CD4+ strata did not achieve total CD4+ cell counts similar to those of patients in the higher strata during 144 weeks of ART, although CD4+ cell count increases were similar. Ratios of CD4+ naive-memory cell counts and CD4+:CD8+ cell counts remained significantly reduced in patients with lower baseline CD4+ cell counts (≤350 cells/mm3). These immune imbalances were most notable for those initiating ART with a baseline CD4+ cell count ≤200 cells/mm3, even after adjustment for baseline plasma HIV RNA levels.
Conclusions
After nearly 3 years of ART, T cell subsets in patients with baseline CD4+ cell counts >350 cells/mm3 achieved or approached the reference range those of control individuals without HIV infection. In contrast, patients who began ART with ≤350 CD4+ cells/mm3 generally did not regain normal CD4+ naive-memory cell ratios. These results support current guidelines to start ART at a threshold of 350 cells/mm3 and suggest that there may be immunological benefits associated with initiating therapy at even higher CD4+ cell counts.
For nearly 25 years, CD4+ cell counts have been used as the primary indicator of HIV-1 disease progression and when to start antiretroviral therapy (ART) [1, 2]. Initiating antiretrovirals in patients with higher CD4+ cell counts may result in higher total CD4+ cell counts and more-durable virological suppression [3–8]. There is also a survival benefit associated with initiating ART before the CD4+ cell count decreases to <200 cells/mm3 [4, 9–11]; however, when initiated at 350–201 cells/mm3, benefits are less clear [12–14]. US and European consensus guidelines released in December 2007 recommend treating patients who have CD4+ counts ≤350 cells/mm3 [1, 2]. European AIDS Clinical Society guidelines also recommend initiating therapy in individuals with CD4+ cell counts of 350–500 cells/mm3 and elevated HIV viral loads (VLs) (i.e., >100,000 copies/mL), a rapidly decreasing CD4+ cell count (>50–100 cells/mm3), age >55 years, or hepatitis C virus coinfection. Whether more-complete reconstitution of immune subsets occurs when ART is initiated at higher CD4+ cell counts is not well characterized.
CD4+ cell depletion is the hallmark of HIV infection and occurs as a consequence of viral replication and resulting cytolysis and apoptosis [15]. The latter has been shown to correlate with T cell activation and expression of TNF-α [16]. CD4+ cell loss is associated with increased CD8+ cell activation and memory CD8+ cells [17], which are predictive of HIV disease progression and death [18]. ART helps to restore circulating T cells by decreasing cell turnover, redistributing T cells, and increasing thymic output [19, 20]. Immunological reconstitution is typically measured by circulating CD4+ cell counts, which follow a biphasic pattern: an initial rapid increase during the first few months of ART, followed by a slower increase [21–25]. Among individuals with virological suppression, CD4+ cell counts continue to increase throughout 5 years, regardless of the baseline CD4+ cell count [26]. Several cohort studies have observed that patients who started ART with CD4+ cell counts <350 cells/mm3 were less likely to achieve normal levels [7, 12, 27]. However, these cohort studies did not include detailed assessments of immune cell subsets, and observations based on total CD4+ cell counts alone may not accurately reflect immune reconstitution [21, 28, 29].
AIDS Clinical Trials Group (ACTG) protocol 384 was a large international trial that compared different ART strategies in treatment-naive patients. As reported elsewhere, the CD4+ cell count increase was not affected by initial treatment assignment [30]. Younger age, female sex, higher baseline CD4+ naive-memory cell ratio, higher HIV RNA level, and virological suppression after starting ART were associated with greater increases in total CD4+ cell count [31]. A subset of patients had a CD4+ cell count increase of ≤100 cells/mm3, despite long-term virological suppression, and this immune deficit correlated with persistent T cell activation. We now report differences in immune cell subsets by baseline CD4+ cell count stratum, and we compare these values with those of healthy HIV-negative patients.
METHODS
ART-naive HIV-1–infected patients were randomized to 6 initial ART strategies composed of 2 nucleosides: stavudine and didanosine, or lamivudine and zidovudine, combined with either nelfinavir, efavirenz, or both (ACTG protocol 384). After week 24, patients were required to switch to a different regimen after 2 consecutive VLs of >200 copies/mL [30, 32]. Plasma HIV-1 VLs were measured every 4 weeks until week 24, then every 8 weeks (Roche Amplicor, version 1.0). Log10 VL values were used for all analyses; 50 copies/mL was imputed for values under the lower limit. CD4+ and CD8+ cell counts were measured at pre-entry, study entry (day 0), every 8 weeks for 48 weeks, and then every 16 weeks. A subset of patients followed at US sites with specialized flow cytometry capacity underwent comprehensive immunological assessments (naive and memory CD4+, activated CD4+ and CD8+, natural killer, and B cell measurements) at baseline and then at 24-week intervals.
Study definitions
Baseline CD4+ cell count strata 1–5 were defined as ≤50, 51–200, 201–350, 351–500, and >500 cells/mm3, respectively. Virological suppression was defined as an HIV VL <50 copies/mL. Immunological success was defined as a CD4+ cell count increase of ≥100 cells/mm3 over baseline [31].
Three-color flow cytometry was performed using fresh cells, according to the ACTG protocol. Immune subsets were defined using the following markers: naive CD4+ cells defined by CD4+, CD45RA+, and CD62L+; memory CD4+ cells defined by CD4+, CD45RO+, and CD45RA−; B cells defined by CD3− and CD19+; activated CD4+ and CD8+ cells defined by CD4+ or CD8+ plus CD38+ and HLA-DR+; and natural killer cells defined by CD3−, CD56+, and/or CD16+.
Reference ranges for immune cell subsets were calculated using data from ACTG protocol A5113, which studied 48 healthy HIV-negative patients, one-half of whom were aged 18–30 years and one-half of whom were aged ≥45 years [33]. The lowest of the first quartiles and the highest of the third quartiles for the 2 age groups were used for comparison; interquartile ranges (25th–75th percentiles) appear as shaded bands on figures 1–5 and above the HIV-negative bars in figures 6 and 7.
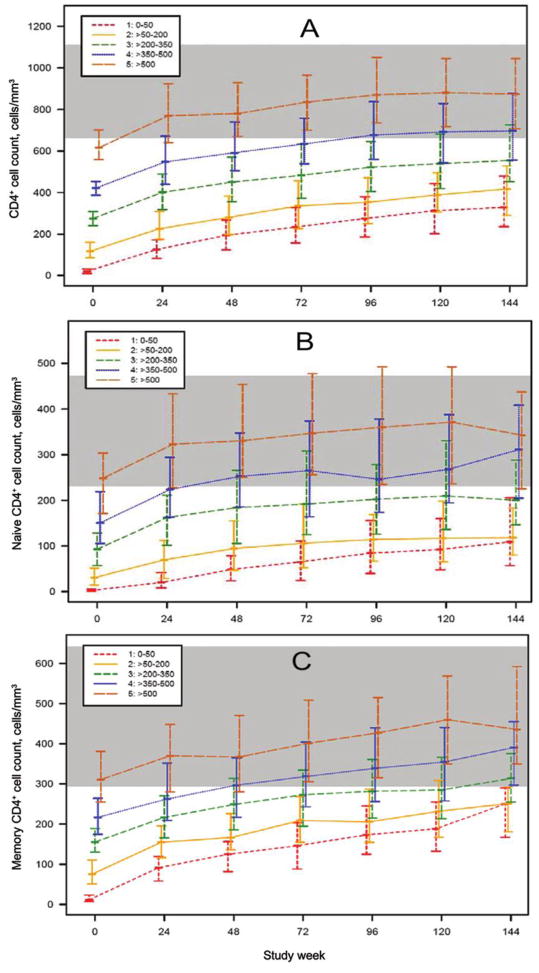
Figure 1.
Median (interquartile range) CD4+ cell counts (A), CD4+ naive cell counts (B), and CD4+ memory cell counts (C) by baseline CD4+ stratum and study week for patients who underwent comprehensive immunological assessments by advanced flow cytometry. The shaded band reflects the lowest and highest interquartiles of the 2 age groups of HIV-negative control subjects (from AIDS Clinical Trials Group protocol A5113) [33].
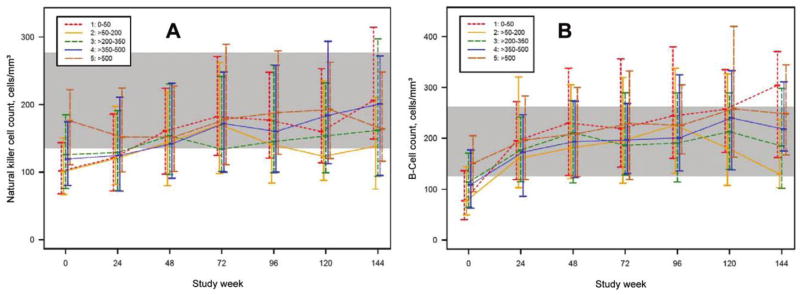
Figure 5.
Median (interquartile range) for natural killer cell (CD3−/CD56+ and CD16+) counts (A) and B cell (CD3−/CD19+) counts (B) by baseline CD4+ stratum over time for patients who underwent comprehensive immunological assessments by advanced flow cytometry. The shaded area reflects the lowest and highest interquartiles of the 2 age groups of HIV-negative control subjects (from AIDS Clinical Trials Group protocol A5113) [33].
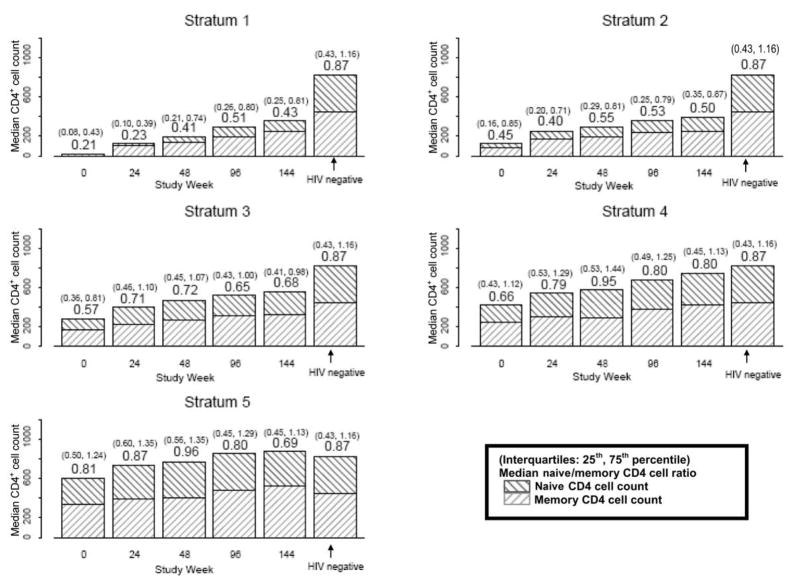
Figure 6.
Median (interquartile range) CD4+ naive-memory cell ratios by baseline CD4+ stratum and study week for patients who underwent comprehensive immunological assessments by advanced flow cytometry and HIV-negative control subjects (from AIDS Clinical Trials Group [ACTG] protocol A5113) [33]. The y-axis reflects the absolute count for both CD4+ naive and memory cells. CD4+ naive-memory cell ratios are shown above the bars at each time point, and the interquartile ranges are shown above, in parentheses. Results for HIV-negative control subjects from ACTG protocol A5113 are shown to the right of the week 144 bars, for comparison. After controlling for baseline HIV RNA level, the CD4+ naive-memory cell ratio for stratum 1 was significantly different from stratum 3 (weeks 0 and 24), stratum 4 (weeks 0, 24, 48, and 96), and stratum 5 (weeks 0, 24, and 48), and the stratum 2 CD4+ naive-memory ratio was significantly different from stratum 4 (weeks 24 and 96) and stratum 5 (weeks 0, 24, and 48).
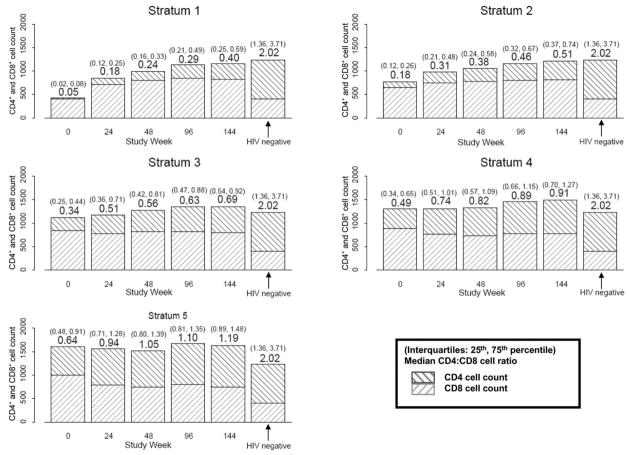
Figure 7.
Median (interquartile range) CD4+:CD8+ cell ratios by baseline CD4+ stratum over time for patients who underwent comprehensive immunological assessments by advanced flow cytometry and for HIV-negative control subjects (from AIDS Clinical Trials Group [ACTG] protocol A5113) [33]. The y-axis reflects the absolute count for both CD4+ and CD8+ cells. Median CD4+:CD8+ cell ratios are shown above the box plot at each time point, and interquartile ranges are above in parentheses. Results for HIV-negative control subjects from ACTG protocol A5113 are shown to the right of the week 144 bars, for comparison.
Statistical analyses
Unless otherwise stated, analyses were based on all available data, regardless of whether patients were virally suppressed. The nominal level of statistical significance used for these exploratory analyses was .05. Tests were 2-sided and were not adjusted for multiple testing. Median and inter-quartile ranges are presented. Continuous outcomes were compared among baseline strata with a Jonckheere-Terpstra trend test or between 2 groups with a Wilcoxon rank-sum test. Categorical outcomes were compared with a Cochran-Armitage trend test or Fisher’s exact test. Time to viral suppression was compared with a log-rank test and was analyzed using a Cox proportional hazards model. Baseline CD4+ stratum was based on the mean of pre-entry and entry CD4+ cell counts except when testing the association between baseline strata and ΔCD4+ cell count, in which case baseline stratum was based on the pre-entry CD4+ cell count only, and the entry CD4+ cell count was used to calculate the ΔCD4+ cell count. Statistical analyses were performed using SAS statistical software, version 9.1.3 (SAS), and Proc-StatXact, version 5 (Cytel Software).
RESULTS
Baseline demographic characteristics
Demographic characteristics of ACTG protocol 384 have been described elsewhere [30–32]. Comprehensive immunological assessments were performed for 623 patients (64% of the study cohort). Two patients did not have baseline CD4+ cell counts available and were excluded. Baseline characteristics for the remaining 621 patients were similar to those of patients involved in the main study, except for race/ethnicity (table 1) [31].
Table 1.
Baseline characteristics of patients with additional flow cytometry assessment, by baseline CD4+ stratum.
| Baseline CD4+ stratum (CD4+ cells/mm3) |
|||||||
|---|---|---|---|---|---|---|---|
| Variable | 1 (0–50) (n = 110) | 2 (51–200) (n = 119) | 3 (201–350) (n = 152) | 4 (351–500) (n = 124) | 5 (>500) (n = 116) | All (n = 621) | P |
| Male | 97 | 99 | 127 | 100 | 89 | 512 | .024a |
| Female | 13 | 20 | 25 | 24 | 27 | 109 | |
| White | 47 | 56 | 66 | 62 | 56 | 287 | .279c |
| Hispanic | 12 | 20 | 26 | 9 | 16 | 83 | |
| Black | 50 | 41 | 57 | 48 | 43 | 239 | |
| Other | 1 | 2 | 3 | 5 | 1 | 12 | |
| IDU | 12 | 6 | 15 | 5 | 10 | 48 | .485a |
| No IDU | 98 | 113 | 137 | 119 | 106 | 573 | |
| Age, median years (IQR) | 38 (32–45) | 37 (31–42) | 35 (30–44) | 35 (29–41) | 36 (28–42) | 36 (30–43) | .001b |
| HIV RNA log10, median copies/mL, (IQR) | 5.65 (5.26–6.08) | 5.38 (4.89–5.86) | 4.85 (4.32–5.34) | 4.55 (4.12–5.06) | 4.34 (3.84–4.81) | 4.92 (4.33–5.52) | <.001b |
NOTE. Data are no. of patients, unless otherwise indicated. Race and ethnicity were self-identified according to the categories. Hispanic ethnicity was reported regardless of race. There was a smaller Hispanic proportion in patients with additional assessment by flow cytometry than those without [31]. IDU, history of or current injection drug use; IQR, interquartile range.
By Cochran-Armitage trend test.
By Jonckheere-Terpstra test.
By Fisher’s exact test.
Study follow-up
The percentages of patients CD4+ cell counts were 89%, 83%, 74%, and 61% at weeks 24, 48, 96, and 144, respectively (no statistically significant differences in follow-up by baseline stratum). There were also no differences in additional flow cytometry assessments (84%, 79%, and 73% at weeks 24, 48, and 96, respectively). However, because ACTG protocol 384 was designed to provide a minimum of 2 years of follow-up and because advanced flow monitoring was introduced after the start of study recruitment, there was a large decrease after week 96, and only 166 (27%) of the 621 patients with flow cytometry had week 144 data. In addition, there were fewer patients in the lower strata at week 144 (P =.033).
Time to virological suppression
Comparison of time to virological suppression (HIV RNA level, <50 copies/mL) showed significant differences on the basis of baseline CD4+ strata (P < .001, by log-rank test): median, 16 weeks for strata 1 and 2 and 12 weeks for strata 3, 4, and 5. Time to virological suppression was also affected by baseline VL (P < .001): median, 8 weeks for patients with baseline VLs <35,000 copies/mL, 12 weeks for VLs of 35,000–100,000 copies/mL, and 16 weeks for VLs >100,000 copies/mL. In a Cox proportional hazards model controlled for age and sex, higher baseline CD4+ cell count, lower VL, and greater CD8+ activation percentage were associated with faster time to virological suppression (P =.02, P < .001, and P =.001, respectively).
Lymphocytes
At baseline, total lymphocyte counts were lower in the lower CD4+ cell count strata (medians, 690, 1102, 1144, 1710, and 2131 cells/mm3 for strata 1–5, respectively; P < .001) and increased more than the higher strata at weeks 24, 48, 96, and 144 (all P < .001). However, lymphocyte counts in the lower strata remained significantly lower than in the higher strata (P < .001, all time points).
CD4+ cells
As reported elsewhere, there was a biphasic reconstitution of CD4+ cell counts: a rapid increase during the first 8 weeks followed by a more gradual increase [31]. Median and ΔCD4+ cell counts (change from baseline) for baseline CD4+ strata are given in table 2. Strata did not appear to affect ΔCD4+ cell count, except at week 144, partly because CD4+ cell counts for patients in the lower strata continued to increase, whereas counts for those in stratum 5 started to plateau. However, because follow-up after week 96 was limited, this finding should be interpreted cautiously. Despite these differences, patients with lower baseline CD4+ cell counts never caught up, in terms of absolute CD4+ cell counts, with those starting in higher strata. Similar findings were found for the subset of patients with additional flow cytometry (figure 1A). Among patients in stratum 4, those with a baseline VL >100,000 copies/mL, compared with ≤100,000 copies/mL, had significantly greater ΔCD4+ cell counts at weeks 48 and 96 but not week at 144 (P =.022, P =.035, and P =.25, respectively) [1].
Table 2.
Median CD4+ and ΔCD4+ cell counts by baseline CD4+ stratum and study week.
| Baseline CD4+ cell count stratum |
||||||
|---|---|---|---|---|---|---|
| CD4+ cell count assessment | 1 (n = 175) | 2 (n = 189) | 3 (n = 232) | 4 (n = 203) | 5 (n = 179) | P |
| Baseline | ||||||
| Median CD4+ cell count, cells/mm3 | 21 | 118 | 275 | 422 | 616 | … |
| Week 24 | ||||||
| Percentage of patients with CD4+ cell counta | 89 | 89 | 89 | 88 | 89 | .99b |
| Median CD4+ cell count, cells/mm3 | 128 | 232 | 405 | 548 | 767 | <.001c |
| Median ΔCD4+ cell count, cells/mm3 | 106.0 | 116.0 | 129.5 | 127.0 | 114.0 | .177c |
| Week 48 | ||||||
| Percentage of patients with CD4+ cell counta | 88 | 83 | 82 | 81 | 82 | .122b |
| Median CD4+ cell count, cells/mm3 | 194 | 281 | 458 | 587 | 777 | <.001c |
| Median ΔCD4+ cell count, cells/mm3 | 167 | 150 | 184 | 181 | 160 | .650c |
| Week 96 | ||||||
| Percentage of patients with CD4+ cell counta | 77 | 69 | 74 | 73 | 72 | .542b |
| Median CD4+ cell count, cells/mm3 | 282 | 352 | 520 | 695 | 868 | <.001c |
| Median ΔCD4+ cell count, cells/mm3 | 251 | 236 | 241 | 284 | 251 | .706c |
| Week 144 | ||||||
| Percentage of patients with CD4+ cell counta | 65 | 56 | 63 | 61 | 58 | .419b |
| Median CD4+ cell count, cells/mm3 | 333 | 396 | 555 | 739 | 882 | <.001c |
| Median ΔCD4+ cell count, cells/mm3 | 302.5 | 287.5 | 294.0 | 316.5 | 269.0 | .025c |
Percentage of patients with CD4+ cell count measurements for that study visit in each CD4+ stratum.
By Cochran-Armitage trend test to test trends in proportions of available CD4+ data among the CD4+ strata.
By Jonckheere-Terpstra test.
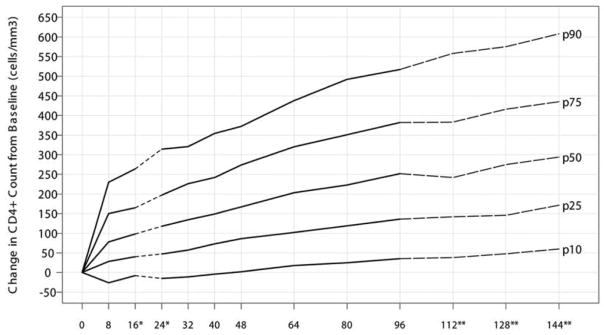
Because increases in CD4+ cell counts were similar across all strata and ART assignments, we plotted percentiles for ΔCD4+ cell counts through week 144 (figure 8). With use of a CD4+ cell count increase of ≥100 cells/mm3 as a criterion for immunologic success, a greater proportion of patients in the lower strata had immunologic success at weeks 96 and 144 (P = .005 and P < .001, respectively; table 3).
Figure 8.
Change in CD4+ cell count from baseline in percentiles (10th, 25th, 50th, 75th, and 90th) for all AIDS Clinical Trials Group (ACTG) protocol 384 patients (n =978). This plot is based on HIV-positive antiretroviral therapy–naive patients after initiating HAART in ACTG protocol 384 with a median (interquartile range) baseline CD4+ cell count of 279 (98–444) cells/mm3. *At weeks 16 and 24, the ΔCD4+ cell count was positively associated with the baseline CD4+ cell count. The median ΔCD4+ cell count was ~47 and 39 cells greater for patients with a baseline CD4+ cell count of >500 cells/mm3 versus ≤50 cells/mm3 at weeks 16 and 24, respectively. **There might be a lack of precision after week 96 because of dropouts and limited follow-up in ACTG protocol 384.
Table 3.
Percentage of patients with a CD4+ cell count increase ≥100 cells/mm3 by baseline CD4+ stratum and study week.
| Percentage of patients with a CD4+ cell count increase ≥100 cells/mm3 by baseline CD4+ cell count stratum |
||||||
|---|---|---|---|---|---|---|
| Assessment week | 1 | 2 | 3 | 4 | 5 | Pa |
| 24 | 54.7 | 61.1 | 67.9 | 55.2 | 55.1 | .141 |
| 48 | 82.8 | 77.2 | 77.8 | 73.3 | 72.7 | .063 |
| 96 | 95.2 | 93.6 | 87.5 | 84.6 | 79.0 | .005 |
| 144 | 92.3 | 90.9 | 100.0 | 95.2 | 73.9 | <.001 |
By Cochran-Armitage trend test, used on pre-entry for stratum and entry for calculating.
As expected, those in the lower CD4+ strata had greater increases in CD4+ percentage points after week 32. During the first 32 weeks, greater CD8+ cell count increases in the group in the lower CD4+ baseline strata negated this effect.
CD4+ naive and memory cells and activation
CD4+ naive and memory cell counts by baseline CD4+ strata are shown in figure 1B and 1C. As with absolute CD4+ cell counts, patients in the lower strata did not achieve the levels of those in the higher strata, and median CD4+ naive and memory cell counts for patients with a baseline CD4+ cell count >350 cells/mm3 normalized by week 48, compared with HIV-negative control subjects. Naive CD4+ cell count increases were greater those in the for the higher CD4+ strata (P < .001 for weeks 24, 48, and 72; P =.020 for week 96; P =.040 for week 120). Differences in memory CD4+ cell counts also persisted (P < .004, for all time points).
A comparison of the CD4+ naive-memory cell ratios revealed several differences. First, the median baseline CD4+ naive-memory cell ratio for patients starting with a CD4+ cell count ≤50 cells/mm3 was 0.21 at baseline and increased to only 0.43 at week 144, failing to reach even the pretreatment median ratio for the other strata (figure 6). Second, CD4+ naive-memory cell ratios were lower among patients in lower strata (≤350 cells/mm3), and this difference persisted through 144 weeks (P < .01, all time points). Differences in CD4+ naive-memory cell ratios by stratum were statistically significant even after adjustment for baseline VL, except at week 144. CD4+ naive-memory cell ratios for most patients in strata 1, 2, and 3 did not return to the reference range, whereas the interquartile range for strata 4 and 5 covered the median for HIV-negative patients for all time points (including baseline). In a regression model that included baseline stratum, VL, sex, and age, patients with a baseline CD4+ cell count >350 cells/mm3 had higher baseline CD4+ naive-memory cell ratios (P =.008). In this model, younger age was significantly associated with a higher baseline ratio (P < .001).
Patients in the lower strata had higher activated CD4+ cell percentages (figure 2A). Median activated CD4+ cell percentage for stratum 1 at baseline was >40%, almost twice that of other strata. Patients in the lower strata had greater decreases in activated CD4+ percentages from baseline to week 24, even after controlling for baseline VL (stratum 1 vs. 2 and stratum 2 vs. strata 3, 4, or 5; P < .001 for all). Differences in activated CD4+ cell percentages became less apparent after week 24, but only patients in stratum 5 achieved levels similar to those of HIV-negative patients. In comparison of the absolute number of activated CD4+ cells rather than percentages, stratum 1 was noticeably lower than other strata or HIV-negative controls at baseline (figure 2B). At week 24 and thereafter, the absolute number of activated CD4+ cells for patients in all strata were similar to those of HIV-negative controls.
Figure 2.
Median (interquartile range) activated CD4+ cell counts (CD4+/CD38+/HLA-DR+) for patients who underwent comprehensive immunological assessments by advanced flow cytometry. Percentages (A) and absolute counts (B) by baseline CD4+ stratum over time are shown. The shaded area reflects the lowest and highest interquartiles of the 2 age groups of HIV-negative control subjects (from AIDS Clinical Trials Group protocol A5113) [33].
CD8+ cell counts, CD8+ activation cell counts, and CD4+: CD8+ ratio
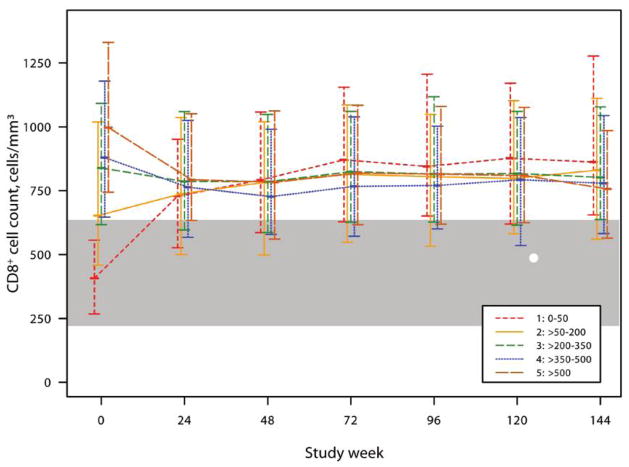
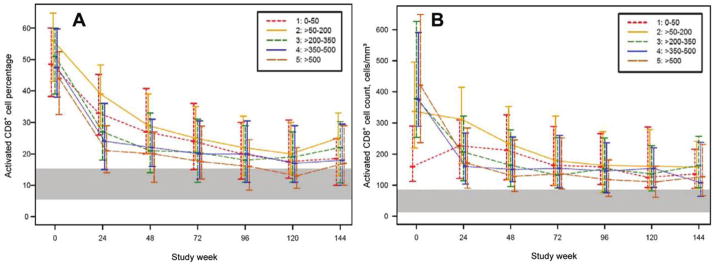
Baseline CD8+ cell counts were abnormally high, except for patients in stratum 1. At week 24 and thereafter, CD8+ cell counts were higher than those in HIV-negative controls (figure 3). In contrast, the activated CD8+ percentage was elevated for all strata at baseline and followed a biphasic decrease (figure 4A). In comparison of absolute activated CD8+ cell counts, patients in stratum 1 had lower counts at baseline and initially increased before decreasing, whereas the patients in the higher strata followed a 2-phase decrease (figure 4B). For patients in all strata, activated CD8+ cell percentages and cell counts did not achieve levels similar to those of HIV-negative patients.
Figure 3.
Median (interquartile range) CD8+ cell counts by baseline CD4+ stratum over time for patients who underwent comprehensive immunological assessments by advanced flow cytometry. The shaded area reflects the lowest and highest interquartiles of the 2 age groups of HIV-negative control subjects (from AIDS Clinical Trials Group protocol A5113) [33].
Figure 4.
Median (interquartile range) activated CD8+ cell counts (CD8+/CD38+/HLA-DR+) percentages (A) and absolute counts (B) by baseline CD4+ stratum over time for patients who underwent comprehensive immunological assessments by advanced flow cytometry. The shaded area reflects the lowest and highest interquartiles of the 2 age groups of HIV-negative control subjects (from AIDS Clinical Trials Group protocol A5113) [33].
The median CD4+:CD8+ ratios were also higher among patients in the higher strata (P < .001, for all time points; figure 7). The median CD4+:CD8+ ratio in stratum 1 increased from 0.05 to 0.40 by week 144, which was still lower than the baseline of strata 4 and 5. Nevertheless, this reflects a notable 16-fold increase in CD4+ cell count, which is somewhat offset by a concomitant 2-fold increase in CD8+ cell count. Restricting the analysis to patients with a CD4+ cell count increase >200 cells/mm3 at weeks 48, 96, and 144 yielded similar results (P < .001 for all). The median CD4+:CD8+ cell ratios for patients in all strata remained lower than for those of HIV-negative patients.
Natural killer cells and B cells
Natural killer cell counts slightly increased patients in strata 1–4, but counts for patients in all strata seemed normal after baseline. Baseline B cell counts tended to be slightly lower in the lower strata (figures 5A and 5B).
DISCUSSION
Our findings are consistent with previous descriptions of immune subset reconstitution with ART—that is, an initial phase characterized by expansion and redistribution of CD4+ memory cells followed by a second phase with reconstitution of CD4+ naive and memory cells and B cells and reduction of CD4+ and CD8+ activation [12, 16]. In this secondary analysis of ACTG protocol 384, CD4+ cell count increases from baseline were similar after week 24, regardless of baseline CD4+ stratum. However, CD4+ cell counts for patients in the lower strata remained below those of healthy volunteers and, as in prior reports [7, 12, 33], patients in the lower strata did not achieve levels of those who started with higher CD4+ cell counts, even after nearly 3 years of ART. Moreover, despite similar CD4+ cell count increases across baseline CD4+ strata, differences in reconstitution of immune cells subsets were noted, especially CD4+:CD8+ and CD4+ naive-memory cell ratios.
Patients in lower baseline strata had smaller increases in CD4+ naive cells and greater increases in CD4+ memory cells, which resulted in persistently abnormal absolute cell counts and CD4+ naive-memory cell ratios. Interestingly, this deficit persisted even among patients who achieved a CD4+ cell increase of >200 cells/mm3. Relative differences in CD4+ naive and memory cell counts suggest that a profound immunological deficit occurs in the lowest strata and that this deficit may not resolve despite apparently normal CD4+ cell gains with ART. Recovery of nadir CD4+ naive cell populations may be an important aspect of immune reconstitution, because lower nadir counts have been shown to correlate with suboptimal vaccine responses and blunted CD4+ cell reconstitution [31, 34, 35].
Another important finding of this analysis is the persistent T cell activation among patients in all strata. At baseline, activated CD4+ cell percentages were elevated, especially in strata 1 and 2. Total activated CD4+ cell counts, rather than percentages, were lower in patients in stratum 1, as were CD8+ and activated CD8+ cell counts, which may be explained in part by profound lymphopenia in patients in the lower strata. Reasons for persistent T cell activation despite prolonged suppressive ART are unclear, but ongoing low-level HIV replication and bacterial translocation have been implicated as potential mechanisms [36] and may be associated with higher risks of myocardial disease and cancer [37, 38].
The rapid reduction in both activated CD4+ and CD8+ cell populations coincided with the rapid first phase of immune reconstitution and control of HIV viremia, supporting the hypothesis that ART reduces inflammation and subsequent redistribution of CD4+ and CD8+ cells [16]. Baseline median CD8+ cell counts were elevated in all patients but those in the lowest stratum. The reason for lower baseline CD8+ cell counts in patients in stratum 1 is unclear, but because these quickly increased with ART, it may reflect programmed cell death 1–associated CD8+ cell exhaustion or sequestration in lymphoid tissues that can be reversed with suppression of HIV viremia [39, 40]. At week 24 and thereafter, median CD8+ cell counts remained higher for patients in all strata, compared with those in HIV-negative control subjects.
We found no differences when we restricted the analyses to patients without regimen or virological failure. This may have been due in part to the strict definition of failure used by ACTG protocol 384 and suggests that the impact of transient low-level virological failure may be different from the sustained virological failure that is more typically seen in clinical practice.
One limitation of our analysis was the relatively small number of patients who contributed week 144 data. This was expected, because ACTG 384 was designed to allow a minimum of 2 years of follow-up, but reasons for differential follow-up by strata are unclear. However, the study conclusions would be similar if only week 96 data were used.
Exploring differences among the upper strata, we were unable to establish a clear threshold at which to start ART. However, patients initiating ART with a baseline CD4+ cell count >350 cells/mm3 appeared to achieve T cell subsets more similar to those of HIV-negative volunteers (ACTG A5113), compared with most patients who started with a CD4+ count ≤350 cells/mm3, for whom “normalization” of T cell subsets was not achieved. These results suggest that relying solely on absolute CD4+ cell counts as a measure of immune reconstitution may be misleading. Understanding differences in immune cell subsets and ratios on the basis of baseline CD4+ cell count and persistent T cell activation may explain disappointing results from treatment interruption trials and higher rates of cancer [34, 37, 38, 41–43] and may refocus the goals of ART toward normalization of T cell subsets and higher CD4+ thresholds for initiating ART.
In summary, increases in CD4+ cell counts were similar for patients in all baseline strata after week 24, and those in the lower strata did not “catch up” in absolute CD4+ cell counts by week 144. Because CD4+ cell increases from baseline were similar for patients in all strata and different ART regimens, figure 8 could be used to assess patients’ CD4+ cell responses to ART. Total, naive, and memory CD4+ cell counts and cell ratios were lower for patients starting with a CD4+ cell count ≤350 cells/mm3, especially for those with a baseline CD4+ cell count ≤50 cells/mm3; these immune deficits persisted even after nearly 3 years of ART. These findings support ART initiation at a threshold of 350 cells/mm3 [1, 2] and further suggest use of an even higher CD4+ cell count, at which time CD4+ naive cell populations and naive-memory cell ratios are more likely to still be intact.
Acknowledgments
We thank Jessica Hass, for her assistance with the manuscript; Mostafa Nokta, for assistance with design of the immunology component of ACTG protocol 384; Sally Snyder, Sandra Dascomb, Barbara Brizz, Bernadette Jarocki, and Thomas Nevin, for protocol assistance; and Holly Martz, for assistance with graphics. We also thank Robert Kalayjian, Michael Lederman, Ronald Bosch, and Laura Smeaton, for helpful comments and discussions; pharmaceutical sponsors; the ACTG 384 and A5113 teams; study-site personnel; and study participants.
Financial support. The National Institutes of Allergy and Infectious Diseases and the National Institutes of Health (AI38855, AI27659, AI38858, AI25879, AI27666, and K01AI062435 to G.K.R. and IP30AI060354 and AI066992 to R.T.G.). The ACTG 384 study was also supported in part by Agouron/Pfizer, Bristol Myers Squibb, and GlaxoSmithKline.
Potential conflicts of interests. G.R. has received grant support from Boehringer Ingelheim, Gilead, and Schering-Plough and has been a consultant for Abbott, Boehringer Ingelheim, and Tibotec. D.A. has received grant support from Merck, Pfizer, Tibotec, and Roche. R.T.G. has received research grant support from GlaxoSmithKline, Abbott, Gilead, Tibotec, and Pfizer. B.R. has been a consultant for Bristol Myers Squibb and Glaxo-SmithKline. P.R.S. received research grants from Schering-Plough, GlaxoSmithKline, Tibotec, and Pfizer. G.S. has received funding from Abbott, Bristol Myers Squibb, Gilead, GlaxoSmithKline, Monogram, Panacos, Tibotec, and Tobira. R.S. has received research grants from GlaxoSmithKline, Bristol Myers Squibb, and Agouron/Pfizer and has been a consultant for GlaxoSmithKline and Bristol Myers Squibb. R.P. has received grant support from Abbott, Boehringer Ingelheim, Genetic Immunity, Idenix, Koronis, Merck, Pfizer, and Tibotec and has been a consultant and a member of the speaker bureau for Bristol Myers Squibb and Pfizer. All other authors: no conflicts.
Footnotes
Presented in part: the 4th International AIDS Society Conference on HIV Pathogenesis, Treatment & Prevention, WEPEB080, July 2007, Sydney, Australia.
References
- 1.Euroguidelines Group. European guidelines for the clinical management and treatment of HIV infected adults in Europe. European AIDS Clinical Society; 2007. [PubMed] [Google Scholar]
- 2.Panel on Antiretroviral Guidelines for Adults and Adolescents. Guidelines for the use of antiretroviral agents in HIV-1–infected adults and adolescents–December 1, 2007. [Accessed 7 January 2008]; Available at: http://aidsinfo.nih.gov/
- 3.Lederman MM, McKinnis R, Kelleher D, et al. Cellular restoration in HIV infected persons treated with abacavir and a protease inhibitor: age inversely predicts naive CD4 cell count increase. AIDS. 2000;14:2635–42. doi: 10.1097/00002030-200012010-00002. [DOI] [PubMed] [Google Scholar]
- 4.Hogg RS, Yip B, Chan KJ, et al. Rates of disease progression by baseline CD4 cell count and viral load after initiating triple-drug therapy. JAMA. 2001;286:2568–77. doi: 10.1001/jama.286.20.2568. [DOI] [PubMed] [Google Scholar]
- 5.Opravil M, Ledergerber B, Furrer H, et al. Clinical efficacy of early initiation of HAART in patients with asymptomatic HIV infection and CD4 cell count >350 × 106/l. AIDS. 2002;16:1371–81. doi: 10.1097/00002030-200207050-00009. [DOI] [PubMed] [Google Scholar]
- 6.Wood E, Hogg RS, Yip B, Harrigan PR, O’Shaughnessy MV, Montaner JS. Is there a baseline CD4 cell count that precludes a survival response to modern antiretroviral therapy? AIDS. 2003;17:711–20. doi: 10.1097/00002030-200303280-00009. [DOI] [PubMed] [Google Scholar]
- 7.Garcia F, De Lazzari E, Plana M, et al. Long-term CD4+ T-cell response to highly active antiretroviral therapy according to baseline CD4+ T-cell count. J Acquir Immune Defic Syndr. 2004;36:702–13. doi: 10.1097/00126334-200406010-00007. [DOI] [PubMed] [Google Scholar]
- 8.Moore DM, Hogg RS, Yip B, et al. Discordant immunologic and virologic responses to highly active antiretroviral therapy are associated with increased mortality and poor adherence to therapy. J Acquir Immune Defic Syndr. 2005;40:288–93. doi: 10.1097/01.qai.0000182847.38098.d1. [DOI] [PubMed] [Google Scholar]
- 9.Hammer SM, Squires KE, Hughes MD, et al. AIDS Clinical Trials Group 320 Study Team. A controlled trial of two nucleoside analogues plus indinavir in persons with human immunodeficiency virus infection and CD4 cell counts of 200 per cubic millimeter or less. N Engl J Med. 1997;337:725–33. doi: 10.1056/NEJM199709113371101. [DOI] [PubMed] [Google Scholar]
- 10.Egger M, May M, Chene G, et al. Prognosis of HIV-1–infected patients starting highly active antiretroviral therapy: a collaborative analysis of prospective studies. Lancet. 2002;360:119–29. doi: 10.1016/s0140-6736(02)09411-4. [DOI] [PubMed] [Google Scholar]
- 11.Palella FJ, Jr, Deloria-Knoll M, Chmiel JS, et al. Survival benefit of initiating antiretroviral therapy in HIV-infected persons in different CD4+ cell strata. Ann Intern Med. 2003;138:620–6. doi: 10.7326/0003-4819-138-8-200304150-00007. [DOI] [PubMed] [Google Scholar]
- 12.Moore RD, Keruly JC. CD4+ cell count 6 years after commencement of highly active antiretroviral therapy in persons with sustained virologic suppression. Clin Infect Dis. 2007;44:441–6. doi: 10.1086/510746. [DOI] [PubMed] [Google Scholar]
- 13.Sterling TR, Chaisson RE, Moore RD. Initiation of highly active antiretroviral therapy at CD4+ T lymphocyte counts of >350 cells/mm3: disease progression, treatment durability, and drug toxicity. Clin Infect Dis. 2003;36:812–5. doi: 10.1086/367934. [DOI] [PubMed] [Google Scholar]
- 14.May M, Sterne JA, Sabin C, et al. Prognosis of HIV-1–infected patients up to 5 years after initiation of HAART: collaborative analysis of prospective studies. AIDS. 2007;21:1185–97. doi: 10.1097/QAD.0b013e328133f285. [DOI] [PMC free article] [PubMed] [Google Scholar]
- 15.Douek DC, Brenchley JM, Betts MR, et al. HIV preferentially infects HIV-specific CD4+ T cells. Nature. 2002;417:95–8. doi: 10.1038/417095a. [DOI] [PubMed] [Google Scholar]
- 16.Lederman MM. Immune restoration and CD4+ T-cell function with antiretroviral therapies. AIDS. 2001;15(Suppl 2):S11–5. doi: 10.1097/00002030-200102002-00003. [DOI] [PubMed] [Google Scholar]
- 17.Rabin RL, Roederer M, Maldonado Y, Petru A, Herzenberg LA, Herzenberg LA. Altered representation of naive and memory CD8 T cell subsets in HIV-infected children. J Clin Invest. 1995;95:2054–60. doi: 10.1172/JCI117891. [DOI] [PMC free article] [PubMed] [Google Scholar]
- 18.Mellors JW, Munoz A, Giorgi JV, et al. Plasma viral load and CD4+ lymphocytes as prognostic markers of HIV-1 infection. Ann Intern Med. 1997;126:946–54. doi: 10.7326/0003-4819-126-12-199706150-00003. [DOI] [PubMed] [Google Scholar]
- 19.Douek DC, Koup RA, McFarland RD, Sullivan JL, Luzuriaga K. Effect of HIV on thymic function before and after antiretroviral therapy in children. J Infect Dis. 2000;181:1479–82. doi: 10.1086/315398. [DOI] [PubMed] [Google Scholar]
- 20.Autran B, Carcelain G, Li TS, et al. Positive effects of combined antiretroviral therapy on CD4+ T cell homeostasis and function in advanced HIV disease. Science. 1997;277:112–6. doi: 10.1126/science.277.5322.112. [DOI] [PubMed] [Google Scholar]
- 21.Pakker NG, Notermans DW, de Boer RJ, et al. Biphasic kinetics of peripheral blood T cells after triple combination therapy in HIV-1 infection: a composite of redistribution and proliferation. Nat Med. 1998;4:208–14. doi: 10.1038/nm0298-208. [DOI] [PubMed] [Google Scholar]
- 22.Kaufmann GR, Perrin L, Pantaleo G, et al. CD4 T-lymphocyte recovery in individuals with advanced HIV-1 infection receiving potent antiretroviral therapy for 4 years: the Swiss HIV Cohort Study. Arch Intern Med. 2003;163:2187–95. doi: 10.1001/archinte.163.18.2187. [DOI] [PubMed] [Google Scholar]
- 23.Hunt PW, Deeks SG, Rodriguez B, et al. Continued CD4 cell count increases in HIV-infected adults experiencing 4 years of viral suppression on antiretroviral therapy. AIDS. 2003;17:1907–15. doi: 10.1097/00002030-200309050-00009. [DOI] [PubMed] [Google Scholar]
- 24.Goicoechea M, Smith DM, Liu L, et al. Determinants of CD4+ T cell recovery during suppressive antiretroviral therapy: association of immune activation, T cell maturation markers, and cellular HIV-1 DNA. J Infect Dis. 2006;194:29–37. doi: 10.1086/504718. [DOI] [PubMed] [Google Scholar]
- 25.Landay A, da Silva BA, King MS, et al. Evidence of ongoing immune reconstitution in subjects with sustained viral suppression following 6 years of lopinavir-ritonavir treatment. Clin Infect Dis. 2007;44:749–54. doi: 10.1086/511681. [DOI] [PubMed] [Google Scholar]
- 26.Mocroft A, Phillips AN, Gatell J, et al. Normalisation of CD4 counts in patients with HIV-1 infection and maximum virological suppression who are taking combination antiretroviral therapy: an observational cohort study. Lancet. 2007;370:407–13. doi: 10.1016/S0140-6736(07)60948-9. [DOI] [PubMed] [Google Scholar]
- 27.Kaufmann GR, Furrer H, Ledergerber B, et al. Characteristics, determinants, and clinical relevance of CD4 T cell recovery to <500 cells/μL in HIV type 1–infected individuals receiving potent antiretroviral therapy. Clin Infect Dis. 2005;41:361–72. doi: 10.1086/431484. [DOI] [PubMed] [Google Scholar]
- 28.Evans TG, Bonnez W, Soucier HR, Fitzgerald T, Gibbons DC, Reichman RC. Highly active antiretroviral therapy results in a decrease in CD8+ T cell activation and preferential reconstitution of the peripheral CD4+ T cell population with memory rather than naive cells. Antiviral Res. 1998;39:163–73. doi: 10.1016/s0166-3542(98)00035-7. [DOI] [PubMed] [Google Scholar]
- 29.Michael CG, Kirk O, Mathiesen L, Nielsen SD. The naive CD4+ count in HIV-1–infected patients at time of initiation of highly active antiretroviral therapy is strongly associated with the level of immunological recovery. Scand J Infect Dis. 2002;34:45–9. doi: 10.1080/00365540110076930. [DOI] [PubMed] [Google Scholar]
- 30.Shafer RW, Smeaton LM, Robbins GK, et al. Comparison of four-drug regimens and pairs of sequential three-drug regimens as initial therapy for HIV-1 infection. N Engl J Med. 2003;349:2304–15. doi: 10.1056/NEJMoa030265. [DOI] [PMC free article] [PubMed] [Google Scholar]
- 31.Gandhi RT, Spritzler J, Chan E, et al. Effect of baseline- and treatment-related factors on immunologic recovery after initiation of antiretroviral therapy in HIV-1–positive subjects: results from ACTG 384. J Acquir Immune Defic Syndr. 2006;42:426–34. doi: 10.1097/01.qai.0000226789.51992.3f. [DOI] [PubMed] [Google Scholar]
- 32.Robbins GK, De Gruttola V, Shafer RW, et al. Comparison of sequential three-drug regimens as initial therapy for HIV-1 infection. N Engl J Med. 2003;349:2293–303. doi: 10.1056/NEJMoa030264. [DOI] [PMC free article] [PubMed] [Google Scholar]
- 33.Kalayjian RC, Landay A, Pollard RB, et al. Age-related immune dysfunction in health and in human immunodeficiency virus (HIV) disease: association of age and HIV infection with naive CD8+ cell depletion, reduced expression of CD28 on CD8+ cells, and reduced thymic volumes. J Infect Dis. 2003;187:1924–33. doi: 10.1086/375372. [DOI] [PubMed] [Google Scholar]
- 34.Lange CG, Lederman MM, Medvik K, et al. Nadir CD4+ T-cell count and numbers of CD28+ CD4+ T-cells predict functional responses to immunizations in chronic HIV-1 infection. AIDS. 2003;17:2015–23. doi: 10.1097/00002030-200309260-00002. [DOI] [PubMed] [Google Scholar]
- 35.Mildvan D, Bosch RJ, Kim RS, et al. Immunophenotypic markers and antiretroviral therapy (IMART): T cell activation and maturation help predict treatment response. J Infect Dis. 2004;189:1811–20. doi: 10.1086/383277. [DOI] [PubMed] [Google Scholar]
- 36.Brenchley JM, Price DA, Schacker TW, et al. Microbial translocation is a cause of systemic immune activation in chronic HIV infection. Nat Med. 2006;12:1365–71. doi: 10.1038/nm1511. [DOI] [PubMed] [Google Scholar]
- 37.Baker JV, Peng G, Rapkin J, et al. CD4+ count and risk of non-AIDS diseases following initial treatment for HIV infection. AIDS. 2008;22:841–8. doi: 10.1097/QAD.0b013e3282f7cb76. [DOI] [PMC free article] [PubMed] [Google Scholar]
- 38.El-Sadr WM, Lundgren JD, Neaton JD, et al. CD4+ count–guided interruption of antiretroviral treatment. N Engl J Med. 2006;355:2283–96. doi: 10.1056/NEJMoa062360. [DOI] [PubMed] [Google Scholar]
- 39.Barber DL, Wherry EJ, Masopust D, et al. Restoring function in exhausted CD8 T cells during chronic viral infection. Nature. 2006;439:682–7. doi: 10.1038/nature04444. [DOI] [PubMed] [Google Scholar]
- 40.Brodie SJ, Patterson BK, Lewinsohn DA, et al. HIV-specific cytotoxic T lymphocytes traffic to lymph nodes and localize at sites of HIV replication and cell death. J Clin Invest. 2000;105:1407–17. doi: 10.1172/JCI8707. [DOI] [PMC free article] [PubMed] [Google Scholar] [Retracted]
- 41.Silverberg MJ, Neuhaus J, Bower M, et al. Risk of cancers during interrupted antiretroviral therapy in the SMART study. AIDS. 2007;21:1957–63. doi: 10.1097/QAD.0b013e3282ed6338. [DOI] [PubMed] [Google Scholar]
- 42.Henry K, Katzenstein D, Cherng DW, et al. A pilot study evaluating time to CD4 T-cell count <350 cells/mm3 after treatment interruption following antiretroviral therapy ± interleukin 2: results of ACTG A5102. J Acquir Immune Defic Syndr. 2006;42:140–8. doi: 10.1097/01.qai.0000225319.59652.1e. [DOI] [PubMed] [Google Scholar]
- 43.Ananworanich J, Gayet-Ageron A, Le Braz M, et al. CD4-guided scheduled treatment interruptions compared with continuous therapy for patients infected with HIV-1: results of the Staccato randomised trial. Lancet. 2006;368:459–65. doi: 10.1016/S0140-6736(06)69153-8. [DOI] [PubMed] [Google Scholar]


