

Abstract
Background and Purpose
Carotid intima-media thickness (IMT) is a surrogate marker of subclinical atherosclerosis and a strong predictor of stroke and myocardial infarction. The object of this study was to determine the association between carotid IMT and 702 single nucleotide polymorphisms in 145 genes.
Methods
B-mode carotid ultrasound was performed among 408 Hispanics from the Northern Manhattan Study. The common carotid artery IMT and bifurcation IMT were phenotypes of interest. Genetic effects were evaluated by the multivariate regression model adjusting for traditional vascular risk factors. For each individual, we calculated a gene risk score (GRS) defined as the total number of the significant single nucleotide polymorphisms in different genes. Subjects were then divided into 3 GRS categories using the 2 cutoff points: mean GRS ±1 SD.
Results
We identified 6 significant single nucleotide polymorphisms in 6 genes for common carotid artery IMT and 7 single nucleotide polymorphisms in 7 genes for bifurcation IMT using the probability value of 0.005 as the significant level. There were no common significant genes for both phenotypes. The most significant genes were the tissue plasminogen activator (P=0.0005 for common carotid artery IMT) and matrix metallopeptidase-12 genes (P=0.0004 for bifurcation IMT). Haplotype analysis did not yield a more significant result. Subjects with GRS ≥9 had significantly increased IMT than those with GRS ≤5 (P<0.001). GRS was an independent predictor of both common carotid artery IMT (P=2.3×10⁻⁹) and bifurcation MT (P=7.2×10⁻⁸).
Conclusions
Multiple genes contributed to the variation in carotid IMT. IMT in different carotid segments may be regulated by different sets of susceptibility genes.
Keywords: atherosclerosis, carotid intima-media thickness, genetics, polymorphism
Stroke is a multifactorial disease and genetic factors contribute to its pathogenesis. Measurement of carotid intima-media thickness (IMT) is a well-established surrogate marker of subclinical atherosclerosis and is associated with increased risk of stroke and cardiovascular disease.1 Family studies have demonstrated appreciable heritability of IMT,2 which warrants identification of susceptibility genes to the phenotypic variation in IMT. Previous studies investigating a limited number of candidate genes in association with subclinical atherosclerosis have reported some promising quantitative trait loci.3 Due to the advance of genotyping technologies, it is now possible to genotype a large number of single nucleotide polymorphisms (SNPs) by high-throughput platforms. These new technologies provide a unique opportunity to conduct more comprehensive genetic association studies by exploring a large number of candidate genes and to yield better insight to the complex pathogenesis of atherosclerosis.
There is no consensus on which carotid arterial site can serve as a better proxy of clinical cardiovascular outcomes. Each segment of carotid artery has its own unique anatomy and hemodynamic environment and therefore is prone to different pathophysiological mechanisms. It has been suggested that the intimal thickening in the common carotid artery (CCA) is more representative of the total body atherosclerosis burden, whereas the IMT in the internal carotid artery (ICA) represents primarily a focal atherosclerotic process in response to the local turbulent flow.4 Because both the traditional cardiovascular risk factors and hemodynamic surroundings have differential influences on the CCA, carotid bulb, and ICA,5 the proatherosclerotic genes may have various contributions to different carotid segments.
To explore the genetic determinants of carotid atherosclerosis, we selected 145 candidate genes involved in pathophysiology of atherosclerosis. They included genes associated with the extracellular matrix remodeling, hemostasis, endothelium function, renin–angiotensin system, inflammation, antioxidation, and glucose and lipid metabolism. We investigated the relationships between SNPs in these candidate genes and carotid segment-specific IMT among a Caribbean-Hispanic population from the North Manhattan Study (NOMAS). In addition to a single gene effect, we also evaluated the combined effect of multiple genes on carotid IMT.
Materials and Methods
Study Population
The study subjects were drawn from the prospective community-based NOMAS cohort (53.1% Hispanics, 23.7% blacks, 20.1% whites, 3.1% others).6 Four hundred eight subjects fulfilling the following criteria were enrolled in the present study: (1) self-identification to be of Hispanic/Spanish origin through a series of interview questions modeled after the US census; (2) carotid ultrasound performed; and (3) DNA sample available for genetic studies. Our Hispanic population consisted of 62% Dominicans, 13% Puerto Ricans, 11% Cubans, and 14% other Hispanics.7 Vascular risk factors, including body mass index, body weight, smoking history, diabetes, and hypertension,7 were inquired and fasting blood samples were analyzed for blood sugar, high-(HDL-C) and low-density lipoprotein cholesterol, total cholesterol, and triglycerides. The study was approved by the Columbia University Medical Center Institutional Review Board.
Intima-Media Thickness Measurement
Carotid IMT was assessed by high-resolution B-mode ultrasound (Diasonics 2D-Gateway) with modification from the Atherosclerosis Risk in Communities protocol.8 The IMT scanning consists of the near and far wall of CCA, carotid bifurcation (Bif), and ICA in the plaque-free area.8 Measurements were performed by the M’Ath automatic computerized edge tracking systems (Canevas).9 Our interreader and intrareader correlation coefficients were 0.77 and 0.94, respectively.
Genes and Single Nucleotide Polymorphism Selection
One hundred forty-five candidate genes with functional relevance to atherosclerosis were selected (Supplemental Table I, available online at http://stroke.ahajournals.org). The candidate SNPs were selected according to the following criteria: (1) SNPs leading to amino acid changes; (2) SNPs have been examined in previous studies; (3) SNPs located at evolutionarily conserved sequence homology (http://genome.lbl.gov/vista/index.shtml); (4) tagging SNPs across different human populations (http://pga.gs.washington.edu); and (5) functional SNPs. Any eligible SNP needs to have a minor allele frequency >0.05 and been submitted to the dbSNP database by more than one source. In addition, to reduce SNP loci that can be tagged by each other, an attempt was made to select SNPs with a distance of more than 3000 base pairs. SNP genotyping was performed using the GoldenGate Assay (Illumina Inc, San Diego, Calif).10 The final set consisted of 702 SNPs that covered a genomic region of 6.7 Mb. The average and median number of candidate SNPs at each gene were 4.8 and 4 (range, 3 to 15), respectively.
Statistical Analysis
Statistical analysis was performed by SAS 9.0 software (SAS Institute Inc, Cary, NC). Hardy-Weinberg equilibrium was computed by a χ2 goodness-of-fit test. A probability value of 0.01 was used as an indication of deviation from Hardy-Weinberg equilibrium because of a large number of SNPs (n=702) tested. Thirty-six SNPs were not in Hardy-Weinberg equilibrium and were excluded from the subsequent analysis. According to our previous heritability results, IMT in the ICA was under weaker genetic influences than in the carotid bifurcation or in the CCA.11 Therefore, the present study only focused on IMT in the CCA (CCA_IMT) and in the Bif (Bif_IMT).
Clinical parameters (age, sex, body mass index, body weight, smoking, diabetes, hypertension, serum level of total cholesterol, low-density lipoprotein cholesterol, HDL-C, triglycerides) were assessed by univariate regression to determine significant predictors of IMT. Pearson correlation was used to determine the relationships between IMT in any 2 of the 3 segments. Associations between SNPs and IMT were evaluated by multivariate regression after adjusting for significant covariates. We used 3 models (assuming the rare allele had an additive, dominant, or recessive effect) to evaluate the genetic effects on IMT. A threshold of P<0.005 was used as a cutoff level of significance. Significant SNPs were considered in the subsequent analyses of combined genetic effects and in the analyses of the gene–gene interactions by including interaction terms in the regression models. Haploview software was used to define haplotype blocks of each gene12 and the Hap-Clustering program for the haplotype analysis.13
For each individual, we computed a gene risk score (GRS) defined as the total number of the independent risk SNPs that were associated with Bif_IMT or CCA_IMT at the significant level of 0.005. For a gene having more than one significant SNP, we used regression analysis to identify their independency of contribution to IMT variation. The contribution of GRS to the IMT variance was assessed using a regression model adjusting for significant covariates. We performed bootstrap permutation to estimate the precision of test statistics obtained from GRS. The null distribution of the test statistics was generated by randomly taking 13 genes out of the 145 genes and using the most significant SNP in each gene to calculate a simulated GRS. Multivariate regression analysis was performed to evaluate the associations between simulated GRS and IMT. The empirical probability values are calculated as (R+1)/(N+1) where R is the number of times the permuted test yielded a probability value less than the observed probability value and N is the number of iterations in the permutation test. Subjects were then divided into 3 GRS categories using the 2 cutoff points: mean GRS −1 SD and mean GRS +1 SD. The adjusted CCA_IMT and Bif_IMT in the 3 GRS categories were compared by analysis of variance and a post hoc pairwise test using the Scheffe correction.
Results
Clinical characteristics for the 408 participants are presented in Table 1. The mean age was 64.5 years (range, 50 to 91 years); 45% were men. The average IMT (mm) was 0.91±0.09 in CCA, 0.92±0.09 in the Bif, and 0.83±0.07 in ICA. The CCA_IMT and Bif_IMT were moderately correlated (Pearson correlation coefficient=0.46, P<0.001), and the correlation coefficients between ICA_IMT and the 2 other measurements were 0.43 (Bif_IMT) and 0.37 (CCA_IMT), respectively (P<0.001). In univariate analysis, increased CCA_IMT was significantly associated with increased age and body weight and hypertension (Table 1). In contrast, increased Bif_IMT was associated with men and decrease in HDL-C levels.
Table 1.
Association Between Carotid IMT and Vascular Risk Factors (Univariate Regression Analysis)
| Regression Coefficient β×102 (95% CI) |
||||
|---|---|---|---|---|
| Vascular Risk Factors | Mean±SD or Percent | CCA_IMT | Bif_IMT | ICA_IMT |
| Age, years | 64.5±7.4 | 0.25 (0.14–0.37)‡ | 0.12 (0.00–0.24) | 0.02 (−0.07–0.12) |
| Male | 45.3% | 0.70 (−1.05–2.46) | 2.80 (1.02–4.58)† | 2.30 (0.92–3.68)† |
| Total cholesterol, mmol/L | 5.14±0.96 | 0.57 (−0.33–1.47) | −0.83 (−1.75–0.10) | −0.16 (−0.89–0.56) |
| LDL-C, mmol/L | 3.29±0.86 | 0.86 (−0.16–1.88) | −0.47 (−1.53–0.59) | 0.20 (−0.62–1.03) |
| HDL-C, mmol/L | 1.10±0.33 | −1.24 (−3.85–1.38) | −3.09 (−5.79–0.39)* | −1.59 (−3.69–0.52) |
| Triglyceride, mmol/L | 1.63±0.92 | −0.00 (−0.94–0.94) | −0.35 (−1.32–0.63) | −0.30 (−1.06–0.46) |
| Weight, kg | 74.2±13.5 | 0.03 (0.00–0.06)* | 0.01 (−0.02–0.04) | 0.01 (−0.01–0.03) |
| Diabetes | 24.5% | 1.56 (−0.47–3.59) | 2.04 (−0.03–4.12) | 1.43 (−0.19–3.04) |
| Hypertension | 74.3% | 2.93 (0.95–4.91)† | 0.44 (−1.61–2.49) | −0.68 (−2.27–0.90) |
| Former smoker | 37.3% | 0.82 (−0.99–2.63) | 1.25 (−0.60–3.10) | 0.67 (−0.77–2.11) |
| Current smoker | 14.0% | 1.68 (−0.84–4.20) | 0.65 (−1.94–3.23) | 0.20 (−1.82–2.22) |
P<0.05.
P<0.01.
P<0.001.
LDL-C indicates low-density lipoprotein cholesterol.
SNPs in 13 genes were significantly associated with CCA_IMT or Bif_IMT after adjusting for age, sex, body weight, hypertension, and HDL-C levels (P<0.005; Table 2). For these 13 “significant” genes, only one SNP of each gene reached the significant level of 0.005. SNPs in 6 genes were found to be predictors of CCA_IMT. They included the tissue plasminogen activator (PLAT), thrombospondin 1 (THBS1), nitric oxide synthase 1 (NOS1), P-selectin (SELP), sodium channel 1 β (SCNN1B), and chemochine (C-X-C motif) ligand 12 (CXCL12) genes. None of the polymorphisms in these genes were associated with Bif_IMT. SNPs significantly associated with Bif_IMT were in the following genes: matrix metallopeptidase 12 and 3 (MMP12 and MMP3), transforming growth factor β2 (TGFB2), angiotensin I converting enzyme (ACE), prostaglandin-endoperoxide synthase 2 (PTGS2, aka cyclo-oxygenase-2 [COX-2]), renin (REN), and paraoxonase 1 (PON1). We did not find any significant gene–gene interactions among these significant genes for either CCA_IMT or Bif_IMT. For haplotype analysis, we found that rs6658835–rs12097734 in TGFB2 had the most significant haplotype specific probability value of 0.0021 for Bif_IMT (Supplemental Table II). Seven genes (PON1, CXCL12, ACE, SCNN1B, SELP, MMP3, and THBS1) yielded haplotype-specific probability values between 0.0052 and 0.0466. PTGS2, REN, NOS1, MMP12, and PLAT genes did not show any significant results (all probability values >0.05) for either CCA_IMT or Bif_IMT.
Table 2.
Association Between Carotid IMT and Significant Genes (Multivariate Regression Analysis)
|
β (P) |
|||||
|---|---|---|---|---|---|
| Category | Gene Symbol, Official Name | SNP | Risk Genotype | CCA_IMT | Bif_IMT |
| Hemostasis | PLAT, tissue plasminogen activator | rs879293 | AG, GG | 0.044 (0.0005) | 0.013 (0.323) |
| THBS1, thrombospondin 1 | rs2292305(Ala523Thr) | GG | 0.054 (0.0037) | 0.029 (0.147) | |
| Extracellular matrix remodeling | MMP12, matrix metallopeptidase 12 | rs11225442 | AA | 0.024 (0.336) | 0.094 (0.0004) |
| MMP3, matrix metallopeptidase 3 | rs655403 | AA | 0.039 (0.441) | 0.173 (0.0010) | |
| TGFB2, transforming growth factor beta 2 | rs12097734 | AG | 0.009 (0.547) | 0.048 (0.0014) | |
| Endothelium function | NOS1, nitric oxide synthase 1 | rs2293050 | AG, GG | 0.035 (0.0007) | 0.009 (0.421) |
| SELP, P-selectin | rs3766126 | CC, AC | 0.019 (0.0049) | 0.006 (0.396) | |
| Renin-angiotensin system | SCNN1B, sodium channel 1 beta | rs152740 | AT, TT | 0.027 (0.0039) | 0.008 (0.419) |
| ACE, angiotensin I converting enzyme | rs8066276 | AG, GG | 0.016 (0.112) | 0.034 (0.0019) | |
| REN, renin | rs1464816 | AA, AC | 0.011 (0.183) | 0.026 (0.0037) | |
| Inflammation | CXCL12, chemochine (C-X-C motif) ligand 12 | rs2297630 | GG | 0.026 (0.0043) | 0.003 (0.707) |
| PTGS2, prostaglandin-endoperoxide synthase 2 | rs20417(G-765C) | GG | 0.025 (0.237) | 0.066 (0.0032) | |
| Antioxidation | PON1, paraoxonase 1 | rs662(Gln192Arg) | AG, GG | 0.003 (0.671) | 0.018 (0.0044) |
The average GRS was 6.9±1.7 (range, 0 to 12). In the multivariate regression model, a higher GRS was significantly associated with increased CCA_IMT and Bif_IMT (P=2.3×10⁻⁹ and 7.2×10⁻⁸, respectively; Table 3). The empirical probability value in 500 000 permutations was 2×10⁻⁶ for both CCA_IMT and Bif_IMT. The GRS explained a greater proportion of IMT variation than other covariates (r2gene versus r2covariate=8.9% versus 7.5% for CCA_IMT; 7.2% versus 4.1% for Bif_IMT). For CCA_IMT, the effect size of the GRS was comparable to an effect of a 5-year increment in age (β=0.015 per 1-U increase in GRS; β=0.014 per 5-year increase in age).
Table 3.
The Phenotype Variation (R2) and Effect Size (β) of Covariates and Gene Risk Score
| CCA_IMT |
Bif_IMT |
|||
|---|---|---|---|---|
| Covariates* | β | P | β | P |
| Age ×5 years | 0.014 | 1.6×10⁻⁶ | 0.008 | 0.010 |
| Male sex | 0.000 | NS | 0.021 | 0.024 |
| Weight×5 kg | 0.003 | 0.028 | 0.001 | NS |
| HDL-C×0.13 mmol/L | −0.001 | NS | −0.003 | NS |
| Hypertension | 0.013 | NS | −0.006 | NS |
| GRS | 0.015 | Nominal P=2.3×10⁻⁹ | 0.014 | Nominal P=7.2×10⁻⁸ |
| empirical P=2×10⁻⁶ | empirical P=2×10⁻⁶ | |||
| R2gene=8.9%, R2covariate=7.5% | R2gene=7.2%, R2covariate=4.1% | |||
Only covariates significantly associated with IMT in the univariate regression are included. NS indicates P≥0.05.
Based on the 2 GRS cutoff points, subjects were then divided into low- (0 to 5), intermediate- (6 to 8), and high-risk (9 to 12) groups. A dose–response relationship was observed between IMT and the 3 GRS categories (Figure). The average CCA_IMT in the low-, intermediate-, and high-risk groups were 0.87±0.08, 0.91±0.08, and 0.94±0.09 mm, and average Bif_IMT were 0.90±0.07, 0.92±0.08, and 0.96±0.13 mm, respectively. The high-risk GRS group had significantly higher CCA_IMT and Bif_IMT than the low-risk group (P<0.001).
Figure.
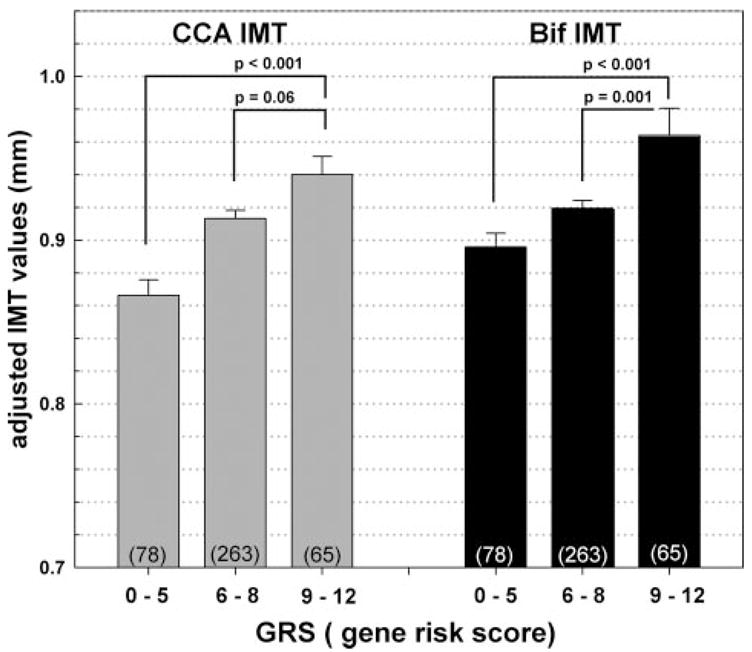
The relationship between the 3 GRS groups and CCA_IMT and Bif_IMT. IMT were adjusted for age, sex, body weight, HDL-C, and hypertension. The 3 GRS groups were defined based on mean±1 SD. The number of subjects in each GRS category is shown in parentheses.
Discussion
We found SNPs in 13 candidate genes associated with carotid IMT in a Hispanic population. These genes are involved in hemostasis (PLAT, THBS1), extracellular matrix remodeling (MMP3, MMP12, TGFB2), inflammation (CXCL12, PTGS2), antioxidation (PON1), endothelium function (NOS1, SELP), and the renin–angiotensin system (SCNN1B, ACE, REN). A cumulative effect of these genes explained a significant variation in carotid IMT. Subjects with multiple risk genotypes (ie, high GRS) had significantly increased IMT. The effects of genetic and vascular risk factors varied between carotid artery segments, which was most likely due to different anatomy, hemodynamics, and pathogenic mechanisms of atherosclerosis.
Six SNPs were significantly associated with CCA_IMT, which are located in the PLAT, THBS1, NOS1, SELP, CXCL12, and SCNN1B genes. Elevated serum levels of tissue plasminogen activator (encoded by PLAT) have been reported to be associated with worse IMT.14 Our study is in accordance with the results from the study by de Maat et al,15 which showed that polymorphisms in PLAT accounted for the IMT variation in the general population. We also found that the nonsynonymous polymorphism rs2292305 (Ala523Thr) in THBS1 was associated with increased IMT. In a large study of 2850 subjects, the THBS1 Ans700Ser polymorphism was a significant risk factor for myocardial infarction.16 Because thrompospondin-1 (encoded by THBS1) can enhance vascular smooth muscle cell proliferation and adhesion molecules expression,17,18 it could accelerate the atherosclerotic process in carotid and coronary arteries.
SELP and CXCL12 may initiate the atherosclerosis cascade in CCA_IMT. P-selectin (encoded by SELP) may recruit the monocytes to injured endothelium, and the stromal cell-derived cell factor (encoded by CXCL12) may further trigger the monocyte differentiation toward macrophage.19 Our results showed that both genes conferred susceptibility to carotid atherosclerosis. In concert with our findings, Koyama et al demonstrated a positive correlation between the expression level of P-selectin and carotid IMT.20 The association between CXCL12 polymorphisms and IMT also has been reported by Coll et al in HIV-infected patients.21 Although the other 2 significant genes (SCNN1B and NOS1) in our study have not been frequently investigated in IMT, plenty of evidence is available to support their genetic effects on atherosclerosis. For example, the neuronal nitric oxide synthase (encoded by NOS1) could suppress neointimal formation in mouse carotid arteries,22 and polymorphisms in SCNN1B have been implicated in blood pressure regulation23 and consequently influenced the atherosclerotic process.
Among the 7 genes significantly related to Bif_IMT in the present study, 4 of them (ACE, PON1, PTGS2, and MMP3) have been reported by other investigators. Based on the meta-analysis,24 the ACE Ins/Del polymorphism had significant influence on CCA_IMT in whites and Asians. In Hispanics, we found a similar effect for Bif_IMT, although a direct comparison cannot be made because these studies analyzed different genetic polymorphisms. Similar to our findings, the study by Rauramaa et al showed a positive association between the MMP3 polymorphism and Bif_ IMT.25 However, a recent study of 1000 subjects reported an association of MMP3 polymorphism with IMT only among patients with hypertension.26
We found the G allele of the nonsynonymous SNP rs662 in PON1 to be significantly associated with increased IMT. Previous reports on the associations between PON1 and IMT among whites and blacks have been inconclusive.27,28 PON1 exerts an antiatherogenic effect by protecting low-density lipoprotein cholesterol particles against oxidation. Because the Gln(A)→ Arg(G) substitution causes a lower PON1 activity,29 it partly may have explained the finding that Arg(G) carriers had a higher risk for stroke30 and possibly increased IMT as shown in this study. We also found that the G allele of PTGS2 rs20417 (G-765C) had a detrimental effect on IMT. This observation is consistent with the previous reports, in which the G→C substitution resulted in lower transcription efficacy, diminished inflammatory response, lower IMT values, and reduced stroke risk.31,32
The 3 significant genes related to Bif_IMT (MMP12, TGFB2, and REN) in our study have been rarely investigated in the association studies. In transgenic animal models, the overexpression of MMP12 caused extensive atherosclerosis in the aorta and coronary arteries.33 The transforming growth factor β2 encoded by TGFB2 was shown to stimulate the matrix production and to have a regulatory role in inflammation.34 We observed a significant association between SNPs in genes associated with renin–angiotensin metabolism (ACE and REN) and Bif_IMT. Although renin (encoded by REN) regulates the first step of the renin–angiotensin pathway, its association with atherosclerosis has rarely been studied.
Our results suggest that IMT in CCA and IMT in Bif may be controlled by a different set of genes. The genes involved in hemostasis and endothelial function seem to have a greater effect on CCA_IMT, whereas the genes involved in extracellular matrix remodeling and the renin–angiotensin system may have greater influence on Bif_IMT. Similar to this finding, the quantitative trait loci of ICA_IMT and CCA_IMT was mapped to different genomic regions in the Framingham Heart Study Offspring Study.35 Different anatomic and hemodynamic features in CCA and Bif may interact with unique set of genes involved in particular pathogenic pathways of IMT development. It has been shown that laminar flow and oscillatory shear stress trigger diverse endothelium responses and gene expressions.36,37 In vitro, an increased level of arterial shear stress induces endothelial quiescence and an atheroprotective gene expression profile. Low shear stress, which is prevalent at atherosclerosis-prone sites, stimulates an atherogenic phenotype.38 These findings suggest that changes in levels of shear stress influence the arterial wall responses form less to more proliferative phenotypes, which may underlie observed differences in genetic effects on CCA IMT and BIF IMT. Information on genetic contributions to the different segments of carotid IMT is limited2 and needs further research.
We used GRS as a single measure to estimate a cumulative effect of the genes significantly associated with IMT. The GRS accounted for a substantial variance in both CCA_IMT and Bif_IMT. In the epidemiological studies, IMT was an independent risk factor for stroke and other vascular diseases even after adjusting for dyslipidemia, diabetes, and other vascular risk factors.39 Therefore, genetic contributions may provide additional information to the IMT variance and improve the models to predict stroke beyond traditional risk factors. The high-risk group (GRS ≥9) had significantly increased IMT than the low-risk group regardless of the composition of susceptible genes (Figure). Use of the GRS may simplify an assessment of multiple gene effects in complex diseases and may provide a better estimate of individual susceptibility to atherosclerosis.
The present study has several limitations. First, a large number of SNPs tested in this study may raise a concern of inappropriate correction for multiple testing. However, the candidate genes are selected based on a priori hypothesis and they are biologically correlated. A very conservative statistical correction such as Bonferroni’s correction would reject most of the biologically important findings in a polygenetic trait like atherosclerosis. Instead of performing permutation test for individual SNPs, we use bootstrap permutation to test the statistical precision of GRS. The highly significant probability values for the GRS have emphasized the contribution of these genes to increased IMT. Our results support that using cumulative effects from multiple genes is more advantageous in identifying susceptibility genes in complex diseases, especially when the genetic effect of individual gene is expected to be modest. Second, current sample size may restrict our ability to identify gene–gene or gene–environment interactions. We also acknowledge that the spare spacing of SNPs may attenuate the power to detect a true association in some candidate genes and some of the functional SNPs could not have been genotyped by the Illumina BeadArray technology. Although the present study focuses on a single ethnic group, we cannot exclude the possibility of population substructure in our participants. Finally, some technical issues such as a difference in the reliability of IMT measurements in CCA and Bif may contribute to the different effects of genetic and vascular risk factors between these 2 carotid segments. The reliability of IMT measurements in our laboratory is high8 and comparable to the results from other large epidemiological studies and therefore less likely influenced our results.
Summary
This is the first study to screen a large number of susceptibility genes for carotid IMT in a population-based sample of Caribbean Hispanics. We have found 13 candidate genes contributing to the variation of carotid IMT. Several of them (MMP12, SELP, NOS1, THBS1, TGFB2, SCNN1B, and REN) have never been reported in association with carotid IMT. Also, we report a cumulative effect of several genes on IMT. Although these findings need to be replicated in different populations, our observation may provide a potential direction for the future gene–IMT association studies. Given the discrepancy between the genetic contributions to CCA_IMT and Bif_IMT, we believe that IMT in different carotid segments should be treated as separate phenotypes.
Supplementary Material
Acknowledgments
Sources of Funding
This work was supported by grants from the National Institute of Neurological Disorders and Stroke R01 NS40807 (S.-H.H.J., T.R., R.L.S.), RO1 NS047655 (S.-H.H.J., T.R., R.L.S., R.C.), RO1 NS29993 (R.L.S., T.R.), the Irving General Clinical Research Center (2 M01 RR00645), and the National Health Research Institutes (Taiwan) NHRI-Ex96-9607 (S.-H.H.J., H.F.L., Y.-C.L.).
Footnotes
Disclosures
None.
References
- 1.O’Leary DH, Polak JF, Kronmal RA, Manolio TA, Burke GL, Wolfson SK., Jr Carotid-artery intima and media thickness as a risk factor for myocardial infarction and stroke in older adults. Cardiovascular Health Study Collaborative Research Group. N Engl J Med. 1999;340:14 –22. doi: 10.1056/NEJM199901073400103. [DOI] [PubMed] [Google Scholar]
- 2.Fox CS, Polak JF, Chazaro I, Cupples A, Wolf PA, D’Agostino RA, O’Donnell CJ. Genetic and environmental contributions to atherosclerosis phenotypes in men and women: heritability of carotid intima-media thickness in the Framingham Heart Study. Stroke. 2003;34:397–401. doi: 10.1161/01.str.0000048214.56981.6f. [DOI] [PubMed] [Google Scholar]
- 3.Humphries SE, Morgan L. Genetic risk factors for stroke and carotid atherosclerosis: Insights into pathophysiology from candidate gene approaches. Lancet Neurol. 2004;3:227–235. doi: 10.1016/S1474-4422(04)00708-2. [DOI] [PubMed] [Google Scholar]
- 4.Crouse JR, Goldbourt U, Evans G, Pinsky J, Sharrett AR, Sorlie P, Riley W, Heiss G. Risk factors and segment-specific carotid arterial enlargement in the Atherosclerosis Risk In Communities (ARIC) cohort. Stroke. 1996;27:69–75. doi: 10.1161/01.str.27.1.69. [DOI] [PubMed] [Google Scholar]
- 5.Schott LL, Wildman RP, Brockwell S, Simkin-Silverman LR, Kuller LH, Sutton-Tyrrell K. Segment-specific effects of cardiovascular risk factors on carotid artery intima-medial thickness in women at midlife. Arterioscler Thromb Vasc Biol. 2004;24:1951–1956. doi: 10.1161/01.ATV.0000141119.02205.6b. [DOI] [PubMed] [Google Scholar]
- 6.Sacco RL, Anand K, Lee HS, Boden-Albala B, Stabler S, Allen R, Paik MC. Homocysteine and the risk of ischemic stroke in a triethnic cohort: the Northern Manhattan Study. Stroke. 2004;35:2263–2269. doi: 10.1161/01.STR.0000142374.33919.92. [DOI] [PubMed] [Google Scholar]
- 7.Rodriguez CJ, Sciacca RR, Diez-Roux AV, Boden-Albala B, Sacco RL, Homma S, DiTullio MR. Relation between socioeconomic status, race–ethnicity, and left ventricular mass: the Northern Manhattan Study. Hypertension. 2004;43:775–779. doi: 10.1161/01.HYP.0000118055.90533.88. [DOI] [PMC free article] [PubMed] [Google Scholar]
- 8.Rundek T, Elkind MS, Pittman J, Boden-Albala B, Martin S, Humphries SE, Juo SH, Sacco RL. Carotid intima-media thickness is associated with allelic variants of stromelysin-1, interleukin-6, and hepatic lipase genes: the Northern Manhattan Prospective Cohort Study. Stroke. 2002;33:1420–1423. doi: 10.1161/01.STR.0000015558.63492.B6. [DOI] [PMC free article] [PubMed] [Google Scholar]
- 9.Touboul PJ, Prati P, Scarabin PY, Adrai V, Thibout E, Ducimetiere P. Use of monitoring software to improve the measurement of carotid wall thickness by B-mode imaging. J Hypertens Suppl. 1992;10:S37–S41. [PubMed] [Google Scholar]
- 10.Shen R, Fan JB, Campbell D, Chang W, Chen J, Doucet D, Yeakley J, Bibikova M, Wickham Garcia E, McBride C, Steemers F, Garcia F, Kermani BG, Gunderson K, Oliphant A. High-throughput SNP genotyping on universal bead arrays. Mutat Res. 2005;573:70–82. doi: 10.1016/j.mrfmmm.2004.07.022. [DOI] [PubMed] [Google Scholar]
- 11.Juo SH, Rundek T, Lin HF, Cheng R, Lan MY, Huang JS, Boden-Albala B, Sacco RL. Heritability of carotid artery distensibility in Hispanics: the Northern Manhattan Family Study. Stroke. 2005;36:2357–2361. doi: 10.1161/01.STR.0000185926.05011.72. [DOI] [PMC free article] [PubMed] [Google Scholar]
- 12.Barrett JC, Fry B, Maller J, Daly MJ. Haploview: analysis and visualization of LD and haplotype maps. Bioinformatics. 2005;21:263–265. doi: 10.1093/bioinformatics/bth457. [DOI] [PubMed] [Google Scholar]
- 13.Tzeng JY, Wang CH, Kao JT, Hsiao CK. Regression-based association analysis with clustered haplotypes through use of genotypes. Am J Hum Genet. 2006;78:231–242. doi: 10.1086/500025. [DOI] [PMC free article] [PubMed] [Google Scholar]
- 14.Salomaa V, Stinson V, Kark JD, Folsom AR, Davis CE, Wu KK. Association of fibrinolytic parameters with early atherosclerosis. The ARIC study. Atherosclerosis Risk In Communities study. Circulation. 1995;91:284–290. doi: 10.1161/01.cir.91.2.284. [DOI] [PubMed] [Google Scholar]
- 15.de Maat MP, Bladbjerg EM, Drivsholm T, Borch-Johnsen K, Moller L, Jespersen J. Inflammation, thrombosis and atherosclerosis: results of the Glostrup study. J Thromb Haemost. 2003;1:950–957. doi: 10.1046/j.1538-7836.2003.00213.x. [DOI] [PubMed] [Google Scholar]
- 16.Zwicker JI, Peyvandi F, Palla R, Lombardi R, Canciani MT, Cairo A, Ardissino D, Bernardinelli L, Bauer KA, Lawler J, Mannucci P. The thrombospondin-1 N700S polymorphism is associated with early myocardial infarction without altering von Willebrand factor multimer size. Blood. 2006;108:1280–1283. doi: 10.1182/blood-2006-04-015701. [DOI] [PMC free article] [PubMed] [Google Scholar]
- 17.Roth JJ, Gahtan V, Brown JL, Gerhard C, Swami VK, Rothman VL, Tulenko TN, Tuszynski GP. Thrombospondin-1 is elevated with both intimal hyperplasia and hypercholesterolemia. J Surg Res. 1998;74:11–16. doi: 10.1006/jsre.1997.5209. [DOI] [PubMed] [Google Scholar]
- 18.Narizhneva NV, Razorenova OV, Podrez EA, Chen J, Chandrasekharan UM, DiCorleto PE, Plow EF, Topol EJ, Byzova TV. Thrombospondin-1 up-regulates expression of cell adhesion molecules and promotes monocyte binding to endothelium. Faseb J. 2005;19:1158 –1160. doi: 10.1096/fj.04-3310fje. [DOI] [PMC free article] [PubMed] [Google Scholar]
- 19.Bleul CC, Fuhlbrigge RC, Casasnovas JM, Aiuti A, Springer TA. A highly efficacious lymphocyte chemoattractant, stromal cell-derived factor 1 (SDF-1) J Exp Med. 1996;184:1101–1109. doi: 10.1084/jem.184.3.1101. [DOI] [PMC free article] [PubMed] [Google Scholar]
- 20.Koyama H, Maeno T, Fukumoto S, Shoji T, Yamane T, Yokoyama H, Emoto M, Shoji T, Tahara H, Inaba M, Hino M, Shioi A, Miki T, Nishizawa Y. Platelet P-selectin expression is associated with atherosclerotic wall thickness in carotid artery in humans. Circulation. 2003;108:524–529. doi: 10.1161/01.CIR.0000081765.88440.51. [DOI] [PubMed] [Google Scholar]
- 21.Coll B, Alonso-Villaverde C, Parra S, Montero M, Tous M, Joven J, Masana L. The stromal derived factor-1 mutated allele (SDF1–3′A) is associated with a lower incidence of atherosclerosis in HIV-infected patients. AIDS. 2005;19:1877–1883. doi: 10.1097/01.aids.0000183516.22266.dd. [DOI] [PubMed] [Google Scholar]
- 22.Tsutsui M. Neuronal nitric oxide synthase as a novel anti-atherogenic factor. J Atheroscler Thromb. 2004;11:41–48. doi: 10.5551/jat.11.41. [DOI] [PubMed] [Google Scholar]
- 23.Turner ST, Boerwinkle E. Genetics of blood pressure, hypertensive complications, and antihypertensive drug responses. Pharmacogenomics. 2003;4:53–65. doi: 10.1517/phgs.4.1.53.22587. [DOI] [PubMed] [Google Scholar]
- 24.Sayed-Tabatabaei FA, Houwing-Duistermaat JJ, van Duijn CM, Witteman JC. Angiotensin-converting enzyme gene polymorphism and carotid artery wall thickness: a meta-analysis. Stroke. 2003;34:1634–1639. doi: 10.1161/01.STR.0000077926.49330.64. [DOI] [PubMed] [Google Scholar]
- 25.Rauramaa R, Vaisanen SB, Luong LA, Schmidt-Trucksass A, Penttila IM, Bouchard C, Toyry J, Humphries SE. Stromelysin-1 and interleukin-6 gene promoter polymorphisms are determinants of asymptomatic carotid artery atherosclerosis. Arterioscler Thromb Vasc Biol. 2000;20:2657–2662. doi: 10.1161/01.atv.20.12.2657. [DOI] [PubMed] [Google Scholar]
- 26.Armstrong C, Abilleira S, Sitzer M, Markus HS, Bevan S. Polymorphisms in MMP family and TIMP genes and carotid artery intima-media thickness. Stroke. 2007;38:2895–2899. doi: 10.1161/STROKEAHA.107.491696. [DOI] [PubMed] [Google Scholar]
- 27.Srinivasan SR, Li S, Chen W, Tang R, Bond MG, Boerwinkle E, Berenson GS. Q192R polymorphism of the paraoxonase 1 gene and its association with serum lipoprotein variables and carotid artery intima-media thickness in young adults from a biracial community. The Bogalusa Heart Study. Atherosclerosis. 2004;177:167–174. doi: 10.1016/j.atherosclerosis.2004.06.013. [DOI] [PubMed] [Google Scholar]
- 28.Karvonen J, Kauma H, Paivansalo M, Kesaniemi YA. Paraoxonase-1 gene Leu-Met55 and Gln-Arg192 polymorphisms are not associated with carotid artery atherosclerosis in a population-based cohort. Eur J Cardiovasc Prev Rehabil. 2004;11:511–512. doi: 10.1097/01.hjr.0000136415.17146.38. [DOI] [PubMed] [Google Scholar]
- 29.Aviram M, Billecke S, Sorenson R, Bisgaier C, Newton R, Rosenblat M, Erogul J, Hsu C, Dunlop C, La Du B. Paraoxonase active site required for protection against LDL oxidation involves its free sulfhydryl group and is different from that required for its arylesterase/paraoxonase activities: Selective action of human paraoxonase allozymes Q and R. Arterioscler Thromb Vasc Biol. 1998;18:1617–1624. doi: 10.1161/01.atv.18.10.1617. [DOI] [PubMed] [Google Scholar]
- 30.Ranade K, Kirchgessner TG, Iakoubova OA, Devlin JJ, DelMonte T, Vishnupad P, Hui L, Tsuchihashi Z, Sacks FM, Sabatine MS, Braunwald E, White TJ, Shaw PM, Dracopoli NC. Evaluation of the paraoxonases as candidate genes for stroke: Gln192Arg polymorphism in the paraoxonase 1 gene is associated with increased risk of stroke. Stroke. 2005;36:2346–2350. doi: 10.1161/01.STR.0000185703.88944.7d. [DOI] [PubMed] [Google Scholar]
- 31.Orbe J, Beloqui O, Rodriguez JA, Belzunce MS, Roncal C, Paramo JA. Protective effect of the G-765C COX-2 polymorphism on subclinical atherosclerosis and inflammatory markers in asymptomatic subjects with cardiovascular risk factors. Clin Chim Acta. 2006;368:138–143. doi: 10.1016/j.cca.2005.12.019. [DOI] [PubMed] [Google Scholar]
- 32.Cipollone F, Toniato E, Martinotti S, Fazia M, Iezzi A, Cuccurullo C, Pini B, Ursi S, Vitullo G, Averna M, Arca M, Montali A, Campagna F, Ucchino S, Spigonardo F, Taddei S, Virdis A, Ciabattoni G, Notarbartolo A, Cuccurullo F, Mezzetti A. A polymorphism in the cyclooxygenase 2 gene as an inherited protective factor against myocardial infarction and stroke. JAMA. 2004;291:2221–2228. doi: 10.1001/jama.291.18.2221. [DOI] [PubMed] [Google Scholar]
- 33.Liang J, Liu E, Yu Y, Kitajima S, Koike T, Jin Y, Morimoto M, Hatakeyama K, Asada Y, Watanabe T, Sasaguri Y, Watanabe S, Fan J. Macrophage metalloelastase accelerates the progression of atherosclerosis in transgenic rabbits. Circulation. 2006;113:1993–2001. doi: 10.1161/CIRCULATIONAHA.105.596031. [DOI] [PubMed] [Google Scholar]
- 34.Grainger DJ. TGF-beta and atherosclerosis in man. Cardiovasc Res. 2007;74:213–222. doi: 10.1016/j.cardiores.2007.02.022. [DOI] [PubMed] [Google Scholar]
- 35.Fox CS, Cupples LA, Chazaro I, Polak JF, Wolf PA, D’Agostino RB, Ordovas JM, O’Donnell CJ. Genomewide linkage analysis for internal carotid artery intimal medial thickness: evidence for linkage to chromosome 12. Am J Hum Genet. 2004;74:253–261. doi: 10.1086/381559. [DOI] [PMC free article] [PubMed] [Google Scholar]
- 36.Topper JN, Cai J, Falb D, Gimbrone MA., Jr Identification of vascular endothelial genes differentially responsive to fluid mechanical stimuli: cyclooxygenase-2, manganese superoxide dismutase, and endothelial cell nitric oxide synthase are selectively up-regulated by steady laminar shear stress. Proc Natl Acad Sci U S A. 1996;93:10417–10422. doi: 10.1073/pnas.93.19.10417. [DOI] [PMC free article] [PubMed] [Google Scholar]
- 37.De Keulenaer GW, Chappell DC, Ishizaka N, Nerem RM, Alexander RW, Griendling KK. Oscillatory and steady laminar shear stress differentially affect human endothelial redox state: role of a superoxide-producing NADH oxidase. Circ Res. 1998;82:1094–1101. doi: 10.1161/01.res.82.10.1094. [DOI] [PubMed] [Google Scholar]
- 38.Malek AM, Alper SL, Izumo S. Hemodynamic shear stress and its role in atherosclerosis. JAMA. 1999;282:2035–2042. doi: 10.1001/jama.282.21.2035. [DOI] [PubMed] [Google Scholar]
- 39.Lorenz MW, Markus HS, Bots ML, Rosvall M, Sitzer M. Prediction of clinical cardiovascular events with carotid intima-media thickness: a systematic review and meta-analysis. Circulation. 2007;115:459 – 467. doi: 10.1161/CIRCULATIONAHA.106.628875. [DOI] [PubMed] [Google Scholar]
Associated Data
This section collects any data citations, data availability statements, or supplementary materials included in this article.