Abstract
Background:
In acute cerebral ischemia, two variables characterize the extent of hypoperfusion: the volume of hypoperfused tissue and the intensity of hypoperfusion within these regions. We evaluated the determinants of the intensity of hypoperfusion within oligemic regions among patients who were eligible for recanalization therapy for acute ischemic stroke.
Methods:
We analyzed data, including pretreatment diffusion-weighted imaging (DWI) and perfusion-weighted imaging, on 119 patients with acute middle cerebral artery infarctions. The intensity of hypoperfusion within oligemic regions was characterized by the hypoperfusion intensity ratio (HIR), defined as the volume of tissue with severe hypoperfusion (Tmax ≥8 seconds) divided by the volume of tissue with any hypoperfusion (Tmax ≥2 seconds). Based on the DWI data, we divided the patients into four stroke phenotypes: large cortical, small (<1 cm diameter) cortical, border-zone, and deep pattern.
Results:
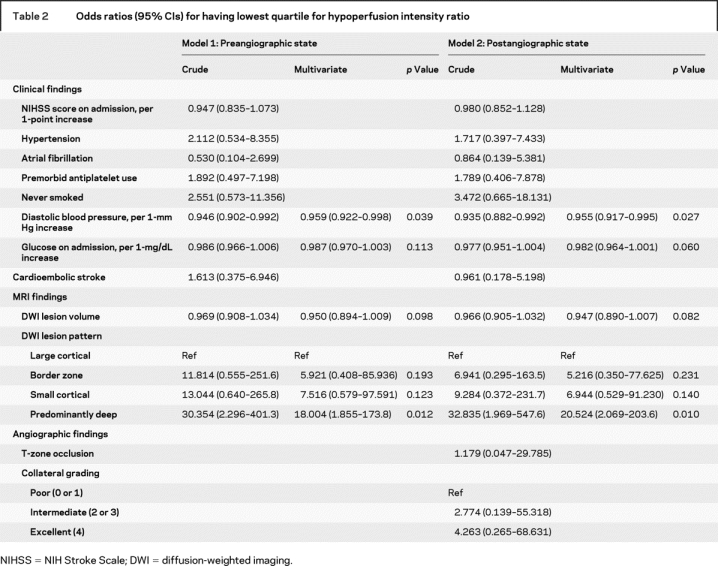
The mean (SD) volume of severe hypoperfusion was 54.6 (52.5) mL, and that of any hypoperfusion was 140.8 (81.3) mL. The HIR ranged widely, from 0.002 to 0.974, with a median of 0.35 (interquartile range 0.13–0.60). The volume of any hypoperfusion did not predict the intensity of hypoperfusion within the affected region (r = 0.10, p = 0.284). Angiographic collateral flow grade was associated with HIRs (p value for trend = 0.019) and differed among DWI lesion patterns. In multivariate analysis, diastolic pressure on admission (odds ratio 0.959, 95% CI 0.922–0.998) and DWI pattern of deep infarcts (odds ratio 18.004 compared with large cortical pattern, 95% CI 1.855–173.807) were independently associated with a low HIR.
Conclusions:
The intensity of hypoperfusion within an oligemic field is largely independent of the size of the oligemia region. Predictors of lesser intensity of hypoperfusion are lower diastolic blood pressure and presence of a deep diffusion-weighted imaging lesion pattern.
GLOSSARY
- AIF
= arterial input function;
- DWI
= diffusion-weighted imaging;
- HDL
= high-density lipoprotein;
- HIR
= hypoperfusion intensity ratio;
- ICA
= internal carotid artery;
- IQR
= interquartile range;
- LDL
= low-density lipoprotein;
- MCA
= middle cerebral artery;
- MR
= magnetic resonance;
- MRA
= magnetic resonance angiography;
- NIHSS
= NIH Stroke Scale;
- OR
= odds ratio;
- PWI
= perfusion-weighted imaging.
Human cerebral tissue can endure complete loss of blood flow for seconds to minutes, moderate reduction in blood flow for minutes to hours, and mild reduction indefinitely.1,2 Multiparametric MRI including perfusion-weighted imaging (PWI) and diffusion-weighted imaging (DWI) have increasingly been used to identify the ischemic penumbra and select patients for recanalization therapy.3–10 Several studies have investigated candidate PWI indices and thresholds that best distinguish tissue truly at risk (penumbra) from regions experiencing mild but tolerable low blood flow (benign oligemia).3,8,11 However, the factors that determine the proportion of oligemic tissue that is severely rather than mildly hypoperfused have not been previously investigated.
Our hypothesis is that the intensity of hypoperfusion abnormality within the oligemic field may vary among acute cerebral ischemia patients and be at least somewhat independent of the size of the oligemic region. In the present study, we evaluated the determinants of the intensity of hypoperfusion within the oligemic field among patients who were eligible for recanalization therapy for acute ischemic stroke.
METHODS
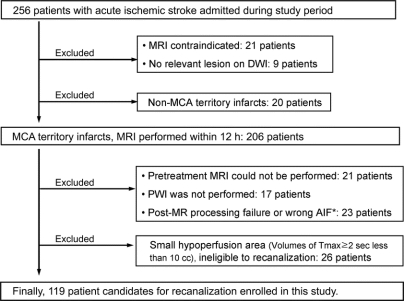
We analyzed demographic, clinical, laboratory, and radiographic data collected prospectively from consecutive patients admitted for acute cerebral ischemia to a University Medical Center from December 2002 through May 2007. Inclusion criteria for this study were 1) presentation within 6 hours of symptom onset, 2) acute ischemic lesions within the middle cerebral artery (MCA) distribution on DWI, and 3) at least modest volume (≥10 mL) of any hypoperfusion within the MCA field on pretreatment PWI (figure 1). The local institutional review board approved the study, and we received patient consent to perform the study.
Figure 1 Selection of patients
*Wrong location of measurement of arterial input function (AIF) on the volume of hypoperfusion. DWI = diffusion-weighted imaging; MCA = middle cerebral artery; MR = magnetic resonance.
All patients underwent MRI (1.5-tesla, Siemens Medical Systems, NJ). The MRI protocol included DWI, gradient-recalled echo, fluid-attenuated inversion recovery, and T2*-perfusion-weighted imaging, and magnetic resonance angiography (MRA) imaging of the cervical and intracranial vessels, using MRI methods previously described.12,13 The intensity of perfusion abnormality in each voxel was assessed with the perfusion parameter Tmax, which is the time to peak magnetic resonance signal intensity change after deconvolution; Tmax perfusion lesion maps were generated by deconvolution of an arterial input function and tissue concentration curves based on previous methods.14
Image analysis was performed with software developed in-house using the Interactive Data Language produced by ITT Visual Systems (Boulder, CO). MRI lesion volume measurements were performed by a neuroradiologist (Y.S.R.) blinded to the clinical information. For each patient, DWI and PWI lesion volumes were outlined automatically with subsequent manual correction, and volumes were calculated with a computer-assisted volumetric analysis program (Medical Image Processing, Analysis and Visualization, version 2.1, Center for Information Technology, NIH). The hypoperfusion intensity ratio (HIR) of Tmax ≥8 seconds/Tmax ≥2 seconds (VT8s/VT2s) was calculated to index hypoperfusion intensity, reflecting the proportion of tissue experiencing any hypoperfusion (Tmax ≥2 seconds) that was severe (Tmax ≥8 seconds). Patients whose VT8s/VT2s ratio was in the lowest quartile were defined as having mild intensity of hypoperfusion.
Patients were evaluated in standardized fashion, including demographic data, medical history, vascular risk factors, and NIH Stroke Scale (NIHSS) score.15 All patients underwent routine blood tests, electrocardiography, cardiac telemetry for at least 24 hours, and echocardiography. Transthoracic echocardiography was performed in large artery territory stroke patients with history, physical examination, or electrocardiographic evidence of coronary artery disease and in all single penetrator artery territory stroke patients. Transesophageal echocardiography was performed up front in large artery infarct patients with no evidence of coronary artery disease and after transthoracic echocardiography in other large artery infarct patients when etiology was unexplained after initial diagnostic evaluation. Hemostatic markers of arterial prothrombotic tendency, including antiphospholipid antibodies (anticardiolipin antibody, dilute Russell viper venom time, β2-glycoprotein-1 antibody), were measured in patients younger than 50 years or with stroke cause undefined after initial workup. Venous hypercoagulable states were assessed in patients with right-to-left shunts. Cervical and intracranial MRA was performed in all patients, and selected patients additionally underwent additional vascular imaging, including digital subtraction angiography at attending physician discretion. Catheter angiograms were analyzed for site of occlusion and for degree of collateral flow using the American Society of Interventional and Therapeutic Neuroradiology scale.16 Angiographic collateral flow was graded without knowledge of MRI findings as follows: grade 0, no collaterals visible to the ischemic site; grade 1, slow collaterals to the peripheral of the ischemic site with persistence of some of the defect; grade 2, rapid collaterals to the periphery of ischemic site with persistence of some of the defect and to only a portion of the ischemic territory; grade 3, collaterals with slow but complete angiographic blood flow of the ischemic bed by the late venous phase; and grade 4, complete and rapid collateral blood flow to the vascular bed in the entire ischemic territory by retrograde perfusion.16 Stroke mechanism categories were classified by use of the modified Trial of Org 10172 in Acute Stroke Treatment classification.13
Based on the DWI data, we divided the patients into four ischemic stroke topographic phenotypes: large cortical, small (<1 cm in diameter) cortical, border-zone, and predominantly deep pattern. Large cortical patterns included territorial infarcts involving two or three MCA subdivisions (superior, inferior, or deep)17 and cortical infarcts involving one superficial subdivision (lobar type). The small cortical pattern was infarcts with small single or multifocal ischemic lesions of <1 cm in diameter on DWI, suggesting distal embolism.18 Border-zone infarcts included multiple border-zone infarcts (either superficial or deep), suggesting hypoperfusion, distal embolism, or both, as previously reported.19 The predominantly deep pattern was defined as deep infarcts in the striatocapsular area with or without concomitant small (<1 cm) DWI lesions outside the striatocapsular area. Two readers blinded to the clinical data analyzed the DWI data; interobserver agreement was 97.3% for the interpretation of DWI lesion pattern (large cortical vs small cortical vs border zone vs predominantly deep). A third reader’s opinion was obtained in cases of disagreement.
We analyzed the differences between the groups using the χ2 test, Student t test, or one-way analysis of variance for means of normally distributed variables or the Kruskal–Wallis test for medians. The relationship of Tmax ≥2 seconds volume or DWI lesion volume with HIR was evaluated using Spearman correlation analysis. Independent factors for mild intensity of hypoperfusion (lowest quartile of VT8s/VT2s ratio) were evaluated using logistic regression. Two multivariable logistic regression models were used with the lowest quartile of VT8s/VT2s as the dependent variable and potential factors as independent variables. First, we performed multivariable logistic regression analysis to determine the independent predictors (causative variables) for the lowest quartile of VT8s/VT2s. Potential predictors considered for inclusion in this model were blood pressure and s-glucose levels on admission, pretreatment collateral grade, and site of occlusion, because these factors are known to influence hypoperfusion status. Second, a multivariable logistic regression model was used to evaluate clinicoradiologic variables that may help to identify patients with lowest HIR, controlling for 1) clinical and MRI findings (model 1, preangiography setting) and 2) angiographic findings as well as clinical and MRI findings (model 2, interventional setting). All potential confounding factors were entered into a logistic regression model, and factors that were not significant were sequentially deleted from the full model. Excluded variables were reintroduced at various stages of model development until only significant predictors remained. Results are given as odds ratio (OR) with 95% CI. Final significance was established at the p < 0.05 level.
RESULTS
Of 256 patients admitted with ischemic stroke during the study period, 119 met the study criteria (figure 1). Among enrolled patients, 61% were female, and the average age was 65.9 ± 18.5 years (range 15–95 years). The racial classification of patients included 88 whites, 9 African-Americans, 15 Asian-Americans, and 7 of other or unknown race. In ethnicity, 22 were Hispanic and 97 were not Hispanic. Recanalization therapy was pursued in 82 of the 119 patients. MRI was performed before treatment in all patients (median 4.1 hours after onset of symptoms, interquartile range [IQR] 2.4–5.3 hours, full range 0.6–15.8 hours). The median DWI lesion volume was 12.7 mL (IQR 2.9–54.8 mL, full range 0.1–230 mL), and the median volume of any PWI oligemia (Tmax ≥2 seconds) was 115.0 mL (IQR 20.2–179.4 mL, full range 11.1–399 mL). The median HIR (VT8s/VT2s) was 0.35 (IQR 0.13–0.60, full range 0.02–0.97).
Patients’ characteristics depending on the quartile of HIR are shown in table 1. NIHSS on admission was lower and being a never-smoker was more prevalent in patients with low VT8s/VT2s ratios. Atrial fibrillation was more frequently observed in patients with high VT8s/VT2s ratios, and there was a trend that potential sources of cardioembolism were found more frequently in these patients.
Table 1 Clinical and radiologic characteristics of patients according to the quartile of hypoperfusion intensity ratio (Tmax ≥8 seconds/Tmax ≥2 seconds)
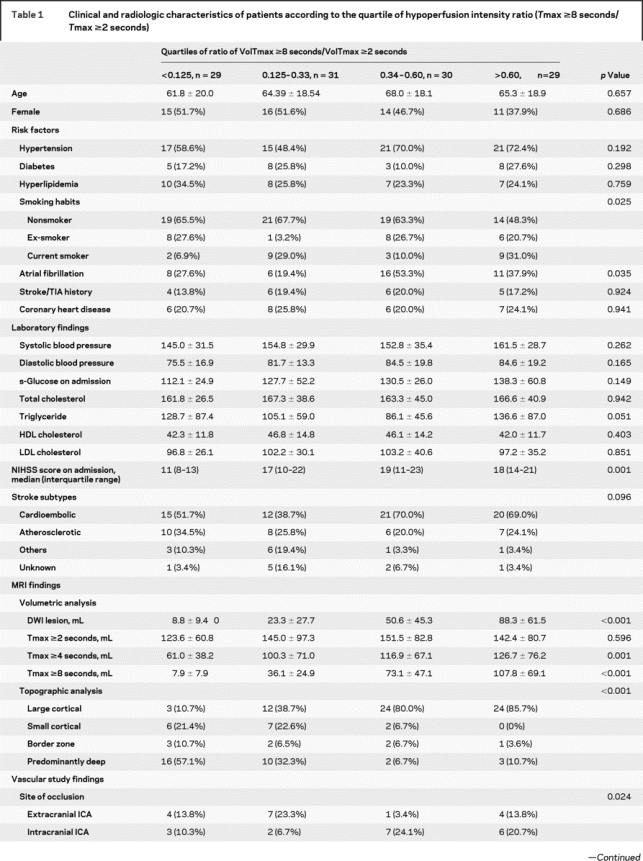
Table 1 Continued
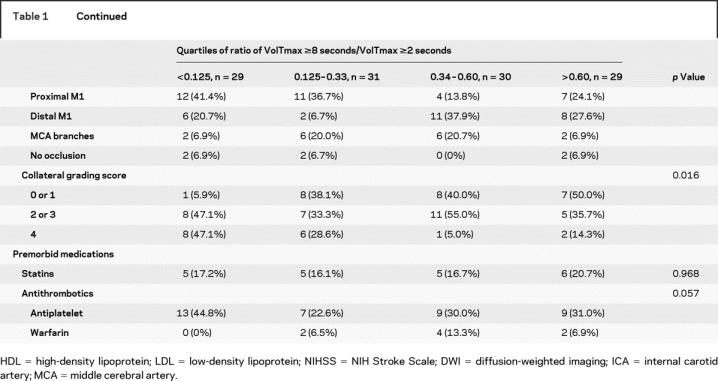
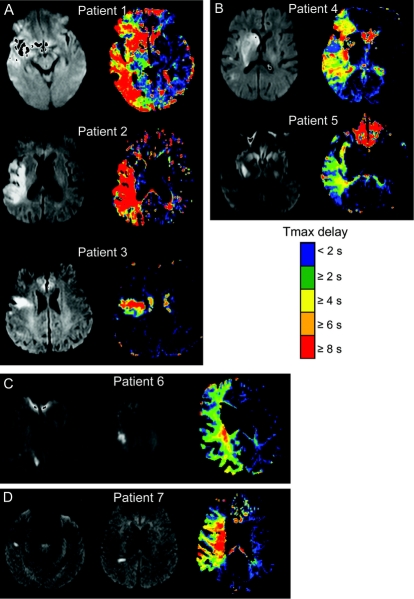
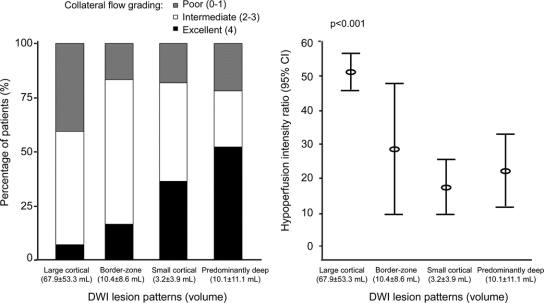
The volume of any hypoperfusion and the HIR were not correlated. Correlation analysis between the volume of Tmax ≥2 seconds area and the VT8s/VT2s ratio was r = 0.10, p = 0.284. The extent of any hypoperfusion did not differ among the quartiles of HIR (table 1 and figure e-1 on the Neurology® Web site at www.neurology.org). In contrast, both DWI lesion topography and DWI lesion volumes were associated with the HIR (figure 2 and figure e-1). The proportion of affected tissue experiencing severe hypoperfusion (high HIR) was greatest in patients with large cortical patterns, whereas patients with other DWI patterns showed less intense perfusion defects (figures 2 and 3).
Figure 2 Perfusion-weighted imaging findings in different diffusion-weighted imaging lesion patterns
(A) Large cortical pattern, (B) predominantly deep, (C) border-zone, and (D) multiple small cortical pattern.
Figure 3 Relationship between diffusion-weighted imaging (DWI) lesion patterns, collateral flow, and hypoperfusion intensity ratios
Digital subtraction angiography was performed in 94 patients. Patients with high VT8s/VT2s ratios had poor collateral flow compared with those with low ratios. Compared with patients with large cortical pattern, patients with other patterns more often had excellent collaterals (grade 4 in 42.5% vs 7.1%) and were less like to have poor collaterals (grade 0 or 1 in 20.0% vs 40.5%) (p < 0.001; figure 3). Diastolic blood pressure was not different depending on the collateral grading (83.3 ± 14.2 mm Hg in grade 0 or 1 vs 79.0 ± 22.1 mm Hg in grade 2 or 3 vs 78.5 ± 13.2 mm Hg in grade 4; p = 0.603). Multiple regression analysis was performed to further evaluate the independent predictors for relatively small proportions of affected tissue severely hypoperfused (lowest quartile of VT8s/VT2s). After adjusting for covariates, excellent (grade 4 vs grade 0 or 1; OR 20.444, 95% CI 2.227–187.692; p = 0.008) and intermediate collateral grades (grade 2 or 3 vs grade 0 or 1; OR 6.708, 95% CI 0.764–58.868; p = 0.086) were independently associated with low HIRs (p value for trend = 0.019). Systolic (OR 1.006, 95% CI 0.973–1.040) and diastolic blood pressure (OR 0.965, 95% CI 0.907–1.027), s-glucose levels on admission (OR 0.978, 95% CI 0.950–1.007), and T-zone occlusion (OR 2.571, 95% CI 0.309–21.413) were not associated with low HIRs in this model.
We then evaluated the clinicoradiologic variables (either preangiographic or postangiographic state) which may help in identifying patients with the lowest quartile of HIR (table 2). After adjusting for covariates, diastolic pressure on admission (OR 0.959 per 1-mm Hg increase, 95% CI 0.922–0.998) and DWI pattern of predominantly deep infarcts (OR 18.004 compared with large cortical pattern, 95% CI 1.855–173.807) were independently associated with low HIRs. Similar results were observed when angiographic results, including collateral grade and site of occlusion, were considered (table 2). Although collateral grading differed among the quartiles of HIR (table 1), neither excellent (grade 4 vs grade 0 or 1; OR 4.263, 95% CI 0.265–68.631; p = 0.309) nor intermediate collateral grades (grade 2 or 3 vs grade 0 or 1; OR 2.774, 95% CI 0.139–55.318; p = 0.504) were associated with low HIRs in this model. In contrast, DWI lesion volumes were the only significant independent predictor for having a large proportion of affected tissue severely hypoperfused (highest quartile of VT8s/VT2s; OR 1.030 per 1-mL increase, 95% CI 1.017–1.044). Receiver operating characteristic curves identified an optimal threshold of DWI lesion volumes of 14 mL for forecasting a high probability of the lowest quartile of VT8s/VT2s, yielding a sensitivity of 89% (95% CI 72%–98%) and a specificity of 65% (95% CI 54%–75%), whereas a DWI lesion volume of 69 mL forecast a high probability of the highest quartile of VT8s/VT2s, yielding a sensitivity of 66% (95% CI 46%–82%) and a specificity of 92% (95% CI 85%–97%).
Table 2 Odds ratios (95% CIs) for having lowest quartile for hypoperfusion intensity ratio
DISCUSSION
This study found that the intensity of hypoperfusion within the affected field varied widely among acute cerebral ischemia patients with similar volumes of tissue exhibiting any degree of oligemia. No correlation was noted between the volume of mild perfusion defects and the proportion of the affected field experiencing intense hypoperfusion. This finding suggests that estimating the volume of penumbral tissue by simple visual inspection of the border between tissue experiencing normal vs any abnormal blood flow is not the most reliable guide to selecting patients for recanalization therapy (results of the Desmoteplase in Acute Ischemic Stroke Trial 2, presented at the 16th European Stroke Conference, Glasgow, UK). The intensity of hypoperfusion, as well as the extent of the hypoperfused area (mismatch volume), determines tissue fate. In contrast, the extent and pattern of advanced tissue bioenergetic failure, reflected in the volume and topography of DWI abnormality, were independently associated with the intensity of hypoperfusion. In a prior study using both voxel-by-voxel and volume analyses of serial MRI studies, it was found that PWI measures of ischemia intensity can differentiate irreversibly injured core from penumbral, salvageable tissue, with the best threshold for identifying core infarcted tissue adjusted Tmax of ≥6 or ≥8 seconds.12 The findings of the present study are consistent with this observation, showing that the proportion of the affected field experiencing severe oligemia with Tmax ≥8 seconds correlated with DWI lesion volume.
Our study also found that DWI lesion patterns were an independent correlate of the HIR. We investigated DWI lesion patterns in the present study because several studies have suggested that infarct topography correlates with the underlying stroke pathogenic mechanism20 and characteristics (type and nature) of clots21,22 and are associated with stroke outcome.23 DWI lesion has advantages as a guide to acute treatment decision making, as a complement to assessments of perfusion and diffusion lesion volume, because it is simpler and less time-consuming to assess than volumetric analysis.
Pretreatment collateral grade on angiography predicted infarct volume after recanalization therapy.24,25 We have recently reported the relationship between diffusion–perfusion indices, angiographic collateral grade, and infarct growth in 44 patients who underwent endovascular recanalization therapy: angiographic collateral grade and penumbral volume interactively shape tissue fate in these patients.26 In the present study, the extent of collaterals evident at catheter angiography correlated strongly with the HIR. This finding indicates that collaterals may protect the brain not only by reducing the volume of tissue experience any hypoperfusion, but also by reducing the intensity of hypoperfusion within altered perfusion fields. By permitting a greater proportion of tissue to experience benign oligemia that is tolerable indefinitely rather than severe oligemia that is rapidly injurious, collateral flow can ameliorate the effect of loss of anterograde flow though an acute occluded artery. Collaterals likely mediate, in several ways, the association noted in this study between the HIR and DWI lesion patterns. Most patients with large cortical DWI topographic patterns had poor collaterals and a high VT8s/VT2s ratio, indicating that poor leptomeningeal collaterals with occlusion of proximal vessels result in large cortical lesion patterns, whereas cortical areas are spared through collaterals and reduced VT8s/VT2s ratio in most patients with a predominantly deep DWI lesion pattern. Large cortical pattern is a common DWI topographic finding in patients with atrial fibrillation or cardioembolic sources. Atrial fibrillation and cardioembolic stroke mechanism were univariate predictors for the intensity of hypoperfusion within the affected field in the present study. The sudden onset of ischemia in cardioembolic occlusion as opposed to intermittent or chronic onset that may occur in atherosclerotic lesions is likely associated with a paucity of previously evoked collaterals, and subsequent hypoperfusion in much of the affected territory.
We found an association of elevated diastolic pressure on presentation with a greater intensity of hypoperfusion within the affected field. This finding is consistent with emerging evidence that acute hypertension in cerebral ischemia patients is related to the extent of brain ischemia. It was recently reported that higher pretreatment blood pressure levels are associated with poor recanalization in patients with acute stroke treated with IV tissue plasminogen activator.27 Patients with adequate collaterals do not need highly elevated perfusion pressures to protect the threatened field; in contrast, blood pressure elevations may increase collateral flow in passive pressure-dependent ischemic fields in patients with inadequate collateral. Early hypertension after ischemic stroke was associated with increased mortality.28 Successful recanalization induces substantial decreases in systolic blood pressure, probably due to elimination of the need for this blood pressure elevation.29
Strengths of our study included the consecutive, prospective recruitment of patients who underwent comprehensive workups, including vascular, laboratory, and cardiologic studies; catheter angiographic evaluation in a large proportion of subjects, including collateral grading and site of occlusion; and analysis of a variety of MRI findings. However, the results of this study should be interpreted with caution because of the modest sample size and retrospective nature. In addition, relatively few patients with large DWI lesion volumes were included in this study. Multicenter studies with a large sample will be required to prove or disprove our results. In addition, only pretreatment MRI findings were studied, and follow-up diffusion-weighted images were not evaluated in the present study.
Supplementary Material
APPENDIX
UCLA Collateral Investigators: Oh Young Bang, MD; PhD; Jeffrey L. Saver, MD; Sa Rah Yoon, MD; Brian H. Buck, MD; Jeffry R. Alger, PhD; Sidney Starkman, MD; Bruce Ovbiagele, MD; Doojin Kim, MD; Latisha K. Ali, MD; Samir H. Shah, MD; Amytis Towfighi, MD; Paul M. Vespa, MD; Reza Jahan, MD; Noriko Salamon, MD; Gary R. Duckwiler, MD; J. Pablo Villablanca; Fernando Viñuela, MD; and David S. Liebeskind, MD.
Address correspondence and reprint requests to Dr. Oh Young Bang, Department of Neurology and Stroke Center, Samsung Medical Center, Sungkyunkwan University, 50 Irwon-dong, Gangnam-gu, Seoul, 135-710, South Korea nmboy@unitel.co.kr
Supplemental data at www.neurology.org
*See appendix.
Supported by NIH/National Institute of Neurological Disorders and Stroke 1K23NS054084-01A1 (to D.S.L.).
Disclosure: The authors report no disclosures.
Received February 28, 2008. Accepted in final form August 25, 2008.
REFERENCES
- 1.Astrup J, Symon L, Branston NM, Lassen NA. Cortical evoked potential and extracellular K+ and H+ at critical levels of brain ischemia. Stroke 1977;8:51–57. [DOI] [PubMed] [Google Scholar]
- 2.Donnan GA, Davis SM. Neuroimaging, the ischaemic penumbra, and selection of patients for acute stroke therapy. Lancet Neurol 2002;1:417–425. [DOI] [PubMed] [Google Scholar]
- 3.Furlan AJ, Eyding D, Albers GW, et al. Dose escalation of desmoteplase for acute ischemic stroke (DEDAS): evidence of safety and efficacy 3 to 9 hours after stroke onset. Stroke 2006;37:1227–1231. [DOI] [PubMed] [Google Scholar]
- 4.Hacke W, Albers G, Al-Rawi Y, et al. The desmoteplase in acute ischemic stroke trial (DIAS): a phase II MRI-based 9-hour window acute stroke thrombolysis trial with intravenous desmoteplase. Stroke 2005;36:66–73. [DOI] [PubMed] [Google Scholar]
- 5.Albers GW, Thijs VN, Wechsler L, et al. Magnetic resonance imaging profiles predict clinical response to early reperfusion: the diffusion and perfusion imaging evaluation for understanding stroke evolution (DEFUSE) study. Ann Neurol 2006;60:508–517. [DOI] [PubMed] [Google Scholar]
- 6.Kohrmann M, Juttler E, Fiebach JB, et al. MRI versus CT-based thrombolysis treatment within and beyond the 3 h time window after stroke onset: a cohort study. Lancet Neurol 2006;5:661–667. [DOI] [PubMed] [Google Scholar]
- 7.Ribo M, Molina CA, Rovira A, et al. Safety and efficacy of intravenous tissue plasminogen activator stroke treatment in the 3- to 6-hour window using multimodal transcranial Doppler/MRI selection protocol. Stroke 2005;36:602–606. [DOI] [PubMed] [Google Scholar]
- 8.Hjort N, Butcher K, Davis SM, et al. Magnetic resonance imaging criteria for thrombolysis in acute cerebral infarct. Stroke 2005;36:388–397. [DOI] [PubMed] [Google Scholar]
- 9.Davis SM, Donnan GA, Butcher KS, Parsons M. Selection of thrombolytic therapy beyond 3 h using magnetic resonance imaging. Curr Opin Neurol 2005;18:47–52. [DOI] [PubMed] [Google Scholar]
- 10.Butcher KS, Parsons M, MacGregor L, et al. Refining the perfusion-diffusion mismatch hypothesis. Stroke 2005;36:1153–1159. [DOI] [PubMed] [Google Scholar]
- 11.Kidwell CS, Alger JR, Saver JL. Beyond mismatch: evolving paradigms in imaging the ischemic penumbra with multimodal magnetic resonance imaging. Stroke 2003;34:2729–2735. [DOI] [PubMed] [Google Scholar]
- 12.Shih LC, Saver JL, Alger JR, et al. Perfusion-weighted magnetic resonance imaging thresholds identifying core, irreversibly infarcted tissue. Stroke 2003;34:1425–1430. [DOI] [PubMed] [Google Scholar]
- 13.Lee LJ, Kidwell CS, Alger J, Starkman S, Saver JL. Impact on stroke subtype diagnosis of early diffusion-weighted magnetic resonance imaging and magnetic resonance angiography. Stroke 2000;31:1081–1089. [DOI] [PubMed] [Google Scholar]
- 14.Ostergaard L, Weisskoff RM, Chesler DA, Gyldensted C, Rosen BR. High resolution measurement of cerebral blood flow using intravascular tracer bolus passages, part I: mathematical approach and statistical analysis. Magn Reson Med 1996;36:715–725. [DOI] [PubMed] [Google Scholar]
- 15.Smaha LA. The American Heart Association Get with the Guidelines program. Am Heart J 2004;148:S46–S48. [DOI] [PubMed] [Google Scholar]
- 16.Higashida RT, Furlan AJ, Roberts H, et al. Trial design and reporting standards for intra-arterial cerebral thrombolysis for acute ischemic stroke. Stroke 2003;34:e109–e137. [DOI] [PubMed] [Google Scholar]
- 17.Heinsius T, Bogousslavsky J, Van Melle G. Large infarcts in the middle cerebral artery territory: etiology and outcome patterns. Neurology 1998;50:341–350. [DOI] [PubMed] [Google Scholar]
- 18.Kimura K, Minematsu K, Koga M, et al. Microembolic signals and diffusion-weighted MR imaging abnormalities in acute ischemic stroke. AJNR Am J Neuroradiol 2001;22:1037–1042. [PMC free article] [PubMed] [Google Scholar]
- 19.Yong SW, Bang OY, Lee PH, Li WY. Internal and cortical border-zone infarction: clinical and diffusion-weighted imaging features. Stroke 2006;37:841–846. [DOI] [PubMed] [Google Scholar]
- 20.Baird AE, Lovblad KO, Schlaug G, Edelman RR, Warach S. Multiple acute stroke syndrome: marker of embolic disease? Neurology 2000;54:674–678. [DOI] [PubMed] [Google Scholar]
- 21.Caplan LR. Brain embolism, revisited. Neurology 1993;43:1281–1287. [DOI] [PubMed] [Google Scholar]
- 22.Masuda J, Yutani C, Ogata J, Kuriyama Y, Yamaguchi T. Atheromatous embolism in the brain: a clinicopathologic analysis of 15 autopsy cases. Neurology 1994;44:1231–1237. [DOI] [PubMed] [Google Scholar]
- 23.Bang OY, Lee PH, Heo KG, Joo US, Yoon SR, Kim SY. Specific DWI lesion patterns predict prognosis after acute ischaemic stroke within the MCA territory. J Neurol Neurosurg Psychiatry 2005;76:1222–1228. [DOI] [PMC free article] [PubMed] [Google Scholar]
- 24.Kim JJ, Fischbein NJ, Lu Y, Pham D, Dillon WP. Regional angiographic grading system for collateral flow: correlation with cerebral infarction in patients with middle cerebral artery occlusion. Stroke 2004;35:1340–1344. [DOI] [PubMed] [Google Scholar]
- 25.Christoforidis GA, Mohammad Y, Kehagias D, Avutu B, Slivka AP. Angiographic assessment of pial collaterals as a prognostic indicator following intra-arterial thrombolysis for acute ischemic stroke. AJNR Am J Neuroradiol 2005;26:1789–1797. [PMC free article] [PubMed] [Google Scholar]
- 26.Bang OY, Saver JL, Buck BH, et al. Impact of collateral flow on tissue fate in acute ischaemic stroke. J Neurol Neurosurg Psychiatry 2008;79:625–629. [DOI] [PMC free article] [PubMed] [Google Scholar]
- 27.Tsivgoulis G, Saqqur M, Sharma VK, Lao AY, Hill MD, Alexandrov AV. Association of pretreatment blood pressure with tissue plasminogen activator-induced arterial recanalization in acute ischemic stroke. Stroke 2007;38:961–966. [DOI] [PubMed] [Google Scholar]
- 28.Stead LG, Gilmore RM, Decker WW, Weaver AL, Brown RD Jr. Initial emergency department blood pressure as predictor of survival after acute ischemic stroke. Neurology 2005;65:1179–1183. [DOI] [PubMed] [Google Scholar]
- 29.Mattle HP, Kappeler L, Arnold M, et al. Blood pressure and vessel recanalization in the first hours after ischemic stroke. Stroke 2005;36:264–268. [DOI] [PubMed] [Google Scholar]
Associated Data
This section collects any data citations, data availability statements, or supplementary materials included in this article.


