

Abstract
Down syndrome, due to trisomy of human chromosome 21, is the most common genetic cause of intellectual disability. The Ts65Dn mouse model of Down syndrome is trisomic for orthologs of 94 chr21-encoded confirmed protein coding genes and displays a number of behavioral deficits. Recently, Ts65Dn mice were shown to be hypersensitive to the locomotor stimulatory effects of the high affinity N-methyl-D-aspartate (NMDA) receptor (NMDAR) channel blocker, MK-801. This is consistent with the functions of several chr21 proteins that are predicted directly or indirectly to impact NMDA receptor function or NMDA receptor-mediated signaling. Here, we show that a second mouse model of Down syndrome, the Ts1Cje, which is trisomic for 70 protein coding genes, is also hypersensitive to MK-801. To investigate the molecular basis for the responses to MK-801, we have measured levels of a subset of chr21 and phosphorylated non-chr21 proteins, in the cortex and hippocampus of Ts65Dn and Ts1Cje mice and euploid controls, with and without treatment with MK-801. We show that, in euploid mice, the chr21-encoded proteins, TIAM1 and DYRK1A, and phosphorylation of Akt, Erk1/2 and the transcription factor Elk are involved in the MK-801 response. However, in both Ts65Dn and Ts1Cje mice, levels of phosphorylation are constitutively elevated in naïve, unstimulated mice and the MK-801 induced changes in TIAM1 and DYRK1A and in phosphorylation are either absent or abnormal, with both genotype and brain region-specific patterns. These results emphasize the complexities of the pathway perturbations that arise with segmental trisomy.
Keywords: protein phosphorylation, NMDA receptor, calcineurin, chromosome 21, trisomy 21, cognitive deficits, hippocampus, Elk
Introduction
Down syndrome (DS) is the most common genetic cause of intellectual disability (CDC, 2006). DS is caused by trisomy of the long arm of human chromosome 21 (chr21, 21q) or, in rare cases, by partial trisomy of 21q, and by the consequent increase in expression of the triplicated genes. The average IQ of individuals with DS is 40-50, with the neuropsychological profile including specific deficits in hippocampus- and prefrontal cortex-dependent functions, particularly affecting spatial learning, aspects of language acquisition and comprehension, and memory (Chapman & Hesketh, 2000; Pennington et al 2003; Nadel, 2003; Abbeduto et al 2007). The postnatal emergence of many of these features suggests that therapeutics for their prevention or amelioration may be practical. One approach to rational drug development is to connect the functions of overexpressed chr21 genes with abnormalities in the known molecular underpinnings of learning and memory, thus identifying both chr21 and non-chr21 abnormalities as potential targets for therapeutic intervention.
The Ts65Dn is the most complete of the commonly available mouse models of DS (Dierssen et al 2001; Seregaza et al 2006). It is trisomic for orthologs of approximately 94 of the 170 highly conserved, confirmed protein coding genes identified on 21q (Gardiner & Costa 2006). Recently, Ts65Dn mice were shown to be hypersensitive to the locomotor stimulatory effects of the high affinity N-methyl-D-aspartate (NMDA) receptor (NMDAR) channel blocker, MK-801, when compared to euploid control mice (Costa et al 2008). This response may be explained at the molecular level by the inter-related functions of nine chr21-encoded proteins shown in Figure 1. When these genes are overexpressed, as predicted in DS due to gene dosage, calcineurin and NMDAR activities and NMDAR-mediated signaling are predicted to be perturbed. Downstream consequences of these perturbations include perturbation in the activation of Akt, Gsk3b, Erk1/2 and Elk. Importantly, however, given the multiple and overlapping interactions and functions of these chr21 proteins, it is difficult to predict the direction and the magnitude of the perturbations, and particularly, their effects on the dynamics of responses to the stimuli of learning and drug treatments.
Figure 1. Chr21 proteins: direct and indirect interactions with NMDAR and signaling consequences.

Chr21 proteins are shown in shaded boxes: DYRK1a, dual specificity tyrosine protein kinase; SYJN1, synaptojanin 1, phosphoinositol phosphatase; TIAM1, transient invasion and metastasis protein 1, a guanine nucleotide exchange factor specific for Rac; ITSN1, Intersectin 1, a multi-domain, multifunctional protein; PCP4, Purkinje Cell Protein 4; RCAN 1, Regulator of calcineurin 1; APP, Amyloid Precursor protein; SOD1, Superoxide Dismutase 1; BACH1, BTB and CNC homology transcription factor 1. CaN, calcinuerin, a calcium-calmodulin-dependent protein phosphatase; CaM, calmodulin. PtdIns, phosphatydylinositol. Arrows, activation; blunt lines, inhibition; straight lines, interaction. Solid lines direct, dashed lines, indirect effects. (1)Ahn et al 2006a, (2) Kelly & Rahmani, 2005 (3) Adayev et al 2006, (4) Fleming et al 2004, (5) Mertens et al 2003, (6) Tolias et al 2007, (7) Zhang & Macara, 2006, (8) Wang et al 2007, (9) Papadia & Hardingham 2007, (10) Snyder et al 2005, (11) Nishimura et al 2006, (12) Mohney et al 2003, (13) Choe et al 2005, (14) Sugimoto et al 1997, (15) Tain & Karin 1999, (16) Putkey et al 2004, (17) Hoeffer et al 2007, (18) Rothermel et al 2003, (19) Winder & Sweatt 2001, (20) Ermak et al 2006, (21) Lott et al 2006, (22) Reichard et al 2007, (23) Fleming et al 1998, (24) Woods et al 2001, (25) Das et al (2007), (26) Yamabhai et al (1998).
To examine the molecular basis of behavioral responses to NMDAR antagonists in trisomy, we have measured the levels of a subset of chr21 and phosphorylated non-chr21 proteins, in the cortex and hippocampus of Ts65Dn and euploid control mice, with and without treatment with MK-801. Similar measurements were made in a second mouse model of DS, Ts1Cje, which is trisomic for a reduced segment of mouse chromosome 16, one that includes only Synj1, Itsn1, Rcan1, Dyrk1a and Pcp4 of the candidate genes (Sago et al 1998). In euploid mice, injection of MK-801 resulted in changes in localization of the chr21-encoded proteins, TIAM1 and DYRK1A, and phosphorylation of Akt, Erk1/2 and the transcription factor, Elk. In contrast, in both Ts65Dn and Ts1Cje mice, levels of phosphorylation are constitutively elevated in naïve, unstimulated mice and the observed euploid molecular responses to MK-801 are perturbed and largely absent.
Methods
Mice
Both the Ts65Dn (Davisson et al 1993) and the Ts1Cje (Sago et al 1998) trisomies are maintained by mating trisomic females to C57BL/6JEi x C3H/HeSnJ (B6EiC3Sn) F1 hybrid males. Colonies were maintained at the Center for Laboratory Animal Care at the University of Colorado Denver on a 12:12 h light/dark schedule with continuous access to food and water. Ts65Dn mice were genotyped either by quantitative (real time) polymerase chain reaction (qPCR) for genes in the trisomic segment (Liu et al 2003) or by counting chromosomes in metaphase spreads to ascertain the presence of the marker chromosome (Davisson et al 1993). Ts1Cje mice were genotyped either by qPCR or by standard PCR targeted at the neomycin resistance cassette from the vector originally used to make the mice (Sago et al 1998) using the following primer set: Ts1Cje forward: CTT GGG TGG AGA GGC TAT TC, and Ts1Cje reverse: AGG TGA GAT GAC AGG AGA TC. C3H/HeSnJ mice carry a recessive mutation that leads to retinal degeneration. Therefore, all animals were pre-evaluated by indirect ophthalmoscopy and only mice without signs of retinal disease were used. Only male mice were tested in this study. All experimental methods have received the approval of the University of Colorado Denver's animal care and use committee.
Behavioral response to MK-801 in Ts1Cje mice
Assessment of the locomotor-stimulating effects of MK-801 in Ts65Dn mice has been described (Costa et al 2008). The same protocol was followed in analysis of the Ts1Cje mice. Briefly, animals were allowed to habituate to a novel environment (a clean mouse cage without bedding, food, or water) for two hours, at which time they were injected intraperitoneally (i.p.) with saline or MK-801 and left in the cage for a further three hours. Locomotor activity was assessed over the entire 5-hour period by photocell arrays specifically adapted to the exterior walls of cage (Opto-Varimex-Mini, Columbus Instruments, Columbus, OH). To first determine dose-response, animals of each genotype were injected with MK-801 at five different doses (0, 0.1, 0.2, 0.4, 0.8 mg/kg) administered sequentially once a week over five weeks. For this study three measures of activity were calculated: total activity (the total number of photocell interruptions during a five minute interval), ambulatory activity (the total number of walking or horizontal photocell interruptions during a five minute interval), and rearing activity (the total number of vertical photocell interruptions during a five minute interval). Doses of MK-801 are expressed in mg/kg and injected i.p. in a volume of 6.25 ml/kg, or 0.125 ml/20g.
For molecular analysis, four 7-8 month old MK-801-naïve male mice were injected once with MK-801. Male mice were chosen to avoid potential effects of female estrous cycles. The age of 7-8 months was chosen because it is well after the of 4-6 month time frame during which Ts65Dn mice develop specific learning deficits (Hyde and Crnic 2001) and show changes from abnormally low levels to abnormally high levels of some MAPK pathway components (Gardiner et al 2004), and yet is prior to the onset of effects due to significantly aged mice. Ts65Dn with euploid controls were injected with 0.4 mg/kg MK-801 or saline, and Ts1Cje mice with euploid controls were injected with 0.8 mg/kg MK-801 or saline. The higher dose was chosen for Ts1Cje mice based on results of preliminary dose-response studies in which the Ts1Cje mice showed a slightly less pronounced degree of locomotor stimulation when compared to the Ts65Dn mice. The higher dose was an attempt to elicit the same degree of locomotor and molecular stimulation in the two strains. Mice were sacrificed by cervical dislocation 60 minutes post injection, and the hippocampus and neocortex quickly dissected in ice-cold artificial cerebral spinal fluid (aCSF: 120 mM NaCl, 3.5 mM KCl, 2.5 mM CaCl2, 1.3 mM MgSO4, 1.25 mM NaH2PO4, 26 mM NaHCO3, 10 mM d-glucose, saturated with 95% O2 and 5% CO2), placed in liquid nitrogen for rapid freezing and stored at -80°C until use. Saline solutions of MK-801 (( + )-5-methyl-10,11-dihydro-5H-dibenzo[a,d]cyclohepten-5,10-imine) hydrogen maleate (Sigma, St Louis, MO) were prepared fresh or stored at 80°C.
Protein lysates
To optimally preserve phosphorylation, all procedures were carried out rapidly (within <2 hours) at 4°C in buffers containing protease inhibitors (PMSF, leupeptin and aprontinin) and a phosphatase inhibitor cocktail (Roche Applied Sciences, Indianapolis, IN). Briefly, cortex samples were homogenized in L1 buffer (10 mM Hepes/0.1 mM EGTA/10 mM KCl/1.5 mM Mg2Cl) and centrifuged for 5 minutes at 5000g, and the pellet (P1) and supernatant (S1) were retained. One half of the S1 supernatant, with the addition of glycerol to 10%, was retained as the cytoplasmic fraction. The remaining half of the S1 supernatant was centrifuged at 10,000g for 30 minutes and the pellet resuspended in L1 buffer to form the crude membrane fraction. For the nuclear fraction, the P1 pellet was resuspended in L1 buffer, passed through a 16 gauge needle to lyse nuclei, centrifuged at 5000 g for 5 minutes; the pellet was resuspended in L2 buffer (10 mM Hepes/0.1 mM EGTA/400 mM NaCl/1.5 mM Mg2Cl), kept at 4°C with agitation for 60 minutes, centrifuged at 14,000 g for 30, and the supernatant retained as the nuclear fraction. Because of limited material (~15 mg per animal), hippocampus samples were not fractionated into nuclear and cytoplasm; instead they were homogenized in L1 buffer, centrifuged at 14,000g for 30 minutes; the supernatant was retained as the soluble fraction and the pellet as the crude membrane fraction.
Immunoblotting
Protein lysates (30 ug) were resolved on polyacrylamide gels (8%, 10% or 12% depending upon the size of the proteins to be detected) and transferred to PVDF membranes. After blocking, membranes were incubated overnight in primary antibody, followed by alkaline-phosphatase-conjugated secondary antibodies. Membranes were stripped and re-probed once or twice with additional antibodies, and all membranes were probed with actin. Antibodies were purchased as follows: TIAM1, DYRK1A, Elk1, pElk1(Ser383), Akt, pAkt(Ser473), pErk1/2(Tyr204) (Santa Cruz Biotechnology Inc, Santa Cruz, CA); NMDA receptor NR1 subunit and pNR1(Ser897) (Upstate, Millipore Corporation, Billerica, MA ); Gsk3b, pGSK3B, ITSN1(Ese1), Erk1/2 (BD Biosciences, San Jose, CA); alkaline phosphatase (AP)-linked goat anti-rabbit IgG and donkey anti-mouse IgG (Cell Signaling Technology, Beverly, MA); β-actin, AP-linked goat-anti-mouse IgG (Sigma). Signals were detected with the CDP-Star alkaline phosphatase detection system (Tropix/ABI, Foster City, CA) with imaging and quantitation using a Diana III CCD camera/chemiluminescence imager (Raytest, Inc, Germany). Samples from euploid control and trisomic littermate or age-matched pairs were included on each gel. Expression was normalized to actin.
Statistical analysis
For each antibody/sample, measurements were replicated 2-4 times, and results with technical aberrations discarded; averages were used for statistical analysis. Differences between trisomy and euploid and between genotypes with saline and MK-801 injections were assessed using the Tukey's test (GraphPad Prizm 4.0); values are presented as means ± SEM, and statistical significance taken as p<0.05. Statistical analysis of locomotor activity increase due to MK-801 has been previously described (Costa et al 2008). Briefly, to determine the net activities (Figures 2 f-h and 3 a-h), the saline peak (the average activity between 30 and 80 min after injections) was subtracted from the locomotor response peaks (also the average between 30 and 80 min after injections) of individual mice for each dose of MK-801. Twoway repeated measures analysis of variance (RM ANOVA) (Statistica 7.0, Stat-soft, Tulsa, OK) and Fisher's protected least significant differences (PLSD) post hoc tests were used to compare the mean net locomotor activities between genotypes. Data for the Ts65Dn mice are reproduced or reanalyzed (ambulatory and rearing) from Costa et al. (2008).
Figure 2. Ts1Cje mice show enhanced locomotor response to MK-801 compared to euploid control mice.
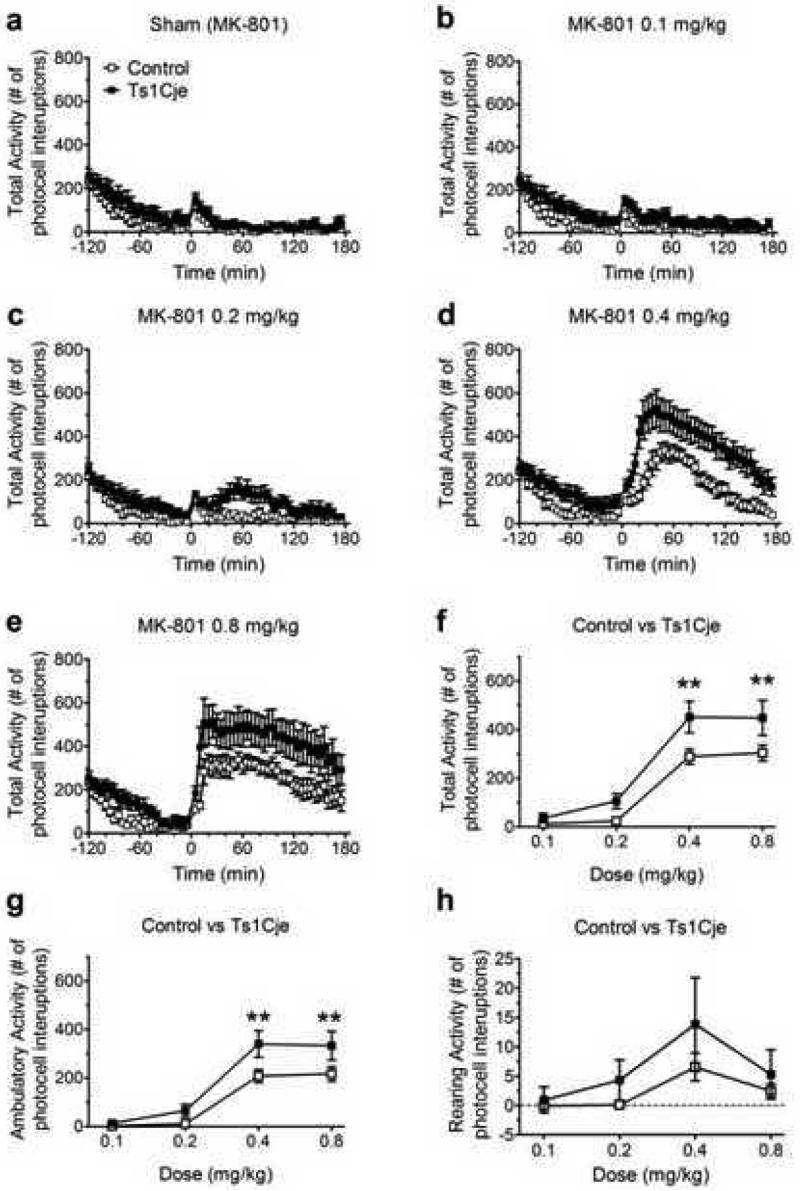
(a-e) Dose dependence of total locomotor activity as a function of time (n=11). (f-h) Dose-dependence of the MK-801 stimulation on the three measures of activity: f) total activity: significantly dependent on genotype; post hoc analysis reveals significant differences at 0.4mg/kg p<0.01 and 0.8mg/kg p<0.01, g) ambulatory activity: significantly dependent on genotype; post hoc analysis reveals significant differences at 0.4mg/kg p<0.01 and 0.8mg/kg p<0.01, and h) rearing activity: no significant effect of genotype.
Figure 3. Genotype comparisons of the three measures of locomotor response to MK-801.
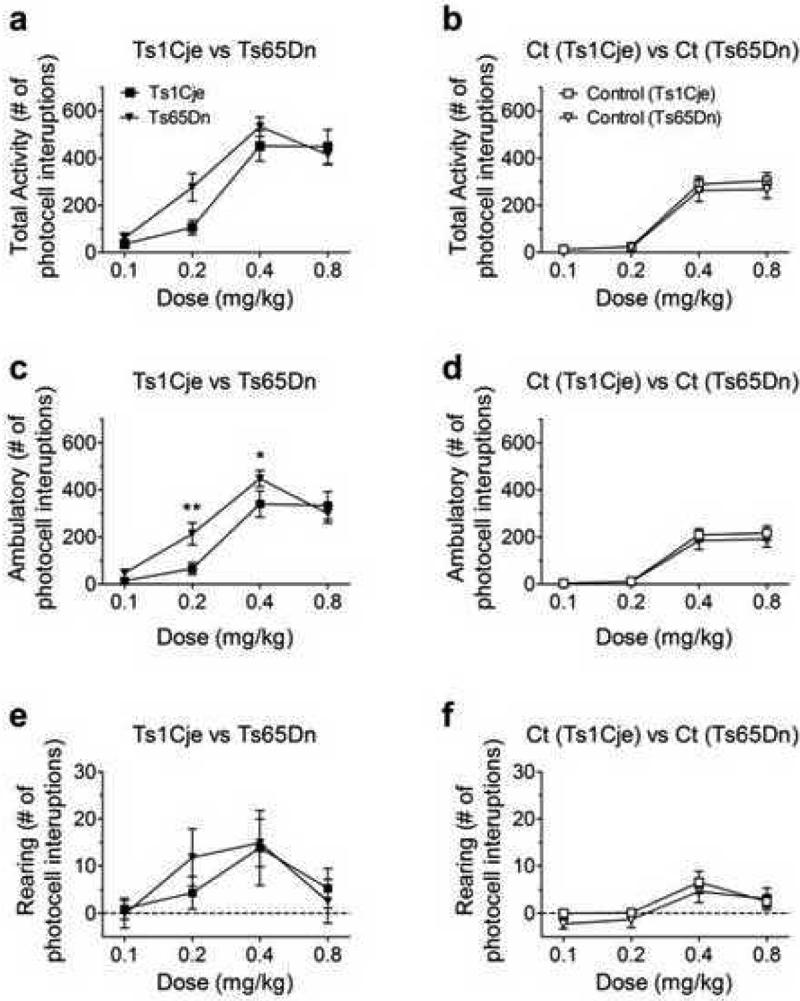
(a, c, e) Comparison of Ts1Cje (n=11) and Ts65Dn (n=15) for (a) total locomotor activity: no significant effect of genotype, (c) ambulatory activity: significant effect of genotype; post hoc comparisons revealed significant differences at 0.2mg/kg p<0.01 and 0.4mg/kg p<0.05, and (e) rearing activity: no significant effect of genotype. (b, d, f) Comparison of euploid controls from Ts1Cje (n=11) and Ts65Dn (n=15) mice: (b) total activity, (d) ambulatory activity, (f) rearing activity: genotype had no significant effect on any measure. Data for Ts65Dn total activity are taken from Costa et al (2008); they have been reanalyzed here separating ambulatory and rearing activities.
Results
Ts1Cje response to MK-801
Figure 2 illustrates the locomotor stimulatory effects of MK-801 injections on Ts1Cje (n=11) and control euploid (n=11) mice. Similar to previous observations with Ts65Dn mice (Costa et al 2008), compared to euploid controls, Ts1Cje mice are more sensitive to MK-801, particularly at the 0.4 and 0.8 mg/kg doses (Figure 2a-e). Figures 2f-h illustrate the effects of MK-801 on the three measures of activity. Figure 2f compares the mean peak for total activity; genotype-dependence is statistically significant for the stimulatory effects (F1,20 = 6.653; p* = 0.0179; two-way RM ANOVA). Figure 2g compares the mean peak for ambulatory activity; genotype-dependence is statistically significant (F1,20 = 5.309; p* = 0.0321; two-way RM ANOVA). Figure 2h compares the mean peak for rearing activity; genotype-dependence is not statistically significant (F1,20 = 0.994; p = 0.331; two-way RM ANOVA). Figure 3 compares Ts1Cje (n=11) responses with those previously reported for Ts65Dn (n=15) (Costa et al 2008). Figure 3a compares the mean peak amplitudes of total activity; there is no significant difference between the two genotypes (F1,24 = 1.763, p = 0.1968; two-way RM ANOVA), although a post hoc test at the 0.2 mg/kg point indicates that Ts1Cje mice are significantly less responsive at that dose. Ambulatory and rearing activity were compared separately (Figure 3c,e). There was a significant interaction between dose and genotype (F3,72 = 2.855, p* = 0.043; two-way RM ANOVA) for ambulatory activity but no significant difference in rearing activity (F1,24 = 0.0501; p = 0.825; two-way RM ANOVA). Results of similar analyses comparing the euploid littermate controls for the two trisomic strains are shown in Figure 3b,d,f. There were no statistically significant differences in total activity (F1,24 = 1.182; p = 0.288; two-way RM ANOVA), ambulatory activity (F1,24 = 0.463, p = 0.502; two-way RM ANOVA) or rearing activity (F1,24 = 1.182; p = 0.502; two-way RM ANOVA). These results are not surprising given that controls are not different inbred strains, but are both mixed background euploid progeny from mating trisomic females to C57BL/6JEi x C3H/HeSnJ (B6EiC3Sn) F1 hybrid males.
Molecular responses of Ts65Dn and TS1Cje mice to MK-801
Quantitative Western analysis was used to measure total and phosphorylated levels of five nonchr21 proteins, NR1, Akt, Erk1, Erk2 and Elk, and total levels of three chr21 proteins, TIAM1, DYRK1A and ITSN1. Hippocampus and cortex were chosen for analysis primarily based on the observation of Miyakawa et al (2003) that inhibition of calcineurin activity solely in cortex, hippocampus and amygdala results in mice that are hypersensitive to the stimulatory effects of MK-801. Thus, molecular abnormalities in response to MK-801 in hippocampus and cortex of trisomy mice can be assays of both NMDAR and calcineurin function, as well as predictors of the molecular basis of learning/memory deficits in these same brain regions. For cortex samples, cytoplasmic, nuclear and crude membrane fractions were examined for a total of 14 possible measurements, and, for hippocampus samples, whole soluble lysates and crude membrane fractions were examined for a total of nine measurements. This results in 23 possible measurements for each of four mice from each of four genotypes, Ts65Dn, Ts1Cje and their respective euploid/littermate controls, with saline or MK-801 injection. Representative Westerns are shown in Figure 4.
Figure 4. Sample Western blots, chr21 and non-chr21 proteins in cortex.

Approximately 30 ug of each protein lysate were resolved on 12% polyacrylamide gels (Erk1/2, Akt, Elk) or 8% or 10% gels (Dyrk1a, Tiam1) and transferred to PVDF membranes. In addition to the antibodies for the indicated proteins, each membrane was simultaneously or sequentially probed with an antibody for actin. Due to variations in the amounts of protein loaded, visual interpretation of signal intensities is not accurate and actin signals were used for normalization to correct for variable protein levels; only one example of a set of actin signals is shown. C, euploid control sample; Ts, trisomic sample; C+M, euploid control injected with MK-801; Ts+M, trisomy injected with MK-801. Nuc, nuclear; cyto, cytoplasmic; mem, crude membrane fraction. p, phosphorylated protein; t, total protein, phosphorylated plus non-phosphorylated.
Comparisons of average protein levels, trisomy vs. euploid, and all genotypes +Mk-801
Tables 1 and 2 show protein levels averaged over all mice within a genotype-treatment group. The first columns in Table 1 illustrate the effects of trisomy on basal (saline injected) protein levels in cortex. Trisomy of TIAM1, DYRK1A and ITSN1 genes is associated with increased protein expression at levels consistent with gene dosage, but not in all cell fractions. While Ts65Dn and Ts1Cje show similarly increased DYRK1A (~25%) both in the membrane and nuclear fractions and ITSN1 is increased on the order of 50% as measured in the cytoplasm, TIAM1, which is trisomic only in Ts65Dn, is increased, by ~40%, in the membrane but not in the cytoplasmic fraction. Trisomy also affects basal phosphorylation levels: cytoplasmic pAkt and nuclear pErk1/2 are significantly elevated, by ~30% and ~35%, respectively, in both Ts65Dn and Ts1Cje, as is GSK3B (as measured by Reverse Phase Protein Arrays (data not shown)). However, Ts1Cje mice alone show increased cytoplasmic pErk2.
Table 1.
Average protein levels in cortex for each genotype-treatment group
| Naive | + 0.4 mg/kg MK-801 | +0.8 mg/kg MK-801 | ||||
|---|---|---|---|---|---|---|
| Ts65Dn | Ts1Cje | Ts65Dn | Euploid | Ts1Cje | Euploid | |
| Chr21 | ||||||
| TIAM1,p2 | 143±15 *** | 90±13 | 113±26 | 130±11 ** | 120±20 | 134±13 * |
| TIAM1,c | 110±15 | 86±7.5 | 112±29 | 102±11 | 98±20 | 86±7 |
| DYRK1A,p2 | 125±6 *** | 129±4 * | 78±17 | 99±13 | 53±13 *** | 82±12 * |
| DYRK1A,n | 132±10 *** | 136±14 *** | 69±16 ** | 125±8 *** | 72±9 *** | 147±15 *** |
| ITSN1-200,c | 122±6 * | 164±48 * | 98±26 | 102±25 | 114±18 | 126±29 |
| ITSN1-140,c | 146±26 * | 183±74 * | 100±29 | 113±46 | 128±28 | 147±49 |
| Non-chr21 | ||||||
| tNR1,p2 | 93±11 | 97±11 | 116±10 | 95±12 | 102±22 | 93±13 |
| pNR1,p2 | 100±27 | 113±18 | 130±15 ** | 138±19 *** | 122±16 * | 134±20 ** |
| tAkt,c | 99±15 | 107±11 | 99±10 | 99±12 | 95±24 | 80±21 |
| pAkt,c | 129±12 *** | 135±8 *** | 96±10 | 131±3 *** | 102±4 | 133±12 *** |
| tErk1,c | 89±16 | 90±7 | 169±53 *** | 96±15 | 81±18 | 84±6 |
| pErk1,c | 109±24 | 113±28 | 92±17 | 91±30 | 127±46 | 105±18 |
| tErk2,c | 100±5 | 84±12 | 180±49 *** | 99±28 | 109±38 | 94±15 |
| pErk2,c | 108±31 | 125±18 * | 87±13 | 91±28 | 110±29 | 102±12 |
| tErk1,n | 94±8 | 97±4 | 79±14 * | 88±18 | 89±21 | 78±8 |
| pErk1,n | 132±10 *** | 140±10 ** | 75±14 *** | 95±20 | 108±31 | 132±12 ** |
| tErk2,n | 89±8 | 97±6 | 74±11 ** | 81±16 | 95±16 | 75±26 |
| pErk2,n | 136±16 *** | 141±10 *** | 63±16 *** | 100±19 | 112±35 | 131±11 ** |
| pElk,c | 110±13 | 94±15 | 93±18 | 106±18 | 95±20 | 95±21 |
| pElk,n | 90±9 | 95±7 | 97±14 | 88±8 | 79±12 | 102±19 |
| #pGSK3B,c | 179±9 ** | 161±9 ** | 132±20 * | 169±32 * | 179±35 * | 141±28 * |
Values (average plus SEM) of naive mice are relative to 100 for euploid controls. Values + MK-801 are relative to the same genotype without MK-801 treatment. Bold indicates significant differences, Tukey's t-test
p<0.05
p<0.01
p<0.001
cytoplasmic
nuclear
crude membrane fractions
data from reverse phase protein arrays.
Table 2.
Average protein levels in hippocampus for each genotype-treatment group
| Naive | +0.4 mg/kg MK-801 | +0.8 mg/kg MK-801 | ||||
|---|---|---|---|---|---|---|
| Ts65Dn | Ts1Cje | Ts65Dn | Euploid | Ts1Cje | Euploid | |
| Chr21 | ||||||
| TIAM1,p2 | 101±15 | 98±15 | 115±30 | 97±16 | 87±13 | 95±16 |
| TIAM1,s | 168±23 ** | 117±21 | 86±8 | 107±12 | 88±15 | 107±13 |
| DYRK1A,p2 | 113±13 | 124±4 *** | 143±27 | 131±33 | 78±18 ** | 74±6 ** |
| DYRK1A,s | 141±19 * | 106±18 | 96±17 | 117±17 | 95±11 | 105±15 |
| Non-chr21 | ||||||
| tNR1,p2 | 95±14 | 93±7 | 109±25 | 98±25 | 88±9 | 99±7 |
| pNR1,p2 | 100±11 | 101±10 | 106±10 | 99±10 | 141±11 ** | 137±6 ** |
| tAkt | 88±12 | 103±6 | 96±8 | 106±11 | 104±10 | 117±17 |
| pAkt | 139±13 *** | 113±21 | 121±14 | 94±7 | 88±15 | 107±13 |
| tErk1,s | nd | 105±11 | nd | nd | 96±21 | 108±15 |
| pErk1,s | 160±27 * | 128±10 * | 89±10 | 106±6 | 85±11 * | 107±10 |
| tErk2,s | nd | 105±12 | nd | nd | 99±18 | 106±11 |
| pErk2,s | 148±20 * | 172±19 *** | 102±19 | 110±11 | 68±8 *** | 117±13 |
| pElk,s | 138±12 * | 104±12 | 87±13 | 95±16 | 91±19 | 95±13 |
Values (average plus SEM) of naive mice are relative to 100 for euploid controls. Values + MK-801 are relative to the same genotype without MK-801 treatment. Bold indicates significant differences, Tukey's t-test
p<0.05
p<0.01
p<0.001
crude membrane fraction
soluble fraction
not determined
For euploid mice, MK-801 treatment results in increased phosphorylation, by ~30%-35%, of the NMDAR NR1 subunit and Akt, with no change in associated total protein levels (Table 1, columns 4 and 6). These changes are independent of dosage and are consistent with previously published reports (Ahn et al 2005, 2006b). At the higher dose, pErk1/2 in the nucleus is also increased, and there is a suggestion of a decrease in total Erk1/2 levels, implying translocation to the cytoplasm and degradation. Changes in Erk1 and Erk2 were not reported by Ahn et al (2005, 2006b), possibly because they were masked by use of whole tissue protein lysates. Interestingly, chr21 proteins also participate in or are affected by MK-801. Levels of TIAM1 at the membrane and DYRK1A in the nucleus are increased, by ~30% and 25-45%, respectively, at both doses, and DYRK1A is decreased in the membrane fraction at the higher dose. Thus, chr21 proteins are part of the normal MK-801 molecular response, and when overexpressed in trisomy may contribute to abnormal molecular and behavioral responses.
For trisomy mice, to emphasize responses (or lack thereof) to MK-801, data in Tables 1 and 2 are given relative to the same genotype without drug (i.e. a value of 100 indicates a protein level is unchanged by MK-801). Both Ts65Dn and Ts1Cje mice respond to MK-801 similarly to euploid controls with 20%-30% increases in pNR1. Therefore, abnormalities in NMDAR function implied by behavioral responses to MK-801 must be due to abnormalities in the dynamics of changes in phosphorylation of NR1, in the phosphorylation of other sites in NR1 or other NMDAR subunits, or in downstream signaling. However, it is noteworthy that, in contrast to euploid controls, levels of pAkt, which were already elevated in naïve mice, do not increase, suggesting failed dynamic responses. Also in contrast to euploid mice, there are no changes in TIAM1 membrane levels, and rather than increases in nuclear DYRK1A, these levels actually decrease in trisomy, as do membrane levels. A contribution of the App-Sod1 region in trisomy is implied by the changes in Erk1/2 distribution that are unique to Ts65Dn mice. Nuclear levels of both tErk1/2 and pErk1/2 decrease to ~70% of basal, with an associated significant increase in cytoplasmic tErk2, suggesting stimulation of a coordinated dephosphorylation and nuclear-cytoplasmic translocation. Thus, trisomy is associated with both failed responses and abnormal responses to MK-801.
Data in Table 2 show that basal levels and responses to MK-801 in hippocampus are significantly different from those in cortex and are different both between the two trisomies and between trisomy and euploid. In trisomy, again, TIAM1 and DYRK1A are elevated in Ts65Dn mice, but now it is only in the soluble fraction, instead of the membrane; in the Ts1Cje mice, DYRK1A is elevated in the membrane fraction. Basal levels of pErk1/2 are elevated similar to cortex in both Ts65Dn and Ts1Cje mice, however, elevated pAkt is specific to Ts65Dn mice, as is a novel elevation in pElk. In response to MK-801, in euploid controls at the lower dose, no effect on pNR1 levels is seen, which is consistent with reports from Ahn et al (2005). However, at the higher dose, pNR1 levels increase, as in cortex, and DYRK1A levels decrease. There are no changes in TIAM1 at either dose. In Ts65Dn mice, membrane levels of DYRK1A increase; in Ts1Cje mice, responses are similar to euploid controls with the exception of decreases in levels of pErk1/2.
Individual variation
The magnitude of response to MK-801 varied among individuals of the same genotype. The number of photocell interruptions per 5 minutes varied from 300 to 800 for Ts65Dn and from 100 to1000 for Ts1Cje (data not shown). Inter-individual variations in RNA expression levels of trisomic genes in DS-derived cell lines and Ts65Dn tissues have been reported recently and suggested to be a cause of behavioral variations in trisomy (Prandini et al 2007; Ait Yahya-Graison et al 2007; Sultan et al 2007). At the protein level measured here, some individual variations also were noted. For example, among trisomic proteins, one of four naïve Ts1Cje mice showed no elevation of Dyrk1a in the membrane fraction and one of four Ts65Dn treated with MK-801 showed no elevation of Tiam1 in the cytoplasm, while conversely one euploid mouse showed elevated levels of Tiam1. At the phosphorylation level, one naïve Ts65Dn mouse showed no elevation of pAkt in cortex or hippocampus but showed aberrant elevation of pNR1, and, conversely, one euploid mouse failed to show increased phosphorylation of NR1 with MK-801 (complete data for all mice in cortex and hippocampus are provided in Supplementary Tables 1-4). Comparisons of protein levels in individual mice with their locomotor activity showed no significant correlation (data not shown), but the number of mice is small and data are suggestive of statistical significance for some proteins if larger numbers of animals are examined. On the other hand, protein levels are dynamic in vivo, and for phosphorylation in particular, the time frame of some transient effects is on the order of tens of minutes (Sala et al 2000; Sananbenesi et al 2002). Phosphorylation is also unstable post mortem. While standard procedures (inclusion of phosphatase inhibitors, rapid and cold temperature tissue processing) are designed to minimize dephosphorylation, artifactual losses cannot be discounted. In addition, post mortem dephosphorylation is not random, with different sites reported to be more or less labile (O'Callaghan & Sriram 2004; Suneja et al 2006). Therefore, individual variations in protein levels may stem, in part, from technical issues.
Discussion
Based on the known functions and interactions of chr21 proteins, as illustrated in Figure 1, calcineurin activity is predicted to be inhibited and NMDAR-mediated signaling is predicted to be perturbed in Ts65Dn and Ts1Cje mice. The rationale for selection of MK-801-induced locomotor hyperactivity as a behavioral measure of these perturbations has been discussed in Costa et al (2008). It was originally suggested by observations of Miyakawa et al (2003) who demonstrated increased sensitivity to MK-801 in mice engineered to lack calcineurin activity in hippocampus and cortex. The advantages of this measure for studies of mouse models of DS are the correlation of molecular changes with behavioral responses, the restricted time frame in which both types of changes occur, and the involvement of many of the same signaling pathways and molecules (calcineurin, Erk1/2, Elk, etc) that are required for or responsive to tests of learning and memory relevant to DS (Ahn et al 2005, 2006b; Sanabenesi et al 2002). Thus, many molecular abnormalities, elevated basal levels and failed dynamic responses, seen here in trisomy mice with MK-801 can be postulated also to contribute to learning and memory deficits seen in, for example, contextual fear conditioning or the Morris Water Maze. Therefore, our results can form a basis to guide experiments that directly assay learning and memory, where the time frame of relevant molecular events may be less easy to delimit.
Here we have shown that, relative to euploid controls, Ts1Cje mice show increased sensitivity to the locomotor stimulatory effects of the NMDAR antagonist, MK-801. This response is similar to that demonstrated previously for Ts65Dn mice (Costa et al 2008), although Ts1Cje mice appear less responsive than Ts65Dn mice. Specifically, while two-way RM ANOVA failed to identify any genotype differences in total activity or rearing, similar analysis for ambulatory activity showed a decreased sensitivity of Ts1Cje mice relative to Ts65Dn mice.
Relevant to the behavioral phenotype, both Ts65Dn and Ts1Cje mice show abnormalities in molecular features when compared to euploid controls. These abnormalities can be summarized as follows (Table 3): (i) in euploid mice, molecular responses to MK-801 involve the chr21 proteins TIAM1 and DYRK1A in cortex and hippocampus, in addition to phosphorylation of NR1, Erk1/2, Akt and Gsk3b; (ii) in Ts65Dn and Ts1Cje mice, basal levels of phosphorylation of Akt, Erk1/2, Elk and Gsk3b are elevated in cortex and/or hippocampus, in addition to the gene dosage increases in levels of TIAM1 and DYRK1A; and (iii) in Ts65Dn and Ts1Cje mice, molecular responses to MK-801 are abnormal (DYRK1A, pErk1/2) or absent (pAkt and TIAM1), although phosphorylation levels at Ser897 of the NR1 subunit are normal. We note that, while some inter-individual variations in protein levels and locomotor activity were observed (Supplementary Tables 1-4), analysis of larger numbers of mice will be required to ascertain possible correlations.
Table 3.
Summary of qualitative genotype differences and MK-801-induced changes
| CORTEX | HIPPOCAMPUS | |||||
|---|---|---|---|---|---|---|
| Ts65Dn naïve | Ts65Dn + 0.4 mg/kg | Euploid + 0.4 mg/kg | Ts65Dn naïve | Ts65Dn + 0.4 mg/kg | Euploid + 0.4 mg/kg | |
| +pNr1,p2 | +pNr1,p2 | |||||
| +TIAM1,p2 | +TIAM1,p2 | +TIAM1,s | ||||
| +DYRK1A,p2 | -DYRK1A,p2 | +DYRK1A,s | +DYRK1A,p2 | +DYRK1A,p2 | ||
| +DYRK1A,n | -DYRK1A,n | +DYRK1A,n | ||||
| +ITSN1,c | +ITSN1,s | |||||
| +pErk1,n | -pErk1,n | +pErk1,s | ||||
| +pErk2,n | -pErk2,n | +pErk2,s | ||||
| +pAkt,c | +pAkt,c | +pAkt,s | ||||
| +tErk1,c | ||||||
| +tErk2,c | +pElk,s | |||||
| Ts1Cje naive | Ts1Cje + 0.8 mg/kg | Euploid + 0.8 mg/kg | Ts1Cje naive | Ts1Cje + 0.8 mg/kg | Euploid + 0.8 mg/kg | |
| +pNr1,p2 | +pNR1,p2 | +pNR1,p2 | +pNR1,p2 | |||
| +TIAM1,p2 | ||||||
| +DYRK1A,p2 | -DYRK1A,p2 | -DYRK1A,p2 | +DYRK1A,p2 | -DYRK1A,p2 | -DYRK1A,p2 | |
| +DYRK1A,n | -DYRK1A,n | +DYRK1A,n | ||||
| +ITSN1,c | ||||||
| +pErk1,n | +pErk1,n | +pErk1,s | -pErk1,s | |||
| +pErk2,n | +pErk2,n | +pErk2,s | -pErk2,s | |||
| +pErk2,c | ||||||
| +pAkt,c | +pAkt,c | |||||
Data summarized from Tables 1,2. For naïve mice, + indicates increased levels relative to euploid controls. For Ts65Dn and euploid samples at 0.4 mg/kg and for Ts1Cje and euploid samples at 0.8 mg/kg MK-801, + and -indicate protein levels increased and decreased, respectively, relative to the same genotype without MK-801 injection.
We had previously reported abnormal pErk1/2 levels in Ts65Dn (Gardiner et al 2004). Levels were elevated in hippocampus of two and 16 month old mice, but depressed in five month old mice. The observations here of elevated levels in 7-8 month old mice suggest the age-dependent switch occurs shortly after 5 months of age. Phosphorylation abnormalities in Ts65Dn mice have also been reported by Siarey et al (2006), where ratios of pAkt:tAkt and pCaMKII:tCaMKII were both elevated in hippocampus and Akt ratios also failed to display the normal (euploid) increases after induction of long term potentiation (LTP). In contrast, however, they reported decreased levels of pErk1/2:tErk1/2, likely due to the younger age of the mice used (2-4 months versus 7-8 months here). However, use of the ratio also masks potential changes in total protein levels due to degradation.
MK-801 targets the NMDAR as a high affinity channel blocker. Additional studies with Ts65Dn showed that the moderate affinity uncompetitive NMDAR antagonist, memantine, ameliorated the deficit in contextual fear conditioning (CFC)(Costa et al 2008), a task known to require a functional hippocampus and to signal through pErk1/2 and pElk (Sananbenesi et al 2002). The responses of Ts65Dn mice to MK-801 and memantine, which antagonize NMDAR by different mechanisms, support the hypothesis of defects in NMDAR-mediated signaling. The observation of normal increases in phosphorylation of Ser897 of the NR1 subunit does not negate this hypothesis but instead suggests possibly altered dynamics of phosphorylation-dephosphorylation. Therefore, it will be important to investigate the time frame of NMDAR phosphorylation changes after MK-801 treatment, as well as phosphorylation of other sites within NR1 and other NMDAR subunits. Alternatively, Roberson et al. (2008) recently postulated a role for impaired trafficking of the NR2B subunit in Ts65Dn based on their observation of a significant decrease, compared to controls, in the levels of the kinesin motor protein, KIF17. While levels of both NR2B and NR2A were normal in Ts65Dn mice, as measured in whole brain lysates, this does not rule out possible abnormalities in distribution or dynamics of trafficking.
The summary of molecular data in Table 3 are complex but this complexity is not unreasonable given what is known about NMDAR, calcineurin and calmodulin signaling, and given the fact that the Ts65Dn mice are trisomic for 94 and Ts1Cje for 70 protein coding genes. The trisomic genes common to Ts65Dn and Ts1Cje, i.e. spanning from just distal to Sod1 to the chr16 telomere and including Synj1, Itsn1, Rcan1, Dyrk1a and Pcp4 of the candidates, may be responsible for the unstimulated elevations in levels of nuclear pErk1/2 seen in both models in cortex and hippocampus, while genes in the App-Sod1 region, including App, Bach1, Tiam1 and Sod1, may contribute to the elevation of pAkt and pElk in hippocampus, and the dynamic pErk1/2 changes in response to MK-801, because these are unique to the Ts65Dn. The hyperphosphorylation of Erk1/2, Elk, Akt and GSK3B in saline injected mice implies increased phosphorylation, decreased dephosphorylation, or a more complicated imbalance between the two. The failure to observe normal phosphorylation responses to MK-801 in trisomy implies that either normal changes do not occur, or because of elevated basal levels, they are too subtle for observation by Western analysis, or they occur in a different time frame, e.g. returning to basal levels more quickly than euploid, such that changes are not observed. Notably, in vitro studies indicate that normal changes in pErk1/2 levels due to NMDAR activation are transient (Sala et al 2000; Sananbenesi et al 2002), and that DYRK1A overexpression prolongs pErk1/2 activation (Kelly and Rahmani, 2004). It is not clear if normal behavioral responses, that include locomotor activity and successful learning, require a specific level of transient phosphorylation, specific timing of the phosphorylation change, or a specific relative magnitude of change in phosphorylation. It is clear, however, that both increases and decreases in basal protein activity in signaling pathways can cause impaired learning (e.g. ras (Shen et al 2000), CaMKII (Costa et al 2002)) and that pharmacological blocking of dynamic responses impairs normal learning (Blum et al 1999). Further, it cannot be assumed that all abnormalities in naïve mice are relevant to or predictive of abnormalities in NMDAR responses, however, it is reasonable to assume that failed dynamic molecular responses are connected to abnormal behavioral responses.
We emphasize that, while the nine chr21 genes in Figure 1 are reasonable candidates to work in concert to perturb NMDAR-mediated signaling in trisomy, additional chr21 genes are also candidates for direct and indirect contributions to impaired behavior/learning/memory (reviewed in Gardiner and Costa 2006). Connections to chr21 proteins of additional behavioral and molecular features must also be made. The recent demonstrations that the GABA receptor antagonist, pentylene tetrazole (PTZ), corrects the Ts65Dn deficit in the hippocampal-based tasks, novel object recognition and the Morris water maze, are one example (Fernandez et al 2007; Rueda et al 2008). No chr21 protein functions are known to directly predict impaired GABA receptor function in DS, although an indirect connection occurs through inhibition of calcineurin by chr21 proteins (Figure 1). The GABA receptor subunit, GABRG2, is a target of calcineurin and inhibition of GABRG2 dephosphorylation blocks induction of long term depression (LTD) at inhibitory synapses (Wang et al 2003). Abnormalities in the levels or distributions of other nonchr21 proteins relevant to learning and behavior, including BDNF, cAMP, PLC, PKA/PKC and NGF, have also been observed (Bimonte-Nelson et al 2003; Dierssen et al 1997; Ruiz de Azua et al 2001; Siarey et al 2006; Cooper et al 2001). Together these implicate potential perturbations in multiple pathways, involving multiple mechanisms of activation and including cross talk among pathways.
These complexities emphasize the limitations of the current analysis and the challenges inherent to identifying critical molecular abnormalities in DS. In this respect, DS is analogous to multifactorial diseases, such as arthritis, heart disease and sporadic Alzheimer's disease, etc, where causative contributions arise from variations in multiple genes. Ideally, development of therapeutics for cognitive deficits in DS will be knowledge-based, i.e. derived from functional connections between chr21-encoded proteins and critical learning/memory pathways. DS, as a segmental trisomy, therefore requires comprehensive pathway analysis, considerably expanded from single gene models that attempt to connect individual chr21 genes with individual molecular, electrophysiological or behavioral responses.
Supplementary Material
Acknowledgements
This work was supported by the Fondation Jerome Lejeune, National Institutes of Health HD047671, HD049460 and HD056235 (KG), the Anna and John J. Sie Foundation and the Coleman Institute for Cognitive Disabilities.
References
- Abbeduto L, Warren SF, Conners FA. Language development in Down syndrome: from the prelinguistic period to the acquisition of literacy. Ment Retard Dev Disabil Res Rev. 2007;13:247–61. doi: 10.1002/mrdd.20158. [DOI] [PubMed] [Google Scholar]
- Adayev T, Chen-Hwang MC, Murakami N, Wang R, Hwang YW. MNB/DYRK1A phosphorylation regulates the interactions of synaptojanin 1 with endocytic accessory proteins. Biochem Biophys Res Commun. 2006;35:1060–5. doi: 10.1016/j.bbrc.2006.10.169. [DOI] [PMC free article] [PubMed] [Google Scholar]
- Ahn KJ, Jeong HK, Choi HS, Ryoo SR, Kim YJ, Goo JS, Choi SY, Han JS, Ha I, Song WJ. DYRK1A BAC transgenic mice show altered synaptic plasticity with learning and memory defects. Neurobiol Dis. 2006a;22:463–72. doi: 10.1016/j.nbd.2005.12.006. [DOI] [PubMed] [Google Scholar]
- Ahn YM, Seo MS, Kim SH, Kim Y, Juhnn YS, Kim YS. The effects of MK-801 on the phosphorylation of Ser338-c-Raf-MEK-ERK pathway in the rat frontal cortex. Int J Neuropsychopharmacol. 2006b;9:451–6. doi: 10.1017/S1461145705005882. [DOI] [PubMed] [Google Scholar]
- Ahn YM, Seo MS, Kim SH, Kim Y, Yoon SC, Juhnn YS, Kim YS. Increased phosphorylation of Ser473-Akt, Ser9-GSK-3beta and Ser133-CREB in the rat frontal cortex after MK-801 intraperitoneal injection. Int J Neuropsychopharmacol. 2005;8:607–13. doi: 10.1017/S1461145705005353. [DOI] [PubMed] [Google Scholar]
- Aït Yahya-Graison E, Aubert J, Dauphinot L, Rivals I, Prieur M, Golfier G, Rossier J, Personnaz L, Creau N, Bléhaut H, Robin S, Delabar JM, Potier MC. Classification of human chromosome 21 gene-expression variations in Down syndrome: impact on disease phenotypes. Am J Hum Genet. 2007;81:475–91. doi: 10.1086/520000. [DOI] [PMC free article] [PubMed] [Google Scholar]
- Bimonte-Nelson HA, Hunter CL, Nelson ME, Granholm AC. Frontal cortex BDNF levels correlate with working memory in an animal model of Down syndrome. Behav Brain Res. 2003;139:47–57. doi: 10.1016/s0166-4328(02)00082-7. [DOI] [PubMed] [Google Scholar]
- Blum S, Moore AN, Adams F, Dash PK. A mitogen-activated protein kinase cascade in the CA1/CA2 subfield of the dorsal hippocampus is essential for long-term spatial memory. J Neurosci. 1999;19:3535–44. doi: 10.1523/JNEUROSCI.19-09-03535.1999. [DOI] [PMC free article] [PubMed] [Google Scholar]
- CDC, Centers for Disease Control and Prevention Improved National Prevalence Estimates for 18 Major Birth Defects. MMWR. 2006;54:6–12. [Google Scholar]
- Chapman RS, Hesketh LJ. Behavioral phenotype of individuals with Down syndrome. Ment Retard Dev Disabil Res Rev. 2000;6:84–95. doi: 10.1002/1098-2779(2000)6:2<84::AID-MRDD2>3.0.CO;2-P. [DOI] [PubMed] [Google Scholar]
- Choe ES, Shin EH, Wang JQ. Inhibition of protein phosphatase 2B upregulates serine phosphorylation of N-methyl-D-aspartate receptor NR1 subunits in striatal neurons in vivo. Neurosci Lett. 2005;384:38–43. doi: 10.1016/j.neulet.2005.04.044. [DOI] [PubMed] [Google Scholar]
- Chrast R, Scott HS, Madani R, Huber L, Wolfer DP, Prinz M, Aguzzi A, Lipp HP, Antonarakis SE. Mice trisomic for a bacterial artificial chromosome with the single-minded 2 gene (Sim2) show phenotypes similar to some of those present in the partial trisomy 16 mouse models of Down syndrome. Hum Mol Genet. 2000;9:1853–64. doi: 10.1093/hmg/9.12.1853. [DOI] [PubMed] [Google Scholar]
- Cooper JD, Salehi A, Delcroix JD, Howe CL, Belichenko PV, Chua-Couzens J, Kilbridge JF, Carlson EJ, Epstein CJ, Mobley WC. Failed retrograde transport of NGF in a mouse model of Down's syndrome: reversal of cholinergic neurodegenerative phenotypes following NGF infusion. Proc Natl Acad Sci U S A. 2001;98:10439–44. doi: 10.1073/pnas.181219298. [DOI] [PMC free article] [PubMed] [Google Scholar]
- Costa AC, Scott-McKean JJ, Stasko MR. Acute Injections of the NMDA Receptor Antagonist Memantine Rescue Performance Deficits of the Ts65Dn Mouse Model of Down Syndrome on a Fear Conditioning Test. Neuropsycopharmacology. 2008;33:1624–32. doi: 10.1038/sj.npp.1301535. [DOI] [PubMed] [Google Scholar]
- Costa RM, Federov NB, Kogan JH, Murphy GG, Stern J, Ohno M, Kucherlapati R, Jacks T, Silva AJ. Mechanism for the learning deficits in a mouse model of neurofibromatosis type 1. Nature. 2002;415:526–530. doi: 10.1038/nature711. [DOI] [PubMed] [Google Scholar]
- Das M, Scappini E, Martin NP, Wong KA, Dunn S, Chen YJ, Miller SL, Domin J, O'Bryan JP. Regulation of neuron survival through an intersectin-phosphoinositide 3'-kinase C2beta-AKT pathway. Mol Cell Biol. 2007;27:7906–17. doi: 10.1128/MCB.01369-07. [DOI] [PMC free article] [PubMed] [Google Scholar]
- Davisson MT, Schmidt C, Reeves RH, Irving NG, Akeson EC, Harris BS, Bronson RT. Segmental trisomy as a mouse model for Down syndrome. Prog. Clin. Biol. Res. 1993;384:117–133. [PubMed] [Google Scholar]
- Dierssen M, Vallina IF, Baamonde C, García-Calatayud S, Lumbreras MA, Flórez J. Alterations of central noradrenergic transmission in Ts65Dn mouse, a model for Down syndrome. Brain Res. 1997;749:238–44. doi: 10.1016/s0006-8993(96)01173-0. [DOI] [PubMed] [Google Scholar]
- Dierssen M, Fillat C, Crnic L, Arbonés M, Flórez J, Estivill X. Murine models for Down syndrome. Physiol Behav. 73:859–71. doi: 10.1016/s0031-9384(01)00523-6. [DOI] [PubMed] [Google Scholar]
- Ermak G, Harris CD, Battocchio D, Davies KJ. RCAN1 (DSCR1 or Adapt78) stimulates expression of GSK-3beta. FEBS J. 2006;273:2100–9. doi: 10.1111/j.1742-4658.2006.05217.x. [DOI] [PubMed] [Google Scholar]
- Fernandez F, Morishita W, Zuniga E, Nguyen J, Blank M, Malenka RC, Garner CC. Pharmacotherapy for cognitive impairment in a mouse model of Down syndrome. Nat Neurosci. 2007;10:411–3. doi: 10.1038/nn1860. [DOI] [PubMed] [Google Scholar]
- Fleming IN, Batty IH, Prescott AR, Gray A, Kular GS, Stewart H, Downes CP. Inositol phospholipids regulate the guanine-nucleotide-exchange factor Tiam1 by facilitating its binding to the plasma membrane and regulating GDP/GTP exchange on Rac1. Biochem J. 2004;382:857–65. doi: 10.1042/BJ20040916. [DOI] [PMC free article] [PubMed] [Google Scholar]
- Fleming IN, Elliott CM, Exton JH. Phospholipase C-gamma, protein kinase C and Ca2+/calmodulin-dependent protein kinase II are involved in platelet-derived growth factor-induced phosphorylation of Tiam1. FEBS Lett. 1998;429:229–33. doi: 10.1016/s0014-5793(98)00566-3. [DOI] [PubMed] [Google Scholar]
- Gardiner K, Davisson MT, Crnic LS. Building protein interaction maps for Down syndrome. Briefings Funct Genom Proteom. 2004;3:142–156. doi: 10.1093/bfgp/3.2.142. [DOI] [PubMed] [Google Scholar]
- Gardiner K. Transcriptional dysregulation in Down syndrome: predictions for altered protein complex stoichiometries and post-translational modifications, and consequences for learning/behavior genes ELK, CREB, and the estrogen and glucocorticoid receptors. Behav Genet. 2006;36:439–53. doi: 10.1007/s10519-006-9051-1. [DOI] [PubMed] [Google Scholar]
- Gardiner K, Costa AC. The proteins of human chr21. Am J Med Genet C Semin Med Genet. 2006;142:196–205. doi: 10.1002/ajmg.c.30098. [DOI] [PMC free article] [PubMed] [Google Scholar]
- Hoeffer CA, Dey A, Sachan N, Wong H, Patterson RJ, Shelton JM, Richardson JA, Klann E, Rothermel BA. The Down syndrome critical region protein RCAN1 regulates long-term potentiation and memory via inhibition of phosphatase signaling. J Neurosci. 2007;27:13161–72. doi: 10.1523/JNEUROSCI.3974-07.2007. [DOI] [PMC free article] [PubMed] [Google Scholar]
- Hyde LA, Crnic LS. Age-related deficits in context discrimination learning in Ts65Dn mice that model Down syndrome and Alzheimer's disease. Behav Neurosci. 2001;115:1239–46. [PubMed] [Google Scholar]
- Kelly PA, Rahmani Z. DYRK1A enhances the mitogen-activated protein kinase cascade in PC12 cells by forming a complex with Ras, B-Raf, and MEK1. Mol Biol Cell. 2005;16:3562–73. doi: 10.1091/mbc.E04-12-1085. [DOI] [PMC free article] [PubMed] [Google Scholar]
- Liu DP, Schmidt C, Billings T, Davisson MT. A Quantitative PCR Genotyping Assay for the Ts65Dn Mouse Model of Down Syndrome. Biotechniques. 2003;35:1170–1174. doi: 10.2144/03356st02. [DOI] [PubMed] [Google Scholar]
- Lott IT, Head E, Doran E, Busciglio J. Beta-amyloid, oxidative stress and down syndrome. Curr Alzheimer Res. 2006;3:521–8. doi: 10.2174/156720506779025305. [DOI] [PubMed] [Google Scholar]
- Mertens AE, Roovers RC, Collard JG. Regulation of Tiam1-Rac signalling. FEBS Lett. 2003;546:11–6. doi: 10.1016/s0014-5793(03)00435-6. [DOI] [PubMed] [Google Scholar]
- Mohney RP, Das M, Bivona TG, Hanes R, Adams AG, Philips MR, O'Bryan JP. Intersectin activates Ras but stimulates transcription through an independent pathway involving JNK. J Biol Chem. 2003;278:47038–45. doi: 10.1074/jbc.M303895200. [DOI] [PubMed] [Google Scholar]
- Nadel L. Down's syndrome: a genetic disorder in biobehavioral perspective. Genes Brain Behav. 2003;2:156–166. doi: 10.1034/j.1601-183x.2003.00026.x. [DOI] [PubMed] [Google Scholar]
- Nishimura T, Yamaguchi T, Tokunaga A, Hara A, Hamaguchi T, Kato K, Iwamatsu A, Okano H, Kaibuchi K. Role of numb in dendritic spine development with a Cdc42 GEF intersectin and EphB2. Mol Biol Cell. 2006;17:1273–85. doi: 10.1091/mbc.E05-07-0700. [DOI] [PMC free article] [PubMed] [Google Scholar]
- O'Callaghan JP, Sriram K. Focused microwave irradiation of the brain preserves in vivo protein phosphorylation: comparison with other methods of sacrifice and analysis of multiple phosphoproteins. J Neurosci Methods. 2004;135:159–68. doi: 10.1016/j.jneumeth.2003.12.006. [DOI] [PubMed] [Google Scholar]
- Papadia S, Hardingham GE. The dichotomy of NMDA receptor signaling. Neuroscientist. 2007;13:572–9. doi: 10.1177/10738584070130060401. [DOI] [PMC free article] [PubMed] [Google Scholar]
- Pennington BF, Moon J, Edgin J, Stedron J, Nadel L. The neuropsychology of Down syndrome: evidence for hippocampal dysfunction. Child Dev. 2003;74:75–93. doi: 10.1111/1467-8624.00522. [DOI] [PubMed] [Google Scholar]
- Prandini P, Deutsch S, Lyle R, Gagnebin M, Delucinge Vivier C, Delorenzi M, Gehrig C, Descombes P, Sherman S, Dagna Bricarelli F, Baldo C, Novelli A, Dallapiccola B, Antonarakis SE. Natural gene-expression variation in Down syndrome modulates the outcome of gene-dosage imbalance. Am J Hum Genet. 2007;8:252–63. doi: 10.1086/519248. [DOI] [PMC free article] [PubMed] [Google Scholar]
- Putkey JA, Kleerekoper Q, Gaertner TR, Waxham MN. A new role for IQ motif proteins in regulating calmodulin function. J Biol Chem. 2003;278:49667–70. doi: 10.1074/jbc.C300372200. [DOI] [PubMed] [Google Scholar]
- Reichard JF, Motz GT, Puga A. Heme oxygenase-1 induction by NRF2 requires inactivation of the transcriptional repressor BACH1. Nucleic Acids Res. 2007;35:7074–86. doi: 10.1093/nar/gkm638. [DOI] [PMC free article] [PubMed] [Google Scholar]
- Roberson R, Toso L, Abebe D, Spong CY. Altered expression of KIF17, a kinesin motor protein associated with NR2B trafficking, may mediate learning deficits in a Down syndrome mouse model. Am J Obstet Gynecol. 2008;198:313.e1–4. doi: 10.1016/j.ajog.2008.01.033. [DOI] [PMC free article] [PubMed] [Google Scholar]
- Rothermel BA, Vega RB, Williams RS. The role of modulatory calcineurin-interacting proteins in calcineurin signaling. Trends Cardiovasc Med. 2003;13:15–21. doi: 10.1016/s1050-1738(02)00188-3. [DOI] [PubMed] [Google Scholar]
- Rueda N, Flórez J, Martínez-Cué C. Chronic pentylenetetrazole but not donepezil treatment rescues spatial cognition in Ts65Dn mice, a model for Down syndrome. Neurosci Lett. 2008;433:22–7. doi: 10.1016/j.neulet.2007.12.039. [DOI] [PubMed] [Google Scholar]
- Ruiz de Azúa I, Lumbreras MA, Zalduegui A, Baamonde C, Dierssen M, Flórez J, Sallés J. Reduced phospholipase C-beta activity and isoform expression in the cerebellum of TS65Dn mouse: a model of Down syndrome. J Neurosci Res. 2001;66:540–50. doi: 10.1002/jnr.10019. [DOI] [PubMed] [Google Scholar]
- Sago H, Carlson EJ, Smith DJ, Kilbridge J, Rubin EM, Mobley WC, Epstein CJ, Huang TT. Ts1Cje, a partial trisomy 16 mouse model for Down syndrome, exhibits learning and behavioral abnormalities. Proc Natl Acad Sci USA. 1998;95:6256–6261. doi: 10.1073/pnas.95.11.6256. [DOI] [PMC free article] [PubMed] [Google Scholar]
- Sala C, Rudolph-Correia S, Sheng M. Developmentally regulated NMDA receptor-dependent dephosphorylation of cAMP response element-binding protein (CREB) in hippocampal neurons. J Neurosci. 2000;20:3529–36. doi: 10.1523/JNEUROSCI.20-10-03529.2000. [DOI] [PMC free article] [PubMed] [Google Scholar]
- Sananbenesi F, Fischer A, Schrick C, Spiess J, Radulovic J. Phosphorylation of hippocampal Erk-1/2, Elk-1, and p90-Rsk-1 during contextual fear conditioning: interactions between Erk-1/2 and Elk-1. Mol Cell Neurosci. 2002;21:463–76. doi: 10.1006/mcne.2002.1188. [DOI] [PubMed] [Google Scholar]
- Sérégaza Z, Roubertoux PL, Jamon M, Soumireu-Mourat B. Mouse models of cognitive disorders in trisomy 21: a review. Behav Genet. 2006;36:387–404. doi: 10.1007/s10519-006-9056-9. [DOI] [PubMed] [Google Scholar]
- Shen K, Teruel MN, Connor JH, Shenolikar S, Meyer T. Molecular memory by reversible translocation of calcium/calmodulin-dependent protein kinase II. Nat Neurosci. 2000;3:881–6. doi: 10.1038/78783. [DOI] [PubMed] [Google Scholar]
- Sheu FS, Azmitia EC, Marshak DR, Parker PJ, Routtenberg A. Glial-derived S100b protein selectively inhibits recombinant beta protein kinase C (PKC) phosphorylation of neuron-specific protein F1/GAP43. Brain Res Mol Brain Res. 1994;21:62–6. doi: 10.1016/0169-328x(94)90378-6. [DOI] [PubMed] [Google Scholar]
- Siarey RJ, Kline-Burgess A, Cho M, Balbo A, Best TK, Harashima C, Klann E, Galdzicki Z. Altered signaling pathways underlying abnormal hippocampal synaptic plasticity in the Ts65Dn mouse model of Down syndrome. J Neurochem. 2006;98:1266–77. doi: 10.1111/j.1471-4159.2006.03971.x. [DOI] [PubMed] [Google Scholar]
- Snyder EM, Nong Y, Almeida CG, Paul S, Moran T, Choi EY, Nairn AC, Salter MW, Lombroso PJ, Gouras GK, Greengard P. Regulation of NMDA receptor trafficking by amyloid-beta. Nat Neurosci. 2005;8:1051–8. doi: 10.1038/nn1503. [DOI] [PubMed] [Google Scholar]
- Sugimoto T, Stewart S, Guan KL. The calcium/calmodulin-dependent protein phosphatase calcineurin is the major Elk-1 phosphatase. J Biol Chem. 1997;272:29415–8. doi: 10.1074/jbc.272.47.29415. [DOI] [PubMed] [Google Scholar]
- Sultan M, Piccini I, Balzereit D, Herwig R, Saran NG, Lehrach H, Reeves RH, Yaspo ML. Gene expression variation in ‘Down syndrome’ mice allows to prioritize candidate genes. Genome Biol. 2007;8:R91. doi: 10.1186/gb-2007-8-5-r91. [DOI] [PMC free article] [PubMed] [Google Scholar]
- Suneja SK, Mo Z, Potashner SJ. Phospho-CREB and other phospho-proteins: improved recovery from brain tissue. J Neurosci Methods. 2006;150:238–41. doi: 10.1016/j.jneumeth.2005.06.010. [DOI] [PubMed] [Google Scholar]
- Tian J, Karin M. Stimulation of Elk1 transcriptional activity by mitogen-activated protein kinases is negatively regulated by protein phosphatase 2B (calcineurin) J Biol Chem. 1999;274:15173–80. doi: 10.1074/jbc.274.21.15173. [DOI] [PubMed] [Google Scholar]
- Tolias KF, Bikoff JB, Burette A, Paradis S, Harrar D, Tavazoie S, Weinberg RJ, Greenberg ME. The Rac1-GEF Tiam1 couples the NMDA receptor to the activity-dependent development of dendritic arbors and spines. Neuron. 2005;45:525–38. doi: 10.1016/j.neuron.2005.01.024. [DOI] [PubMed] [Google Scholar]
- Wang J, Liu S, Haditsch U, Tu W, Cochrane K, Ahmadian G, Tran L, Paw J, Wang Y, Mansuy I, Salter MM, Lu YM. Interaction of calcineurin and type-A GABA receptor gamma 2 subunits produces long-term depression at CA1 inhibitory synapses. J Neurosci. 2003;23:826–36. doi: 10.1523/JNEUROSCI.23-03-00826.2003. [DOI] [PMC free article] [PubMed] [Google Scholar]
- Wang JQ, Fibuch EE, Mao L. Regulation of mitogen-activated protein kinases by glutamate receptors. J Neurochem. 2007;100:1–11. doi: 10.1111/j.1471-4159.2006.04208.x. [DOI] [PubMed] [Google Scholar]
- Winder DG, Sweatt JD. Roles of serine/threonine phosphatases in hippocampal synaptic plasticity. Nat Rev Neurosci. 2001;2:461–74. doi: 10.1038/35081514. [DOI] [PubMed] [Google Scholar]
- Woods YL, Cohen P, Becker W, Jakes R, Goedert M, Wang X, Proud CG. The kinase DYRK phosphorylates protein-synthesis initiation factor eIF2Bepsilon at Ser539 and the microtubule-associated protein tau at Thr212: potential role for DYRK as a glycogen synthase kinase 3-priming kinase. Biochem J. 2001;355:609–15. doi: 10.1042/bj3550609. [DOI] [PMC free article] [PubMed] [Google Scholar]
- Yamabhai M, Hoffman NG, Hardison NL, McPherson PS, Castagnoli L, Cesareni G, Kay BK. Intersectin, a novel adaptor protein with two Eps15 homology and five Src homology 3 domains. J Biol Chem. 1998;273:31401–7. doi: 10.1074/jbc.273.47.31401. [DOI] [PubMed] [Google Scholar]
- Zhang H, Macara IG. The polarity protein PAR-3 and TIAM1 cooperate in dendritic spine morphogenesis. Nat Cell Biol. 2006;8:227–37. doi: 10.1038/ncb1368. [DOI] [PubMed] [Google Scholar]
Associated Data
This section collects any data citations, data availability statements, or supplementary materials included in this article.