Abstract
A peptide constrained to a conformation of second-extracellular loop of human prostaglandin-E2 (PGE2) receptor subtype3 (hEP3) was synthesized. The contacts between the peptide residues at S211 and R214, and PGE2 were first identified by NMR spectroscopy. The results were used as a guide for site-directed mutagenesis of the hEP3 protein. The S211L and R214L mutants expressed in HEK293 cells lost binding to [3H]-PGE2. This study found that the non-conserved S211 and R214 of the hEP3 are involved in PGE2 recognition, and implied that the corresponding residues in other subtype receptors could be important to distinguish the different configurations of PGE2 ligand recognition sites.
Keywords: Extracellular loop 2, Prostaglandin E2, EP3 receptor
INTRODUCTION
Prostaglandin (PG) E2 exerts its actions by acting on a group of G-protein-coupled receptors (GPCRs) which are designated as subtypes EP1, EP2, EP3 and EP4. These EPs exhibit differences in signal transduction and tissue localization [1–3] and yet share common ligands. For example, the EP3 mediates the pyrogenic response [4], EP1 and EP3 mediate release of corticotropin-releasing hormone [5], EP2 facilitates ovulation and fertilization [6] and EP2 and EP4 mediate collagen-induced arthritis. Also, prostanoids exert both pro-inflammatory and anti-inflammatory responses, through regulation of gene expression in relevant tissues [7].
The agonists to EP induce a signaling cascade inside the cell which seems to have differences and similarities and yet show different signaling outcomes. EP1 mediate signaling by activation of phospholipase C, protein kinase Cα and c-Src with upregulation of endothelial growth factor-C [8]. The EP2 and EP4 are linked to cAMP/protein kinase A and phosphoinositide-3-kinase signaling [9]. The EP3 however couple to multiple G proteins such as the Gi, resulting in the inhibition of adenylyl cyclase and Gs resulting in cAMP production [10–11]. EP3 can also activate the Ras signaling pathway leading to cancers [12].
The seven conserved residues in the second extracellular loop (eLP2) of rabbit EP3 involved in ligand recognition has been demonstrated previously [13]. However, in this paper we hypothesize that the differences in ligand recognition and ultimately the functional effect must logically lie in the non-conserved region as these EPs have multiple common ligands showing different effects. For example, PGE2 acts as an inflammatory molecule, whereas PGE1 acts as an anti-inflammatory molecule and both act on the same set of EPs with different affinities [14]. Thus, in order to understand the EPs it is important to uncover how the eight prostanoid receptors can distinguish between the similar prostanoids, which are synthesized from the same precursor, PGH2. Using the TM (transmembrane) domains of the working model for the EP3 receptor the constrained peptide mimicking the EP3 eLP2 was synthesized and purified. The residues in the EP3 eLP2 interacting with PGE2 in solution were determined by NMR spectroscopy. The importance of this study lies in the fact that it helps us recognize the fundamental differences that give quality to a receptor and can be used for future benefit of therapeutics.
MATERIALS AND METHODS
D2O (Cambridge Isotope Laboratories (Andover, MA)), PGE2 (Amersham Biosciences, (Piscataway, NJ)), HEK293 cells (ATCC (Manassas, VA,)), DMEM culture media (Invitrogen (Carlsbad, CA), and [3H]PGE2 and PGE2 (Perkin Elmer, USA)).
Peptide Synthesis and Purification
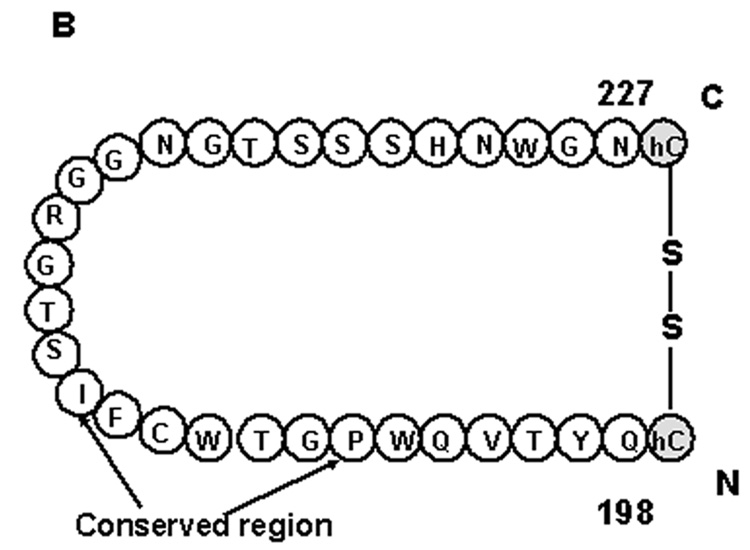
A peptide mimicking the human EP3 eLP2 (residues 189–227, Fig.1B) with homocysteine added at both ends was synthesized using the solid phase method [15,16]. After cleavage with TFA, the peptide was purified by HPLC on a C4 reversed phase column with a gradient from 0 to 80% acetonitrile in 0.1% TFA. For cyclization, the purified peptide (0.02 mg/mL) was dissolved in H2O and adjusted to pH 8.5 using triethylamine, and then stirred overnight at room temperature. It was then lyophilized and purified by HPLC on the C4 column [17].
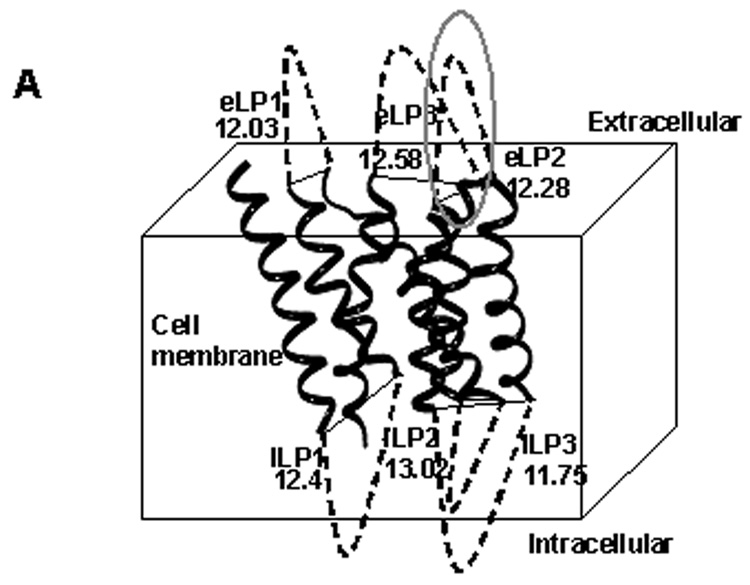
Fig.1.
(A) The homology model of the human EP3 receptor using crystal structure of β2 receptor [23]. The distance in angstroms (Å) between the transmembrane domains are shown. The synthesized peptide, EP3 eLP2, is marked with a circle. (B) The synthesized eLP2 in its constrained form (C) Structure of PGE2.
Fluorescence spectroscopic studies
0.75 ml (0.1 mg/ml) of the peptide was dissolved in 0.01M phosphate buffer, pH 7.2, with 0.1M NaCl and then incubated with various concentrations of PGE2. Fluorescence spectra were acquired with an Hitachi F-4500 spectrofluorometer using 294nm for excitation and 300–360 nm for emission [18].
NMR Sample Preparation
4 mg of the purified and constrained peptide was dissolved in 0.5ml, pH 5.5, 10mM sodium phosphate buffer with 10% D2O, pH 6.0, at a final concentration of 2.43 mM. 0.5 mg of PGE2 was dissolved in 50µl ethanol-d6 and then added to 0.45 ml of sodium phosphate buffer (20 mM) containing 10% D2O [17].
NMR experiments
NMR was performed on a Bruker AVANCE 800 MHZ NMR spectrometer at 293K. 2D NOESY (300ms mixing time), TOCSY and DQF-COSY for above samples were recorded. Thereafter, 2.5ul, 5ul, 10ul, 20ul and 40 ul of PGE2 in Ethanol-d6 solution (1mg/100ul) was added into the sample and the 1D proton spectra were recorded. 2D NOESY (200ms mixing time) and TOCSY spectra were then recorded for the final mixture of EP3 eLP2 and PGE2. Details are mentioned in previous publications [18, 21].
Site-directed Mutagenesis
pAcSG-EP3 wild-type cDNA was first subcloned into EcoRI/XbaI sites of pcDNA3.1(+) expression vector. The EP3 receptor mutants were then constructed using standard PCR. Details in [22]. The plasmids were prepared using Midiprep kit (Qiagen) for transfection into HEK293 cells.
Expression of EP3 Receptor Wild-type and Mutants in HEK293 Cells
HEK293 cells were transfected with purified cDNA of pcDNA3.1(+)/EP3 wild type and mutants with Lipofectamine according to the manufacturer’s instructions [22]. Western blot was performed to evaluate the protein expression (Fig. 8A).
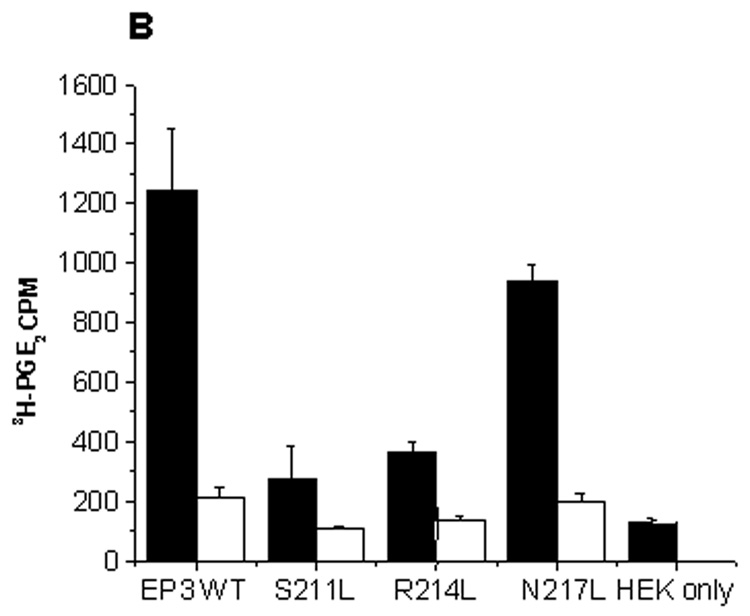
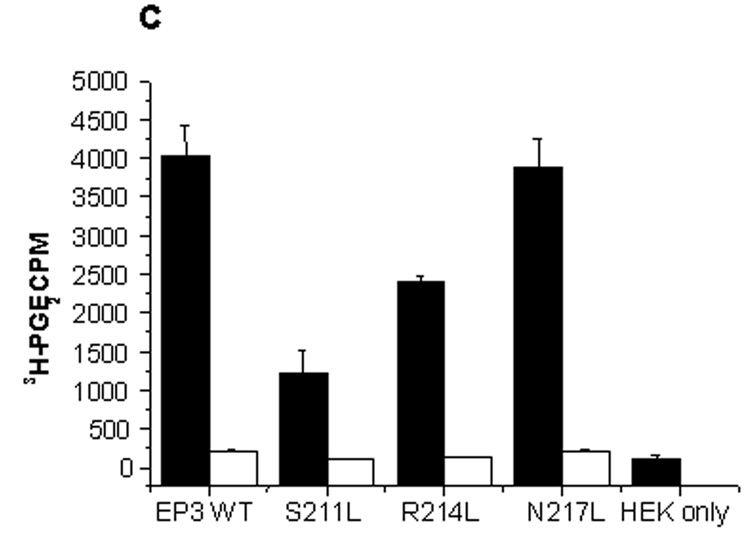
Fig.8.
(A) Western blot of wild-type and mutant EP3 receptors on HEK293 cells. (1) HEK293 cells, (2) wild type EP3 (3) Mutant S211L, (4) R214L, and (5) N217L. (B) Histograms showing total (black bars) and nonspecific binding (white bars). (C) shows increased binding for mutants at higher counts (0.1185nM, 30,000 cpm) though still significantly less than the wild type and the internal control N217L. Binding to HEK293 cells was comparable to nonspecific binding in the presence of Cold PGE2 (5µM, in both B and C). The reaction volume was 100µl, with approximately 0.05 million cells/well. The results are presented as mean ± SD with (n = 3).
Ligand Binding Assay
Ligand binding assay for the WT and mutant EP3 receptor was performed on whole cells in 48-well culture plates with 0.035 nM and 1 nM [3H]PGE2 respectively, in the presence and absence of 5 µM unlabeled (cold) PGE2 in the 0.1-ml reaction volume of DMEM at room temperature for 60 min. The reaction was terminated by adding 1 ml of ice-cold washing buffer (25 mM Tris-HCl, pH 7.4). The ligand bound cells were dissolved in 0.5 N NaOH, which was later, neutralized with acetic acid. The procedure was modified from reference [20] and radioactivity detected by MicroBetaTrilux counter.
RESULTS
Homology Model and Peptide design
The human EP3 receptor model with seven TM domains was created by homology modeling using the crystallized beta2 receptor as the template [23]. The distance between the transmembrane helices was 12–14 angstroms which is similar to the distance between the disulphide bonds formed by the homocysteine residues in the constrained peptide (approximately 12 Å) (Fig.1A,1B).
Sequence Alignment Of The eLP2 Regions From The Eight Human Prostanoid Receptors
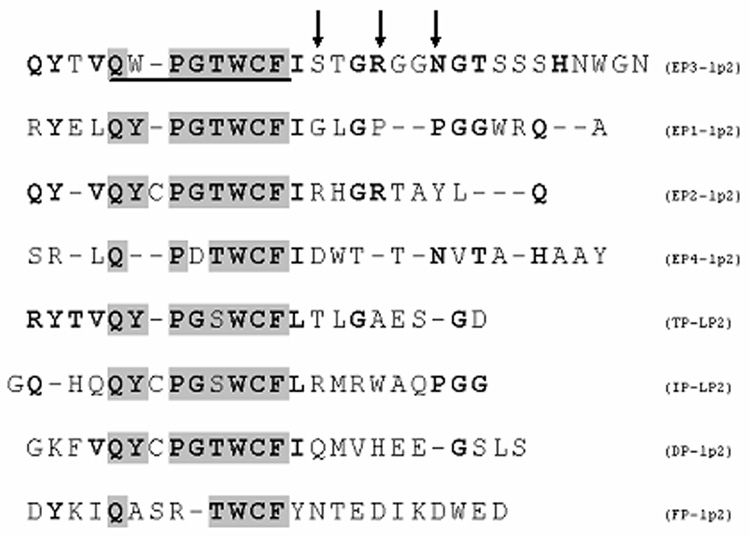
The identical residues, QW-PGTWCF, in the eLP2 regions are centrally located within the eLP2. The identified residues, S211 and R214 are not conserved in other prostanoid receptor eLP2s indicating that these residues of EP3 eLP2 could be involved in specific ligand recognition (Fig. 2).
Fig.2.
Sequence alignment of eLP2’s of prostanoid receptors. The conserved residues are highlighted. Arrows indicate residues for mutation (non-conserved region).
Fluorescence Spectroscopy of PGE2 with the Peptide Segment
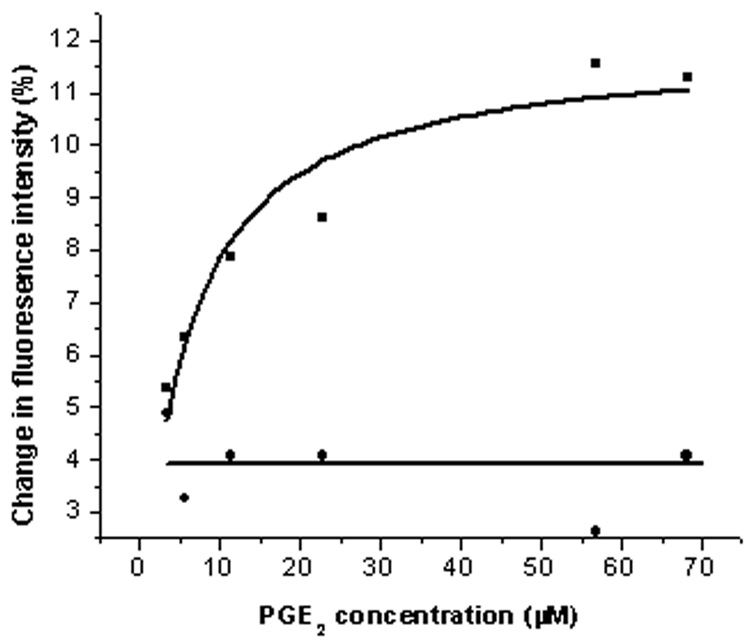
The recorded intrinsic fluorescence signal was generated from the Trp residue, which is sensitive to the conformational change in the peptide induced by the interaction with its ligand. The fluorescence intensity of the constrained peptide increased by 11–14% (Kd-5.12) with PGE2, which started at 3.4µM and became saturated at 68.1µM of the ligand (Fig:3). However no significant fluorescence changes were induced upon the addition of PGE2 to the crude EP3 eLP2. These results indicate that the constrained EP3 eLP2 peptide is able to adopt an active conformation, which mimics the eLP2 of the EP3 receptor.
Fig.3.
Fluorescence spectroscopic of PGE2 with the synthetic peptide (constrained and crude). The fluorescence enhancement of the synthetic constrained peptide (0.1 mg/ml, squares, Kd 5.12) by the addition of its ligand (3.4– 68.1µM) was plotted. The non-significant fluorescence changes of the non cyclised EP3 eLP2 peptide (0.1 mg/ml, circles) is also plotted.
2D 1 H NMR Spectroscopy of PGE2 with the Peptide Segment
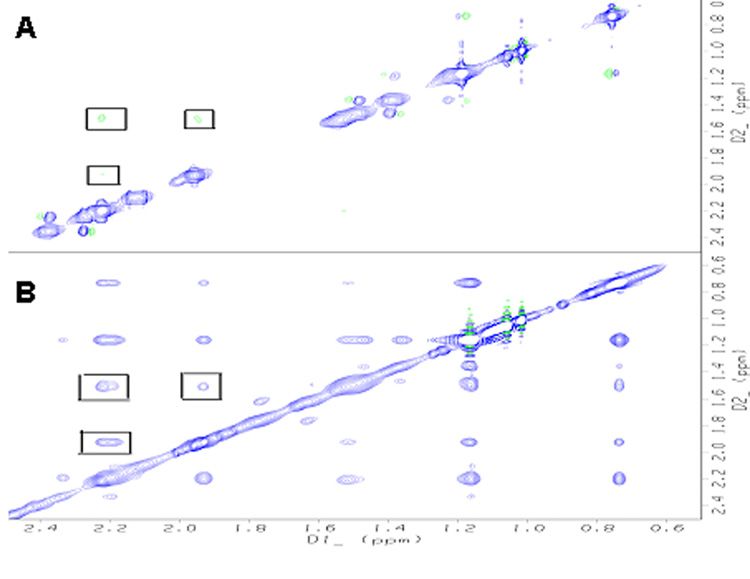
To further identify which proton in PGE2 contacts the EP3 eLP2 fragment, 2D proton NMR spectroscopy was used. NOESY, TOCSY of PGE2 (in the absence and presence of the constrained EP3 eLP2 peptide) were recorded in H2O with 10% D2O. The resonance assignment of PGE2 is summarized in Table1. The binding of PGE2 to the peptide was supported by the changes in the proton cross-peaks, from the negative phase (green peaks, fast tumbling) in free PGE2 (Fig. 4A) to the positive phase (blue peaks, slow tumbling) in PGE2 with the EP3 eLP2 peptide (Fig. 4B). This is a strong indication of the transition of PGE2 from free to bound status. By analysis, more cross-peaks appeared in the NOESY spectrum of PGE2 with the eLP2 peptide, which clearly indicates that a stable conformation of PGE2 was induced by the peptide.
Table. 1.
Proton chemical shift of PGE2 in the absence and presence of EP3 eLP2
| In the absence of EP3 eLP2 | In the presence of EP3 eLP2 | |
|---|---|---|
| H2 | 2.081 | 2.223 |
| H3 | 1.397 | 1.507 |
| H4 | 1.818 | 1.941 |
| H5 | 5.248 | 5.356 |
| H6 | 5.085 | 5.210 |
| H7 | 2.086 | 2.188 |
| H8 | 2.145 | 2.235 |
| H10b | 2.566 | 2.698 |
| H10a | 1.975 | 2.094 |
| H11 | 3.945 | 4.048 |
| H12 | 2.238 | 2.329 |
| H13 | 5.377 | 5.485 |
| H14 | 5.377 | 5.485 |
| H15 | 3.910 | 4.024 |
| H16 | 1.291 | 1.478 |
| H17 | 1.245 | 1.478 |
| H18 | 1.058 | 1.372 |
| H19 | 1.034 | 1.167 |
| H20 | 0.608 | 0.733 |
Fig.4.
NOESY spectra (A) The cross-peaks (In rectangles) of PGE2 shown as negative (green) phases (fast tumbling rate), compared to the diagonal. (B) The cross-peaks of PGE2 interacted with EP3 eLP2 peptide are shown as the positive phase (blue phases), (slow tumbling rate). Peaks indicate extra intra-molecule NOEs of the PGE2 interaction with EP3 eLP2.
Identification of Residues for Point Mutation
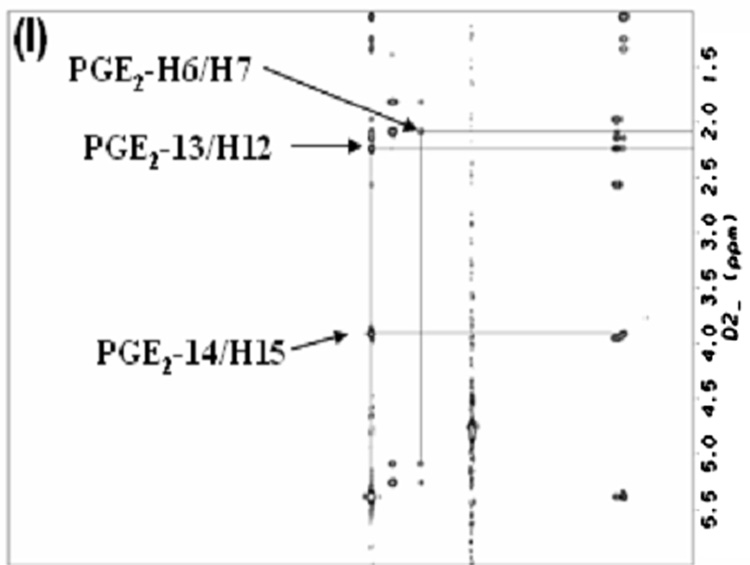
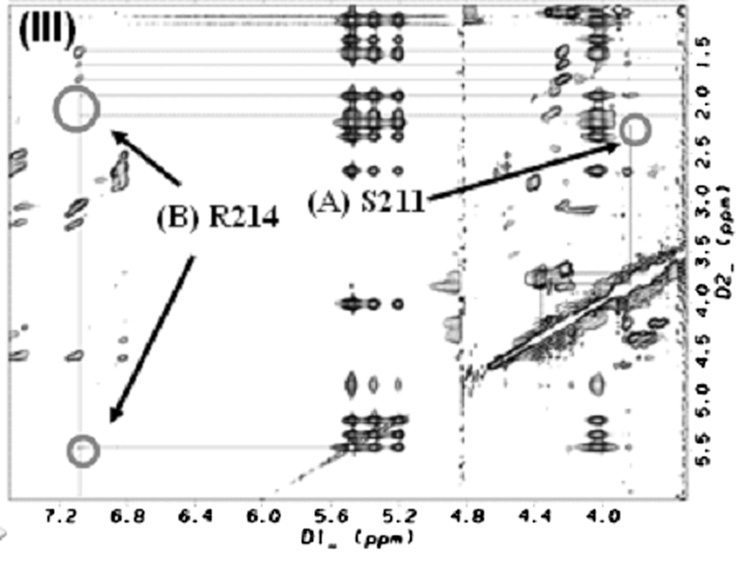
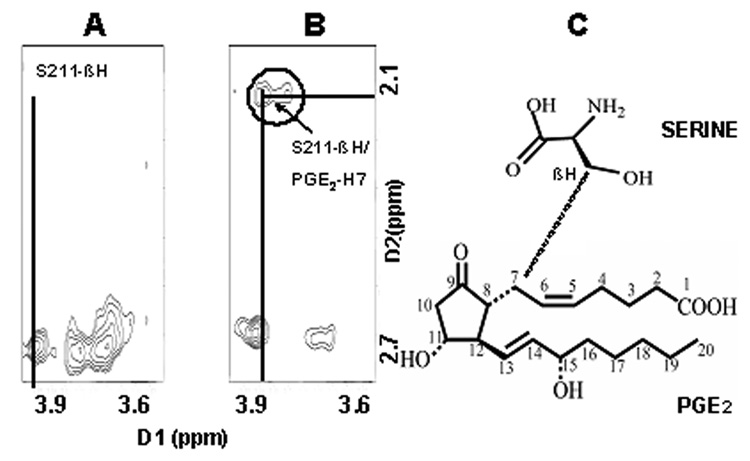
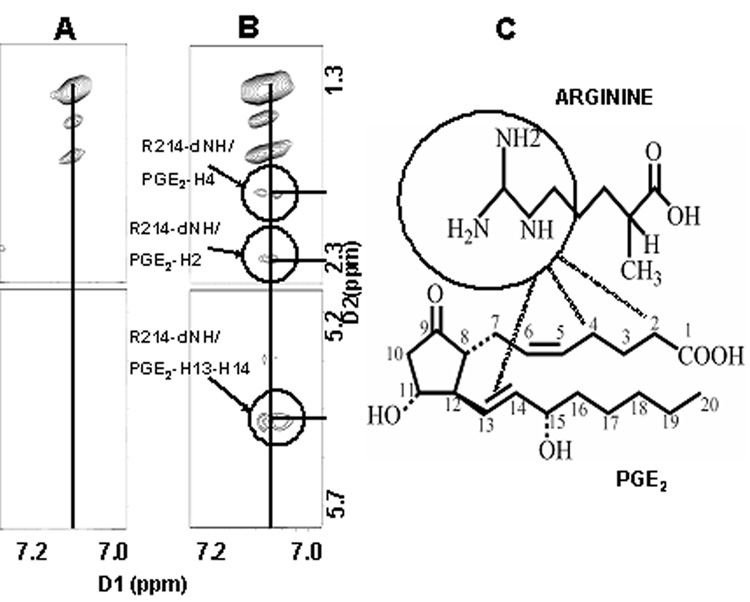
From the NOESY spectra, intermolecular cross peaks were identified for two residues [serine (S211) and arginine (R214)] which indicated a close contact between these two residues and PGE2. Fig. 5, Fig. 6&Fig. 7 shows the intermolecular NOE cross peaks. The beta proton of S211 was shown to contact with H7 of PGE2, and the guanidine hydrogens of residue R214, was shown to come in contact with protons, H2, H4, and H13/14 of PGE2 in solution. Residue asparagine (N217) was chosen as an internal control due to its similarity in size and hydrophilicity. The identified residues were mutated to leucine (L) which is more hydrophobic in nature.
Fig.5.
(I) TOCSY spectrum of PGE2.(II) NOESY spectra of EP3 eLP2 peptide, ((II)A)Serine 211 and, ((II)B) Arginine 214 Cross-peaks (III) the mixture of EP3 eLP2 peptide and PGE2, ((III)A)Serine 211 with PGE2, and ((III)B)Arginine 214 with PGE2 cross-peaks.
Fig.6.
(A) Magnified Cross-peaks for serine 211 from Fig.5(IIA). (B) Magnified Cross peaks (Fig.5(IIIA) of peptide with PGE2 for residue serine 211 β proton (dimension 1) in contact with proton 7 of PGE2 (dimension 2) (C), Chemical structure representation.
Fig.7.
(A) Magnified Cross-peaks (Fig.5(IIB)) for arginine 214 of the eLP2 peptide. (B)Magnified Cross-peaks (Fig.5(IIIB)) for arginine 214 guanidine protons (dimension 1) in contact with proton 2, 4 and 13 /14 of PGE2 (dimension 2). (C) Chemical structure representation.
Radioligand Binding of EP3 Wild Type versus Mutants
The mutants S211L and R214L showed significantly reduced binding when compared to the EP3 wild type and the mutant, N217L (internal control). Cold PGE2 inhibited the [3H]PGE2 binding which was similar to that of HEK293 cells only. On comparing the [3H]PGE2 binding at low concentration (0.035 nM, 9000 cpm) and high concentrations (0.1185 nM, 30000 cpm) we realized that there was an increase in [3H]PGE2 binding to the mutants, although still significantly less compared to wild type and internal control (Fig. 8B&C). This signifies that a single point mutation can significantly alter the receptor binding and that the binding is not restored even with high concentration.
DISCUSSION
Based on our molecular modeling studies, the TP receptor ligand, SQ29,548, must contact the extracellular domains of the receptor before binding to the residues on the third and seventh transmembrane domains. This means that the initial contact residues on the molecular surface are also specific [22]. Also the constrained eLP2 peptide of the TP receptor changes its conformation upon the addition of the receptor antagonist (SQ29,548) [18]. Studies have provided evidence to support the hypothesis of the second extracellular loop’s involvement in ligand recognition (20,21) and that point mutations of several cysteine residues at these loops reduce binding activity. Site-directed mutagenesis of seven conserved residues (198–205) clustered in the amino portion of the rabbit EP3 eLP2 has been performed and their ligand binding profiles assessed, in transfected HEK293 cells (13, 20, 22).
We chose the EP3 receptor for its unique ability to couple to multiple G proteins such as the Gi subunits (adenylyl cyclase inhibition) and Gs subunit (cAMP stimulation) (10, 11). We hypothesize that this selection of G proteins is likely to be ligand-dependent.
The residues identified by us for ligand recognition (S211 & R214) are chiefly located in the non-conserved region of the eLP2. This means that the conserved regions, though important for ligand recognition, may not be as important as the non-conserved region in defining the receptor’s choice of signal transduction. The differences observed in the function of the receptors sharing a common ligand could in fact be due to the conformational changes brought about by these non-conserved residues which lead to the diversification of the signal transduction. The x-ray crystal structure for a majority of mammalian GPCR’s is not yet available therefore the first step to identify the structural basis of the ligand-specific recognition of the extracellular parts is the understanding of the residues involved.
In this paper, we localized the residues within the eLP2 region responsible for the ligand recognition, using two-dimensional NMR spectroscopy. The residues identified (S211&R214) were further confirmed by the site-directed mutagenesis approach for the native EP3 receptor. The radioligand ([3H]PGE2) binding further supports our hypothesis that the point mutation in the second extracellular loop of the receptors greatly decreases the binding (Fig. 8). Our next step will be to use this data from the combination of the NMR experiments and mutagenesis to give detailed structural information about the interaction of the receptor and ligand, which can not be achieved by other approaches such as general mutation approach, photoaffinity labeling, and site-specific antibody screening. This approach can be used to characterize the ligand binding to other domains of the receptor as well.
The key factor in this study was to design a synthetic peptide with biological function. By using a constrained peptide, we successfully identified the ligand recognition site for the receptor. The identification of the residues in the EP3 eLP2 is the first step in solving the ligand-recognition pocket. We suspect that the ligand-recognition site might differ from the final ligand-binding site, as we have shown with the TP receptor. Though the ligand binding site located within the transmembrane domain is conserved, the initial docking residues of the prostanoid receptors are ligand specific [22]. In conclusion, our proton-level information for identification of the EP3 receptor ligand-recognition site on the extracellular domain will serve as a valuable tool to characterize the structure of the ligand-docking site and understand the variations in signaling outcomes. In addition, it will also provide reference information on specific recognition differences and predictions of ligand-docking sites for other prostanoid receptors.
Acknowledgement
We thank Dr. Xiaolian Gao (Chemistry Dept, University of Houston) for access to the NMR facility and advice on NMR spectra.
Abbreviations
- NOESY
nuclear Overhauser effect spectroscopy
- TOCSY
total correlation spectroscopy
- TOCSY
Total Correlation Spectroscopy
- DQF-COSY
Double Quantum Filtered – Correlation Spectroscopy
- NOE
Nuclear Overhauser Effect.
Footnotes
Publisher's Disclaimer: This is a PDF file of an unedited manuscript that has been accepted for publication. As a service to our customers we are providing this early version of the manuscript. The manuscript will undergo copyediting, typesetting, and review of the resulting proof before it is published in its final citable form. Please note that during the production process errors may be discovered which could affect the content, and all legal disclaimers that apply to the journal pertain.
References
- 1.Narumiya S, Sugimoto Y, Ushikubi F. Prostanoid Receptors: Structures, Properties, and Functions. Physiol. Rev. 1999;79:1193–1226. doi: 10.1152/physrev.1999.79.4.1193. [DOI] [PubMed] [Google Scholar]
- 2.Sugimoto Y, et al. Two isoforms of the EP3 receptor with different carboxyl-terminal domains. J. Biol. Chem. 1993;268:2712–2718. [PubMed] [Google Scholar]
- 3.Irie A, et al. Third isoform of the prostaglandin-E-receptor EP3 subtype with different C-terminal tail coupling to both stimulation and inhibition of adenylate cyclase. Eur. J. Biochem. 1993;217:313–318. doi: 10.1111/j.1432-1033.1993.tb18248.x. [DOI] [PubMed] [Google Scholar]
- 4.Ushikubi F, et al. Impaired febrile response in mice lacking the prostaglandin E receptor subtype EP3. Nature. 1998;395:281–284. doi: 10.1038/26233. [DOI] [PubMed] [Google Scholar]
- 5.Matsuoka Y, et al. Impaired adrenocorticotropic hormone response to bacterial endotoxin in mice deficient in prostaglandin E receptor EP1 and EP3 subtypes. Proc. Natl. Acad. Sci. U. S. A. 2003;100:4132–4137. doi: 10.1073/pnas.0633341100. [DOI] [PMC free article] [PubMed] [Google Scholar]
- 6.Hizaki H, et al. Abortive expansion of the cumulus and impaired fertility in mice lacking the prostaglandin E receptor subtype EP2. Proc. Natl. Acad. Sci. U. S. A. 1999;96:10501–10506. doi: 10.1073/pnas.96.18.10501. [DOI] [PMC free article] [PubMed] [Google Scholar]
- 7.Honda T, et al. Prostacyclin-IP signaling and prostaglandin E2-EP2/EP4 signaling both mediate joint inflammation in mouse collagen-induced arthritis. J. Exp. Med. 2006;203:325–335. doi: 10.1084/jem.20051310. [DOI] [PMC free article] [PubMed] [Google Scholar]
- 8.Su JL, et al. Cyclooxygenase-2 induces EP1- and HER-2/Neu-dependent vascular endothelial growth factor-C up-regulation: a novel mechanism of lymph angiogenesis in lung adenocarcinoma. Cancer Res. 2004;64:554–564. doi: 10.1158/0008-5472.can-03-1301. [DOI] [PubMed] [Google Scholar]
- 9.Okuyama T, et al. Activation of prostaglandin E2-receptor EP2 and EP4 pathways induces growth inhibition in human gastric carcinoma cell lines. J Lab Clin Med. 2002;140:92–102. doi: 10.1067/mlc.2002.125784. [DOI] [PubMed] [Google Scholar]
- 10.Katoh H, et al. P160 RhoA-binding kinase ROKalpha induces neurite retraction. J Biol Chem. 1998;273:2489–2492. doi: 10.1074/jbc.273.5.2489. [DOI] [PubMed] [Google Scholar]
- 11.Tamma G, Wiesner B, Furkert J, Hahm D, Oksche A, Schaefer M, et al. The prostaglandin E2 analogue sulprostone antagonizes vasopressin-induced antidiuresis through activation of Rho. J Cell Sci. 2003;116:285–294. doi: 10.1242/jcs.00640. [DOI] [PubMed] [Google Scholar]
- 12.Yano T, et al. Prostaglandin E2 reinforces the activation of Ras signal pathway in lung adenocarcinoma cells via EP3. FEBS Lett. 2002;518:154–158. doi: 10.1016/s0014-5793(02)02689-3. [DOI] [PubMed] [Google Scholar]
- 13.Audoly L, Breyer RM. The second extracellular loop of the prostaglandin EP3 receptor is an essential determinant of ligand selectivity. The Journal Of Biological Chemistry. 1997;272(21):13475–13478. doi: 10.1074/jbc.272.21.13475. [DOI] [PubMed] [Google Scholar]
- 14.Merrifield RB, Vizioli LD, Boman HG. Synthesis of the antibacterial peptide cecropin A (1–33) Biochemistry. 1982;21:5020–5031. doi: 10.1021/bi00263a028. [DOI] [PubMed] [Google Scholar]
- 15.Ruan KH, Stiles BG, Atassi MZ. The short-neurotoxin-binding regions on the alpha-chain of human and Torpedo californica acetylcholine receptors. Biochem. J. 1991;274:849–854. doi: 10.1042/bj2740849. [DOI] [PMC free article] [PubMed] [Google Scholar]
- 16.Moore WT, Caprioli RM, Villafranca JJ. Techniques in protein chemistry ii. New York: Academic Press; 1991. pp. 511–528. [Google Scholar]
- 17.Ruan K-H, et al. Solution structure of the second extracellular loop of human thromboxane a2 receptor. Biochemistry. 2001;40(2001):275–280. doi: 10.1021/bi001867c. [DOI] [PubMed] [Google Scholar]
- 18.Funk CD, et al. Point mutation in the seventh hydrophobic domain of the human thromboxane A2 receptor allows discrimination between agonist and antagonist binding sites. Mol. Pharmacol. 1993;44:934–939. [PubMed] [Google Scholar]
- 19.Chiang N, Kan WM, Tai H-H. Site-directed mutagenesis of cysteinyl and serine residues of human thromboxane a2receptor in insect cells. Arch. Biochem. Biophys. 1996;334:9–17. doi: 10.1006/abbi.1996.0423. [DOI] [PubMed] [Google Scholar]
- 20.D’Angelo DD, et al. Mutagenic analysis of platelet thromboxane receptor cysteines. J. Biol. Chem. 1996;271:6233–6240. doi: 10.1074/jbc.271.11.6233. [DOI] [PubMed] [Google Scholar]
- 21.Audoly L, Breyer RM. The second extracellular loop of the prostaglandin EP3 receptor is an essential determinant of ligand selectivity. J. Biol. Chem. 1997;272:13475–13478. doi: 10.1074/jbc.272.21.13475. [DOI] [PubMed] [Google Scholar]
- 22.So SP, et al. Identification of residues important for ligand binding of thromboxane a2 receptor in the second extracellular loop using the nmr experiment-guided mutagenesis approach. The Journal Of Biological Chemistry. 2003;278(13):10922–10927. doi: 10.1074/jbc.M209337200. [DOI] [PubMed] [Google Scholar]
- 23.Rasmussen SG, et al. Crystal structure of human adrenergic beta 2 G-protein coupled receptor. Nature. 2007;450:383–387. doi: 10.1038/nature06325. [DOI] [PubMed] [Google Scholar]


