Abstract
Porous polymer monolith have been prepared in capillaries with circular or square cross section and lateral dimensions of 50, 75, 100 μm as well as in a rectangular 38 × 95 μm capillary. These capillaries have been used to determine the effect of the size and shape of their cross section on the porous and hydrodynamic properties of poly(butyl methacrylate-co-ethylene dimethacrylate) monoliths. The capillaries were studied by scanning electron micrography and evaluated for their permeability to flow and their performance in the liquid chromatographic separation of a protein mixture comprising ribonuclease A, cytochrome c, myoglobin, and ovalbumin using a linear gradient of acetonitrile in the mobile phase. No differences resulting from channel geometry were found for the various capillary columns. These results demonstrate that standard capillaries with circular geometry are a good and affordable alternative conduit for modeling the processes carried out in microfluidic chips with a variety of geometries.
Keywords: Porous polymer monolith, Scalability, Nano-LC, Conduit shape, Proteins, Reversed phase HPLC
1. Introduction
Since the inception of liquid chromatography (LC) more than 100 years ago, chromatographic separations have mostly been carried out in packed columns with circular cross section made of a variety of materials such as glass, plastics, and metals [1]. This tubular geometry was favored due to the ease of accessibility of tubes, their simple machining and threading, and the straightforward connection to end fittings. Fused silica capillary columns revolutionized gas chromatography (GC) after their introduction in the late 1950s [2]. These columns were not packed and the separation process was achieved via interaction of the separated compounds with a thin layer of stationary phase coating at the wall. The open tubular GC format allowed for very fast separations at a speed not attainable for efficient separations with packed columns in the LC mode. A direct translation of LC in capillaries attempted in early work by Tsuda and Novotny [3] was not very successful. In order to achieve the desired fast mass transfer between the bulk of the mobile phase and the wall with interacting functionalities, the capillary had to be very narrow. As a result, the internal volume, and thus the sample capacity of these columns, was very small, which made both injection and detection difficult. One of the solutions to the conflicting requirements of small diameter facilitating mass transfer and large diameter needed for sufficient sample volume and sensitive detection was the use of “ribbon-like” flat columns theoretically derived by Golay [4] and experimentally implemented by Giddings [5]. He demonstrated that fluid drag at the edges of the flat columns negatively affected the column efficiency through zone distortion and tailing.
Renewed interest in the flat column formats followed the development of capillary zone electrophoresis since a thin rectangular device might enable much faster dissipation of Joule heat [6,7]. Tsuda et al. demonstrated that rectangular capillaries provided advantages such as reduced peak distortion due to the elimination of heat effects and enhanced sensitivity of UV detection resulting from the longer optical path length [8]. Despite this encouraging work, rectangular capillaries have not been widely accepted [9]. The flat profile of conduits for chromatography emerged again with the advent of microfluidic separation devices. This was due to the fact that the typical methods used for their fabrication - micromachining, etching, laser ablation, embossing, and injection molding - are not well suited to the fabrication of channels with a circular profile. As a result, microfluidic channels with a non-circular profiles such as semicircular, rectangular, and trapezoidal depending on the fabrication technique are most common. Theoretical calculations comparing open rectangular to circular formats predict a better separation performance in GC [10] for the latter, while the edges of the rectangular format negatively affect the flow and thus the column efficiency in both pressure driven and electrodriven LC separations [11,12]. Subsequent experimental work by Rozing et al. confirmed that dispersion in square shaped open capillaries exceeded that observed for circular conduits for both pressure driven and electrodriven LC [13]. They noted that efficient LC separations can only be achieved in devices in which one dimension of the cross section is very narrow however this format is technically impractical.
A stationary phase may alleviate the need for the very short path length between the walls in open channel conduits and afford conditions typical of normal chromatographic columns. Indeed, only small differences in electrochromatographic performance were observed between beds packed with 3.5 and 5 μm octadecyl silica particles both in circular and rectangular capillaries [13]. Similar experiments also compared the separations achieved in circular capillaries with those obtained in microfluidic chips and suggested that better performance was obtained with the latter [13].
While packing the straight channel of a chip may be relatively simple, it is much more difficult to achieve to pack efficiently serpentine channels with several turns. Microchip column packing remains a critical roadblock on the path to true high-performance LC chips. Extensive simulations carried out by Tallarek’s group demonstrated a dramatic loss in efficiency for packed non-circular columns in which bed porosity was increased from 40 to 48% [14]. This was attributed to the presence of corners that are difficult to pack efficiently and to the reduced symmetry of the non-cylindrical packed beds requiring a longer characteristic length for analytes to achieve lateral equilibration between different flow velocities within the column.
Various monolithic stationary phases in analytical column format were introduced in the late 1980s and the early 1990s [15–18]. Capillary formats of monolithic columns soon followed with the surge of capillary electrochromatography [19–23] and quickly found additional applications in nanoflow HPLC and other areas [24–26]. In contrast to columns packed with pre-formed particles, porous polymer monoliths are prepared in situ from liquid precursors. This feature makes them well suited for the preparation of chromatographic stationary phases within the channels of microfluidic chips [27–34].
Because the current generation of commercial microfluidic chips is still very costly as they are not mass produced, capillaries still constitute the best model system currently available for the development of monolithic media destined for application in chips. This report describes for the first time the effects of both geometry and size of the capillary channel on the porous properties and the chromatographic performance of poly(butyl methacrylate-co-ethylene dimethacrylate) monoliths prepared in capillaries used as models for chips of various channel geometries. The chromatographic conditions are selected to match those typically used for the gradient separation of proteins using porous polymer monolithic columns.
2. Experimental
2.1 Chemicals and materials
Ethylene dimethacrylate (EDMA), butyl methacrylate (BuMA), 1-propanol, 1,4-butanediol, azobisisobutyronitrile (AIBN) and 3-(trimethoxysilyl)propyl methacrylate, acetonitrile (HPLC grade), ribonuclease A, cytochrome c, myoglobin, and ovalbumin were obtained from Sigma Aldrich (St. Louis, MO, USA). The monomers EDMA and BuMA were purified by passage through a bed of basic alumina followed by distillation to remove the inhibitors. Proteins were dissolved in water containing 0.1% (v/v) formic acid purified using Milli-Q-Gradient system (Millipore, Bedford, MA, USA).
Polyimide coated fused silica capillaries with both circular and square cross section and lateral dimensions of 50, 75, and 100 μm were purchased from Polymicro Technologies (Phoenix, AZ, USA). A capillary with a 39×94 μm rectangular cross section was a generous gift from Polymicro Technologies.
The capillaries were rinsed with acetone, water, 200 mmol/L sodium hydroxide, water, 200 mmol/L HCl, and ethanol. Then, a 20% (w/w) solution of 3-(trimethoxysilyl)propyl methacrylate in ethanol with an apparent pH value of 5 adjusted using acetic acid, was pumped through the capillary for 2 h using a syringe pump (KdScientific, New Hope, PA, USA). After this vinylization procedure, the capillaries were rinsed with acetone, and dried under a stream of nitrogen.
Finally, the modified capillaries were filled with a polymerization mixture containing 24% BuMA, 16% EDMA, 34% 1-propanol, 26% 1,4-butanediol, and 1% AIBN (all w/w) [35] using a syringe. The ends of the capillary were then sealed with a piece of rubber septum and thermally initiated polymerization was carried out in a water bath kept at 50 °C for 72 h to ensure a total conversion of the monomers to the polymer monolith. After the polymerization reaction was completed, the seals were removed, a short piece of the capillary about 2 cm long was cut at both ends, and the monoliths were washed with acetonitrile using a syringe pump. Finally, the columns were cut to the length of 15 cm and stored in a 1:1 water acetonitrile mixture.
2.2 Equipment
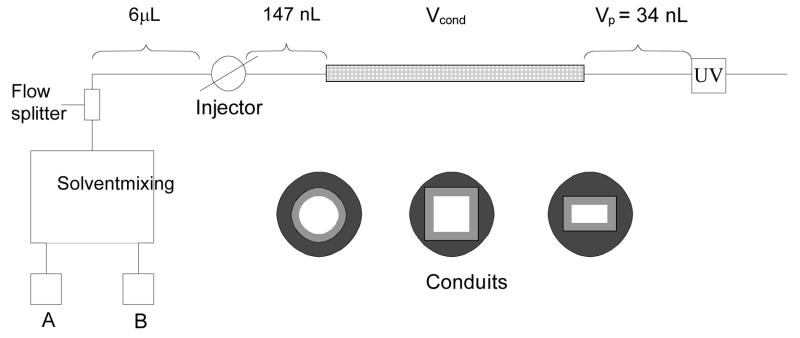
All chromatographic experiments were carried out using a Dionex Ultimate 3000 HPLC system (Sunnyvale, CA, USA) equipped with a 3 nL UV detection cell. The desired flow rate is achieved by flow splitter and adjusted by the controlled valve both built in the instrument. Accuracy of the flow rate has been confirmed using a nanoflow sensor (Upchurch Scientific, Oak Harbor, WA, USA) placed at the column outlet. The experimental setup is shown in Figure 1. Cylindrical columns were attached via zero dead-volume connectors purchased from Upchurch Scientific (Oak Harbor, WA, USA). Zero dead volume PTFE tubing sleeves distributed by Dionex were used for the non-cylindrical conduits to fit the slightly non-cylindrical outer shape of these capillaries. A typical injected sample volume of 100 nL was used for columns with the larger cross-sections while the injected volume was reduced for smaller cross section columns to avoid overloading. Thiourea was used both to monitor the residence time from the injector to the detector at a given flow rate and as the mobile phase velocity marker. Before attaching the column, the injector was directly connected to the detector and the pressure drop in the system with no column included was measured. Subsequent installation of the conduit allowed determination of the pressure drop in the monolithic column itself.
Fig. 1.
Experimental setup used in this study. Zero dead volume connections were used for installation of the conduits.
Scanning electron micrographs were obtained using a S-4300 SE/N scanning electron microscope (Hitachi, Pleasanton, CA, USA).
3. Results and discussion
3.1 Hydrodynamic properties
Table 1 shows the conduit shapes and dimensions of the capillaries used in this study. It is worth noting that for all columns tested the ratio of post-conduit Vp to conduit volume Vcond remains in a range comparable to that typical of an analytical HPLC system. Darcy’s law defines the pressure drop ΔP per unit length generated by a conduit [13,36,37]:
| (1) |
where L is the length of the conduit, η is the mobile phase viscosity, usf is the superficial velocity, and kp,f is the conduits permeability. The value of usf is obtained by dividing the volumetric flow rate FV by the cross sectional area A of the conduit. The linear chromatographic velocity u0 is calculated from the residence time of thiourea, which is assumed to experience all available pore space in the monolith and remains unretained while using the specific mobile phase. Eq. 2 then enables calculation of the total porosity εt of the monoliths in different conduits [36,37]:
| (2) |
Table 1.
Volume of 15 cm long capillaries differing both in lateral dimension and geometry, and ratio of post-conduit volume in the chromatographic system Vp to conduit volume Vcond.
| Lateral dimension μm | Conduit volume, μL | Vp/Vcond | ||
|---|---|---|---|---|
| Cylindrical | Rectangular | Cylindrical | Rectangular | |
| 100 | 1.18 | 1.50 | 0.029 | 0.023 |
| 75 | 0.66 | 0.84 | 0.052 | 0.041 |
| 50 | 0.29 | 0.38 | 0.117 | 0.091 |
| 38 × 95 | - | 0.54 | - | 0.063 |
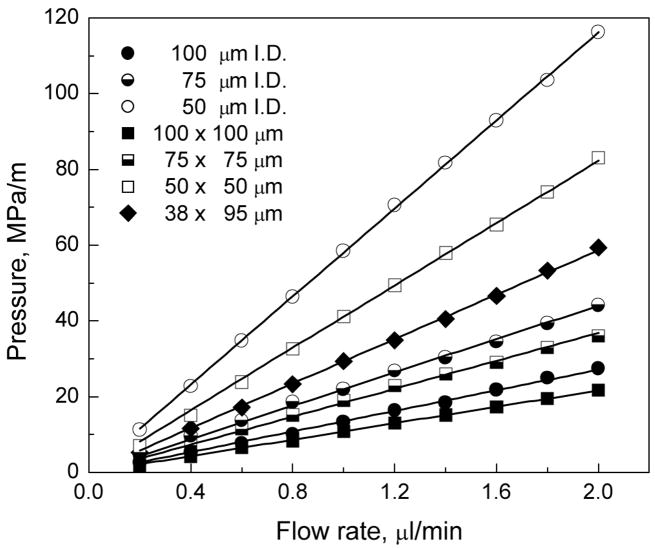
Monoliths prepared from the same polymerization mixture in capillaries with different cross section geometries and sizes used in this study should inevitably exhibit the same permeability and porosity, provided geometrical aspects of the confining channel, i.e. channel size and surface-to-volume ratio, do not play any role in the formation of monolith and its porous structure. These effects on monolithic structures have not yet been investigated. To test this hypothesis, we recorded the pressure drop as a function of flow rate through the porous polymer monoliths prepared within capillaries of different geometries and sizes. As shown in Figure 2, all plots are linear indicating that the monolithic stationary phase is not compressed at pressures exceeding 15 MPa. The linearity of the plot confirms the validity of Eq. 1. It is also clear that the pressure drop scales with the cross sectional area of the conduit. Thus, it is lowest for the capillary with the largest size. The pressure drop observed for the 100 μm i.d. cylindrical capillary column is in a good agreement with that we have previously reported [35].
Fig. 2.
Effect of flow rate on back pressure generated in conduits containing porous poly(butyl methacrylate-co-ethylene dimethacrylate) monoliths prepared from the same polymerization mixture and differing in shape and size. Conditions: Column length 15 cm, mobile phase 0.1 %v/v formic acid solution in 50/50 v/v acetonitrile-water.
To compare the pressure drop for all conduits while eliminating the effect of their different cross sectional areas, we calculated the permeability using Eq. 1 that takes into account the changes in superficial velocity. Table 2 demonstrates very small variations in both the total column porosities εt and permeabilities kp,f. These values are also similar to those found for both silica-based monoliths [36,38,39] and columns packed with 10 μm particles [40]. It is worth noting that the preparation of efficient capillary columns packed with particles of this size would be difficult considering the low aspect ratio which represents the column diameter divided by the size of the particle and is less than 10 [40–42]. The invariance of monolithic column properties for all conduit shapes and sizes confirms the excellent scaling capability of the material within the size range tested. This finding proves the absence of the “wall effect” on column porosity, which is observed for beds packed in capillaries [43].
Table 2.
Total porosity of the monolith εt and its permeability kp,f calculated from superficial velocity for all conduits used in this study.a
| Lateral dimension μm | Cylindrical | Non-cylindrical | ||
|---|---|---|---|---|
| εt | kp,f, 10−14 m2 | εt | k p,f, 10−14 m2 | |
| 100 | 0.63 | 9.79 | 0.62 | 9.60 |
| 75 | 0.67 | 10.73 | 0.65 | 10.06 |
| 50 | 0.64 | 9.15 | 0.63 | 10.13 |
| 38 × 95 | - | - | 0.66 | 9.83 |
All values are an average calculated from data obtained from measurements of three columns. RSD values are 4.6% for εt and 2.6% for kp,f.
It is a generally accepted fact that the porosity of organic polymer-based monoliths prepared by polymerization under conditions leading to 100% conversion of monomers to polymer has a value closely related to the percentage of porogens used in the polymerization mixture. The slightly larger value of the measured porosity when compared to the content of porogen in the polymerization mixture results from the volume shrinkage that takes place during polymerization. Since the polymerization mixture used in this study includes 60% porogenic solvent and 40 % monomers, we can expect porosities slightly higher than 60% since the overall porosity of the monolith always includes the percentage of the porogen in the polymerization mixture and the contribution of the shrinkage typical of all free radical polymerization. Indeed, Table 2 shows that the porosity εt measured for all of the monolithic columns averages 64% regardless of geometry with a very small variation range characterized by RSD of 4.6%.. This data also confirms that complete conversion is achieved during the polymerization reaction.
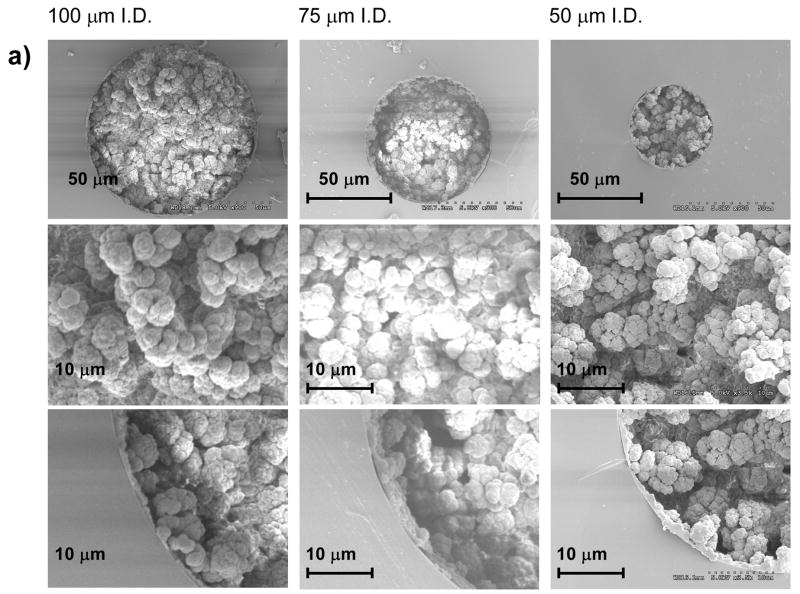
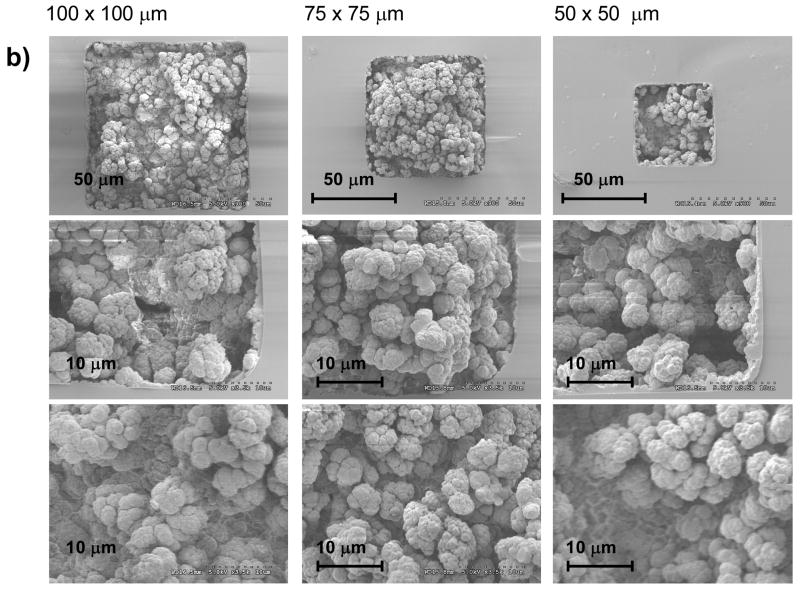
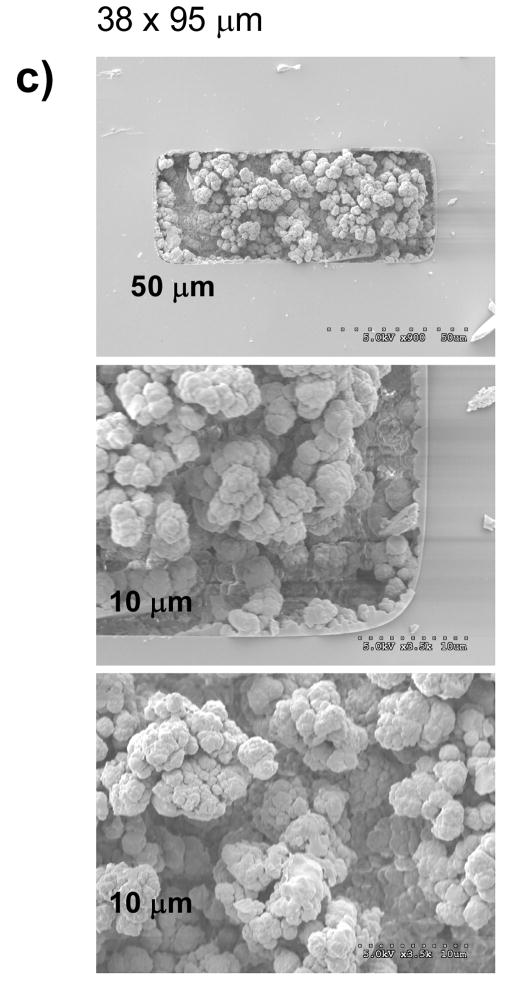
Figure 3 shows scanning electron micrographs of monoliths prepared from identical polymerization mixtures within capillary conduits of different shapes and sizes. These micrographs confirm that the morphological features of the porous polymer - size of microglobules and their aggregates, and size of through pores do not appear to change in the various capillaries. Clearly, a decrease in the conduit size does not affect the lateral homogeneity of their monolithic structure. As shown in Figure 3b and 3c, formation of the monoliths free of voids in the corners of the square and rectangular capillaries is readily achieved as a result of the use of a liquid precursor with an in situ polymerization. This is very important for the preparation of monoliths in microfluidic chips that typically do not have circular cross section and are known to be difficult to pack efficiently with porous beads [44].
Fig. 3.
Scanning electron micrographs of the cross section of fused silica capillaries with different size and shape containing porous poly(butyl methacrylate-co-ethylene dimethacrylate) monolith.
The scanning electron microscopy images shown in Figure 3 also demonstrate excellent attachment of the monolith to the conduit walls that have been previously vinylized via reaction with (trimethoxysilyl)propyl methacrylate. This covalent anchorage of the monoliths avoids the effect of shrinkage during polymerization that would otherwise lead to the formation of voids at the monolith-wall interface and also prevents the occurrence of undesired interactions of analytes with the silanol functionalities of the naked fused silica surface.
3.2 Chromatographic properties
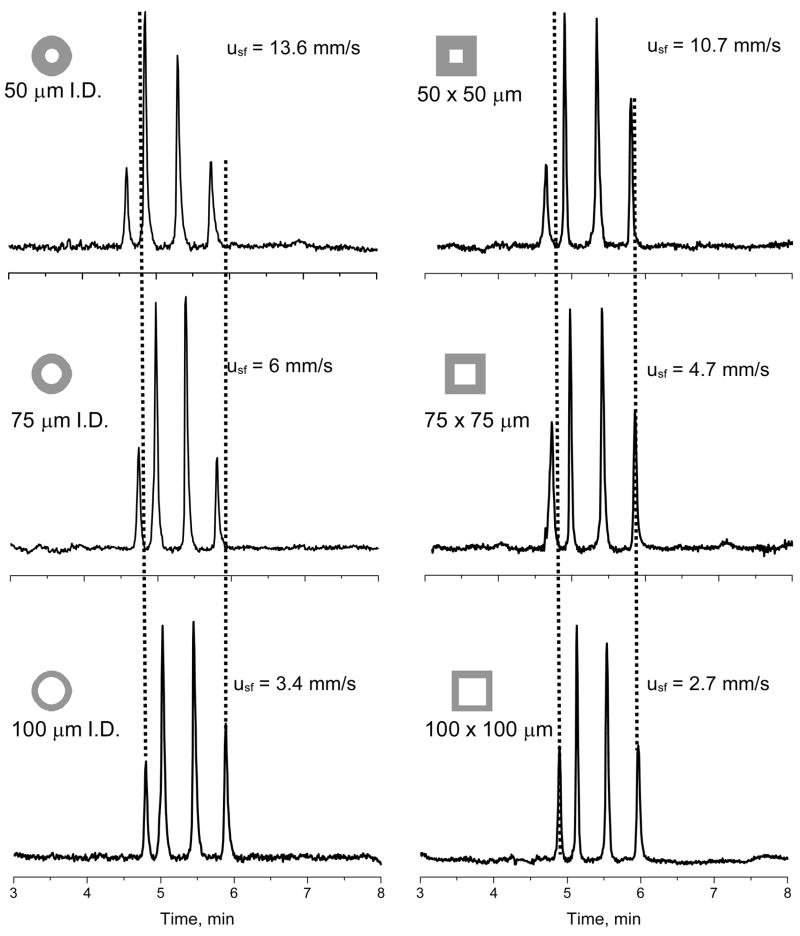
This entire study has been carried out using a single polymerization mixture leading to a typical poly(butyl methacrylate) monolith [45]. This chemistry is generally applicable to the separation of proteins and peptides [35,46]. Therefore, a model protein mixture including ribonuclease A, cytochrome c, myoglobin, and ovalbumin was selected to probe the effect of different capillary cross sections on separation performance. Figure 4 shows the separation of a protein mixture in gradient mode using the same volumetric flow rate, gradient shape, and injection volume for all capillaries. The same flow rate however results in different superficial velocities depending on the cross sectional area of the capillary. Much higher flow velocity occurs inside the smaller size conduits and translates to a higher back pressure as shown in Figure 2. However, use of the same flow rate also means that the time the front of the gradient formed in the mixer needs to reach the inlet of the capillary column is always the same and the chromatograms are not affected by the dwell volume of the UltiMate 3000 equipment.
Fig. 4.
Separation of ribonuclease A, cytochrome c, myoglobin, and ovalbumin using poly(butyl methacrylate-co-ethylene dimethacrylate) monolithic columns in cylindrical and square conduits with indicated lateral length dimensions. Conditions: Column length 15 cm, mobile phase A 0.1 %v/v formic acid solution in water, B 0.1 %v/v formic acid solution in acetonitrile, gradient 0–80 % B in A in 5 min, flow rate 1.6 μL/min, superficial velocities in the respective conduits are shown in chromatograms.
All proteins are baseline separated regardless of the substantial differences in flow velocity. A slight decrease in the retention times in smaller dimension conduits results from a smaller volume of the stationary phase related to the overall volume of the mobile phase that percolates through the capillary column.
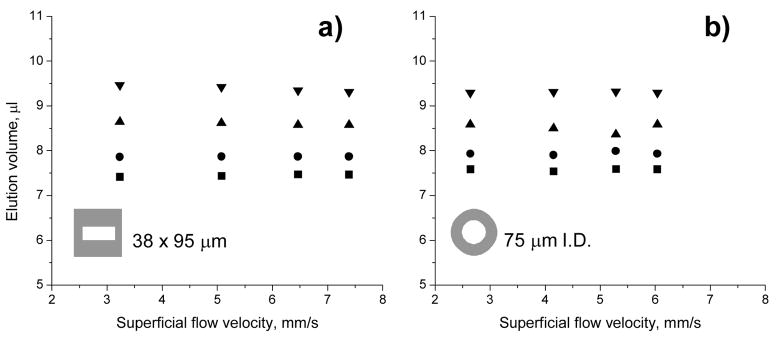
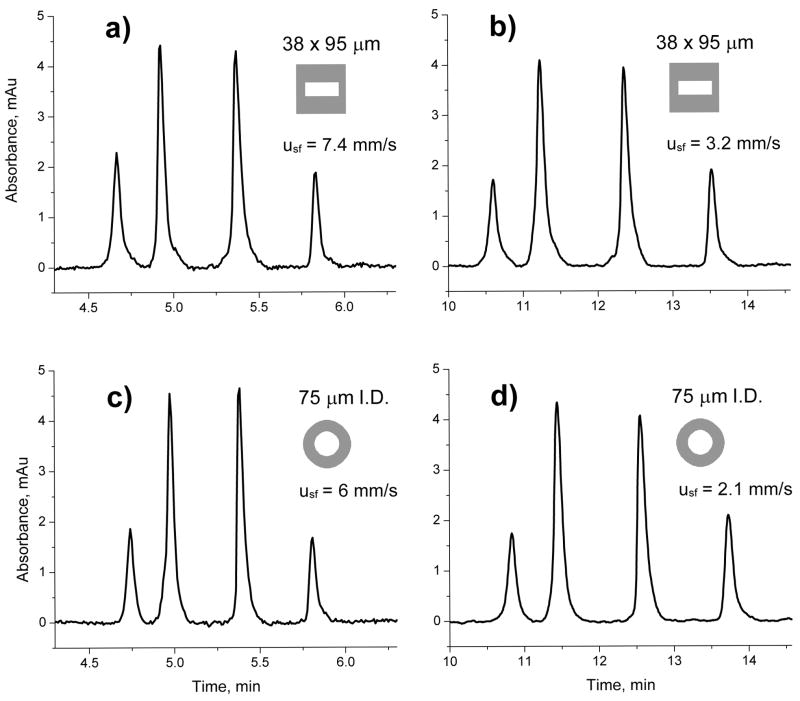
Figure 5 compares the retention volumes of all four proteins as a function of the superficial velocity calculated from the actual flow rate for both rectangular and circular conduits. Clearly, the retention volumes of the monolithic columns do not change with the flow velocity provided the steepness of the gradient is adjusted to always obtain the same gradient volume, which is the product of flow rate and gradient time. Figure 6 shows the respective chromatograms for separations at the slowest and fastest flow rate used in Figure 5. The retention times observed for the proteins at comparable flow rates are very similar and independent of the area and shape of the capillary cross section.
Fig. 5.
Effect of superficial flow velocity on elution volume of ribonuclease A (■), cytochrome c (●), myoglobin (▲), and ovalbumin (▼) using poly(butyl methacrylate-co-ethylene dimethacrylate)monolith located in a capillary with 38×95 μm rectangular and 75 μm I.D. circular cross section. Conditions: Column length 15 cm, mobile phase A 0.1 %v/v formic acid solution in water, B 0.1 %v/v formic acid solution in acetonitrile, gradient 0–80 % B in A with varying times according to a constant gradient volume of 8 μl.
Fig. 6.
Effect of flow rate on the separation of ribonuclease A, cytochrome c, myoglobin, and ovalbumin (elution order) using poly(butyl methacrylate-co-ethylene dimethacrylate) monolithic column in the 38×95 μm rectangular (a,b) and 75 μm I.D. circular capillary (c,d). Conditions: Column length 15 cm, mobile phase A: 0.1 %v/v formic acid solution in water, B: 0.1 %v/v formic acid solution in acetonitrile, gradient 0–80 % B in A in 5 min (a,c) and 11.4 min (b,d); flow rate 1.6 μL/min (a,c) and 0.7 μL/min (b,d); superficial velocities in the conduits are shown in chromatograms.
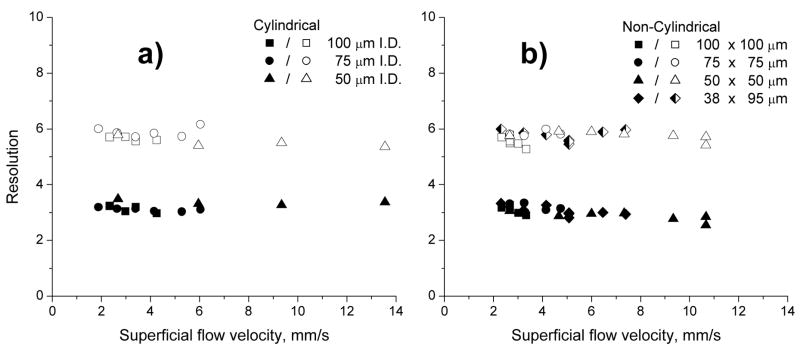
In order to further demonstrate independence of the separation performance of monolithic columns on the cross section of the conduit, we evaluated the resolution of the first and last pair of peaks at different flow velocities. Indeed, Figure 7 shows that the resolution practically does not change with the flow rate and the conduit shape and size. This finding once again confirms that mass transport is controlled by convection and that the separation performance for large protein molecules is not affected by conduit shape and flow velocity, provided the same gradient volume is used. Similar conclusion has been recently reached by Guiochon for the latter [36].
Fig. 7.
Effect of flow velocity on resolution of pairs ribonuclease A - cytochrome c (closed symbols) and myoglobin ovalbumin (open symbols) using a constant gradient volume of 8 μL by adjusting the gradient time. Conditions: Column length 15 cm, mobile phase A: 0.1 %v/v formic acid solution in water, B: 0.1 %v/v formic acid solution in acetonitrile, gradient 0–80 % B in A; Sizes of the conduits are shown in figure.
4. Conclusion
The results presented in this study demonstrate for the first time that conduit size and shape do not affect the morphology and hydrodynamic properties, of porous polymer monoliths prepared in situ. They also show their chromatographic performance in the gradient separation of proteins under chromatographic conditions best suited for this type of separation. As expected from the similarity of porous structures of chemically identical monoliths, the separations of standard proteins facilitated by the convectional mass transport are not affected by the flow rate that can be varied in a wide range thanks to the excellent permeability to flow which is a well-known feature of the monoliths. Our results also confirm that model experiments most often carried out with monoliths prepared in easily accessible capillaries having a circular cross section are adequate and easily transferrable to more expensive microfluidic chips regardless of channel shape. Ongoing experiments in our laboratory now focus on the demonstration of these separations in microfluidic chips fabricated from plastic.
Small diameter columns have a number of advantages including limited radial diffusion distance preventing dispersion of peaks, better compatibility with mass spectrometric detectors, and small volumes of both sample and mobile phase required for the separation. Although demonstrated only for a certain range of sizes, another positive outcome of our experiments is the proof of downwards scalability of the monolithic devices. Further work will also probe the ultimate limits of miniaturization of the polymer-based monoliths using capillaries with diameters lower than 10 μm to determine the size at which further downscaling is no longer possible since the size of the morphological features would exceed the size of the conduit.
Acknowledgments
Support of this research by a grant of the National Institute of General Medical Sciences, National Institutes of Health (GM44885) is gratefully acknowledged. Characterization work carried out at the Molecular Foundry was supported by the Director, Office of Science, Office of Basic Energy Sciences, Division of Materials Sciences and Engineering, of the US Department of Energy under Contract No. DE-AC02-05CH11231.
References
- 1.Neue U. HPLC Columns: Theory, Technology, and Practice. Wiley; New York: 1997. [Google Scholar]
- 2.Golay MJE. Gas Chromatography. Academic Press; New York: 1958. [Google Scholar]
- 3.Tsuda T, Novotny M. Anal Chem. 1978;50:632. [Google Scholar]
- 4.Golay MJE. J Chromatogr. 1981;216:1. [Google Scholar]
- 5.Giddings JC, Chang JP, Myers MN, Davis JM, Caldwell KD. J Chromatogr A. 1983;255:359. [Google Scholar]
- 6.Jansson M, Emmer A, Roeraade J. J High Resol Chromatogr. 1989;12:797. [Google Scholar]
- 7.Cifuentes A, Poppe H. Chromatographia. 1994;39:391. [Google Scholar]
- 8.Tsuda T, Sweedler JV, Zare RN. Anal Chem. 1990;62:2149. [Google Scholar]
- 9.Andreev VP, Dubrovsky SG, Stepanov YV. J Microcol Sep. 1997;9:443. [Google Scholar]
- 10.Spangler GE. Anal Chem. 1998;70:4805. [Google Scholar]
- 11.Poppe H. J Chromatogr A. 2002;948:3. doi: 10.1016/s0021-9673(01)01372-3. [DOI] [PubMed] [Google Scholar]
- 12.Dutta D, Leighton DT. Anal Chem. 2003;75:57. doi: 10.1021/ac020179r. [DOI] [PubMed] [Google Scholar]
- 13.Rozing G, van de Goor T, Yin HF, Killeen K, Glatz B, Kraiczek K, Lauer HH. J Sep Sci. 2004;27:1391. doi: 10.1002/jssc.200401856. [DOI] [PubMed] [Google Scholar]
- 14.Khirevich S, Holtzel A, Hlushkou D, Tallarek U. Anal Chem. 2007;79:9340. doi: 10.1021/ac071428k. [DOI] [PubMed] [Google Scholar]
- 15.Hjertén S, Liao JL, Zhang R. J Chromatogr. 1989;473:273. [Google Scholar]
- 16.Tennikova TB, Svec F, Belenkii BG. J Liq Chromatogr. 1990;13:63. [Google Scholar]
- 17.Svec F, Fréchet JMJ. Anal Chem. 1992;54:820. [Google Scholar]
- 18.Tanaka N, Ishizuka N, Hosoya K, Kimata K, Minakuchi H, Nakanishi K, Soga N. Kuromatogurafi. 1993;14:50. [Google Scholar]
- 19.Liao JL, Chen N, Ericson C, Hjertén S. Anal Chem. 1996;68:3468. doi: 10.1021/ac960261k. [DOI] [PubMed] [Google Scholar]
- 20.Peters EC, Petro M, Svec F, Fréchet JMJ. Anal Chem. 1997;69:3646. doi: 10.1021/ac970377w. [DOI] [PubMed] [Google Scholar]
- 21.Palm A, Novotny MV. Anal Chem. 1997;69:4499. [Google Scholar]
- 22.Ishizuka N, Minakuchi H, Nakanishi K, Soga N, Hosoya K, Tanaka N. HRC-J. 1998;21:477. [Google Scholar]
- 23.Deyl Z, Svec F. Capillary Electrochromatography. Elsevier; Amsterdam: 2001. [Google Scholar]
- 24.Svec F, Tennikova TB, Deyl Z. Monolithic Materials: Preparation, Properties, and Applications. Elsevier; Amsterdam: 2003. [Google Scholar]
- 25.Ivanov AR, Zang L, Karger BL. Anal Chem. 2003;75:5306. doi: 10.1021/ac030163g. [DOI] [PubMed] [Google Scholar]
- 26.Luo Q, Shen Y, Hixson KK, Zhao R, Yang F, Moore RJ, Mottaz HM, Smith RD. Anal Chem. 2005;77:5028. doi: 10.1021/ac050454k. [DOI] [PubMed] [Google Scholar]
- 27.Fintschenko Y, Choi WY, Ngola SM, Shepodd TJ. Fresenius’ J Anal Chem. 2001;371:174. doi: 10.1007/s002160100948. [DOI] [PubMed] [Google Scholar]
- 28.Lazar IM, Li L, Yu Y, Karger BL. Electrophoresis. 2003;24:3655. doi: 10.1002/elps.200305609. [DOI] [PubMed] [Google Scholar]
- 29.Stachowiak TB, Svec F, Fréchet JMJ. J Chromatogr A. 2004;1044:97. doi: 10.1016/j.chroma.2004.04.075. [DOI] [PubMed] [Google Scholar]
- 30.Bedair M, El Rassi Z. Electrophoresis. 2004;25:4110. doi: 10.1002/elps.200406136. [DOI] [PubMed] [Google Scholar]
- 31.Ro KW, Nayak R, Knapp DR. Electrophoresis. 2006;27:3547. doi: 10.1002/elps.200600058. [DOI] [PubMed] [Google Scholar]
- 32.Schaller D, Hilder EF, Haddad PR. GIT Lab J, Eur. 2007;11:41. [Google Scholar]
- 33.Svec F, Stachowiak TB. In: Handbook of Capillary and Microchip Electrophoresis and Associated Microtechniques. Landers J, editor. Taylor & Francis; Boca Raton, FL: 2007. p. 1297. [Google Scholar]
- 34.Svec F, Huber CG. Anal Chem. 2006;78:2100. doi: 10.1021/ac069383v. [DOI] [PubMed] [Google Scholar]
- 35.Geiser L, Eeltink S, Svec F, Fréchet JMJ. J Chromatogr A. 2007;1140:140. doi: 10.1016/j.chroma.2006.11.079. [DOI] [PMC free article] [PubMed] [Google Scholar]
- 36.Guiochon G. J Chromatogr A. 2007;1168:101. [Google Scholar]
- 37.Gusev I, Huang X, Horvath C. J Chromatogr. 1999;855:273. doi: 10.1016/s0021-9673(99)00697-4. [DOI] [PubMed] [Google Scholar]
- 38.Al Bokari M, Cherrak D, Guiochon G. J Chromatogr A. 2002;975:275. doi: 10.1016/s0021-9673(02)01271-2. [DOI] [PubMed] [Google Scholar]
- 39.Kele M, Guiochon G. J Chromatogr A. 2002;960:19. [Google Scholar]
- 40.Eeltink S, Rozing GP, Schoenmakers PJ, Kok WT. J Chromatogr A. 2004;1044:311. doi: 10.1016/j.chroma.2004.06.007. [DOI] [PubMed] [Google Scholar]
- 41.Hsieh SC, Jorgenson JW. Anal Chem. 1996;68:1212. doi: 10.1021/ac950682m. [DOI] [PubMed] [Google Scholar]
- 42.Kennedy RT, Jorgenson JW. Anal Chem. 1989;61:1128. doi: 10.1021/ac00180a012. [DOI] [PubMed] [Google Scholar]
- 43.Ehlert S, Roessler T. Tallarek U J Sep Sci. 2008;31:1719. doi: 10.1002/jssc.200800018. [DOI] [PubMed] [Google Scholar]
- 44.Lazar IM, Trisiripisal P, Sarvaiya HA. Anal Chem. 2006;78:5513. doi: 10.1021/ac060434y. [DOI] [PubMed] [Google Scholar]
- 45.Vlakh EG, Tennikova TB. J Sep Sci. 2007;30:2801. doi: 10.1002/jssc.200700284. [DOI] [PubMed] [Google Scholar]
- 46.Eeltink S, Geiser L, Svec F, Fréchet JMJ. J Sep Sci. 2007;30:2814. doi: 10.1002/jssc.200700185. [DOI] [PMC free article] [PubMed] [Google Scholar]


