Abstract
Purpose
To use a population-based cancer registry to examine trends in renal cell carcinoma (RCC) incidence and survival among four racial/ethnic groups (White, Black, Hispanic, and Asian/Pacific Islander (A/PI)) and both genders.
Materials and Methods
Race/ethnicity, gender, age, staging, length of survival, and cause of death data were analyzed using 39,434 cases of RCC from 1988 to 2004 from the California Cancer Registry. Annual age-adjusted incidence rates and relative survival rates were calculated for the racial/ethnic and gender groups. These rates and the percent of localized cancer were plotted by year, and Microsoft Excel® was used to calculate linear regression equations. Median age was also calculated. Z-tests and X2-tests were performed to determine p-values.
Results
A rise in RCC incidence was found, with localized cancer accounting for most of the increase. Blacks had a significantly higher incidence rate (p<0.0001) and lower survival rate (p<0.0001) than all other races/ethnicities, despite having more localized cancer (p<0.005). Blacks were also diagnosed at a younger age (p<0.0001) than their counterparts. On the other hand, A/PI’s had a lower incidence rate (p<0.0001) and higher survival rate (p<0.05) than all other races/ethnicities. Males had approximately twice the incidence rate of females and a lower survival rate (p<0.005).
Conclusions
Higher incidence rates and lower survival rates were identified among Blacks and males when compared to their counterparts, while A/PI’s showed the opposite trends. Such racial/ethnic and gender disparities in RCC incidence and survival may help elucidate biological, behavioral, and environmental factors that can potentially be addressed.
Keywords: Renal cancer, Race, Gender, Incidence, Survival rate
INTRODUCTION
Renal cancer was estimated to be responsible for approximately 51,190 new cancer cases in the United States in 2007, making it the seventh most common cancer among men; it was also estimated to have caused 12,890 deaths.1 Of these renal cancers, renal cell carcinoma (also called renal cell adenocarcinoma, clear cell cancer of the kidney, hypernephroma, and Grawitz tumor) accounted for 85%, while renal pelvis cancer accounted for most of the remainder.2 Renal cell carcinoma and renal pelvis cancer have been shown to have distinct epidemiology, histology, therapy, and natural history.3 We focused exclusively on renal cell carcinoma (RCC) because it is the predominant form of renal cancer and occurs in sufficient numbers to permit in-depth analysis.
RCC is twice as common in men than in women,4 with the average age at diagnosis in the early 60s.5 Studies have shown that having a first degree relative with any kidney cancer is associated with a 2 to 3-fold increased risk.6 Smoking, hypertension, and obesity have also been strongly associated with RCC.5, 7 The only consistently reported dietary risk factor has been a lack of fruit and vegetable consumption.5
Recent epidemiological studies have suggested that the incidence rate of RCC is on the rise, with localized cancer predominantly accounting for the increase.5, 8–12 Data from the National Cancer Institute’s Surveillance, Epidemiology, and End Results (SEER) program showed that the incidence rate of RCC has increased more rapidly in Blacks than Whites and in females than males.5, 8, 9 Differences between the survival rates of Black and White patients were also found, but the results were confounded by factors such as socioeconomic disparities, performance status, and co-morbid conditions.8
This study attempts to confirm recent reports of disparities in incidence and survival between Black and Non-Hispanic White RCC patients using data from the California Cancer Registry (CCR) from 1988 to 2004. Additionally, the diverse demographics of California allow Hispanic and Asian/Pacific Islander (A/PI) populations to be included in the study in sufficient numbers for analysis. Incidence and survival data were also analyzed by gender for each of the racial/ethnic groups and the overall patient population.
MATERIALS AND METHODS
Database
The data used for this project came from the California Cancer Registry (CCR), which has been the repository for all incident cancer cases in the state of California since 1988. One major benefit of using the CCR is its consistent population base. Previous studies have used SEER program data between 1975 and 2002. During this period the data coverage expanded from 9 to 11 to 13 regions.5, 8, 9 Two of the added regions were Los Angeles County and San Jose-Monterey, California, which may have greatly altered the racial/ethnic distribution. On the other hand, this study used a database which contains state-mandated reports of all cancer cases in California since 1988.
New cancer cases are reported to the CCR by physicians, health facilities, laboratories, nursing homes, autopsies, and death certificates. There are penalties for the failure to report new cases. Cases are abstracted by Certified Cancer Abstractors. Ten regional cancer registries serve as receiving facilities and report to the central registry. Tasks such as quality assurance and the removal of duplicate entries are completed at both the regional and central levels. The CCR is certified by the North American Association of Central Cancer Registries (NAACCR), and now the entire state is part of the SEER program. Thus, the CCR uses the same histological codes as does the SEER program. Currently, complete data are available from 1988 to 2004.
Statistical Methods
All patients diagnosed with RCC (i.e., cancers originating from the kidney, excluding those of the renal pelvis) were chosen from the database. The following variables were selected for further analysis: race/ethnicity (White, Black, Hispanic, or A/PI), gender, stage at time of diagnosis (localized, regional, or distant), age at diagnosis, length of survival after diagnosis, and cause of death.
Annual age-adjusted incidence rates and relative survival rates for the first ten years following diagnosis were analyzed using standard statistical analytical tools.13 Annual incidence rates, survival rates, and percent of localized cancer were plotted by year, and Microsoft Excel® was used to calculate linear regression equations. Median age at diagnosis was also calculated. Z-tests and X2-tests were used to determine p-values.
Analysis for each variable was conducted after excluding the cases in which the variable was categorized as “unknown.” Gender was known for all cases, and the percentage of unknown data was 0.0% (7/39,434) for age, 0.6% (227/39,434) for race/ethnicity, and 5.2% (2,062/39,434) for stage.
RESULTS
Incidence Trends
From 1988 to 2004, a total of 39,434 cases of RCC were reported to the CCR. Table I lists these cases by race/ethnicity and gender. Annual age-adjusted incidence rates (AAIR’s) were computed for the total population and the gender and racial/ethnic groups. The AAIR’s were plotted for each year, and linear regression equations were calculated to determine the slope (Figures 1 and 2).
Table I.
Number of patients by race/ethnicity and gender
| Race/Ethnicity | Male | Female | Total |
|---|---|---|---|
| White | 17,652 | 9,652 | 27,304 |
| Black | 1,738 | 1,024 | 2,762 |
| Hispanic | 4,263 | 2,892 | 7,155 |
| Asian/Pacific Islander | 1,282 | 702 | 1,984 |
| Other/Unknown | 146 | 83 | 229 |
|
| |||
| Total study population | 25,081 | 14,353 | 39,434 |
Figure 1.
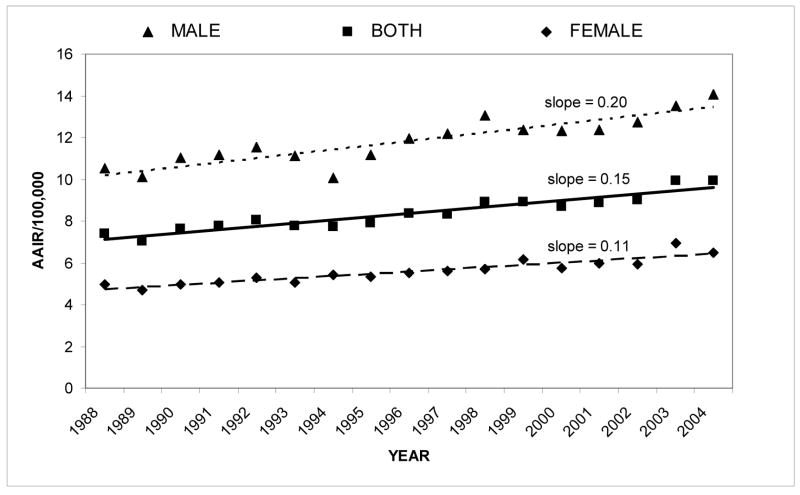
Renal cell carcinoma: age-adjusted incidence rate from 1988–2004 by gender
Figure 2.
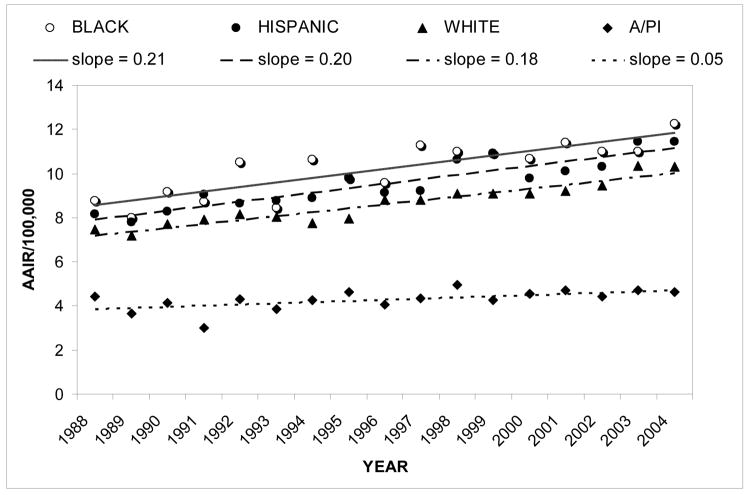
Renal cell carcinoma: age-adjusted incidence rate from 1988–2004 by race/ethnicity
For the total population, the slope of the linear regression equation was 0.15. On average, male incidence rates were about twice that of females (Figure 1). The slopes in Figure 1 show that the incidence rate of males also increased at approximately twice the rate of females. As shown in Figure 2, incidence rates for Blacks versus all other races/ethnicities were found to be significantly higher (z=9.02, p<0.0001) and to have increased more rapidly with a slope of 0.21. This was also true for Hispanics, though to a slightly lesser extent (z=11.31, p<0.0001; slope of 0.20). Incidence rates were found to be significantly lower in A/PI’s than in the total population (z=4.67, p<0.0001). Whites showed a slightly higher incidence rate than the total population (z=3.92, p<0.001), although the statistical significance of this is most likely due to the large sample size.
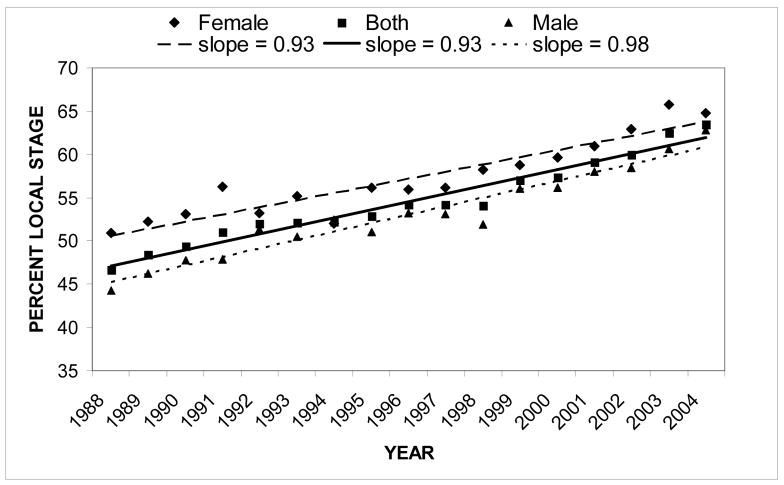
The percent of RCC cases found to be localized at diagnosis increased steadily from 1988 to 2004 with a slope of 0.93 (Figure 3). Percent localized cancer was also plotted for the two genders. Overall, females showed a significantly higher percent of localized cancer than males (X2=59.7, p<0.0001). Males had a greater rate of increase of percent localized cancer (slope=0.98) than females (slope=0.93). When the individual racial/ethnic groups were explored, tremendous year-to-year variation within the groups made graphing unproductive. However, Table II lists the overall percent of localized, regional, and distant cancer for each racial/ethnic and gender group. Localized and regional cancer varied between the groups whereas distant cancer was relatively constant. Blacks had a significantly higher percent of localized cancer when compared to all other patients (X2=19.3, p<0.005). On the other hand, Whites had a statistically significantly lower percent of localized cancer when compared to all other patients (X2=6.08, p<0.025).
Figure 3.
Renal cell carcinoma: percent local stage from 1988–2004
Table II.
Staging at time of diagnosis by racial/ethnic and gender group
| Race/Ethnicity or Gender | % local | % regional | % distant |
|---|---|---|---|
| White | 58.2 | 20.1 | 21.7 |
| Black | 63.1 | 15.5 | 21.4 |
| Hispanic | 57.4 | 20.9 | 21.7 |
| Asian/Pacific Islander | 60.3 | 18.1 | 21.6 |
|
| |||
| Male | 56.8 | 20.8 | 22.4 |
| Female | 61.5 | 18.1 | 20.4 |
|
| |||
| Total study population | 58.5 | 19.8 | 21.7 |
The median age at diagnosis by race/ethnicity and gender is shown in Table III. Significant differences in age at diagnosis were found between males and females (z=8.92, p<0.0001). Blacks and Hispanics had the same median age at diagnosis of 61, which was significantly lower than their respective counterparts (z=11.4, p<0.0001; z=22.8, p<0.0001; respectively). A/PI’s also had a significantly lower median age at diagnosis of 63 versus their counterparts (z=4.67, p<0.0001). Whites had a higher median age at diagnosis of 66 when compared to all other races/ethnicities (z=28.6, p<0.0001).
Table III.
Median age at diagnosis by gender and race/ethnicity
| Race/Ethnicity | Male | Female | Combined | Standard error |
|---|---|---|---|---|
| White | 65 | 68 | 66 | 0.078 |
| Black | 60 | 62 | 61 | 0.247 |
| Hispanic | 61 | 62 | 61 | 0.158 |
| Asian/Pacific Islander | 63 | 64 | 63 | 0.298 |
|
| ||||
| Total study population | 64 | 66 | 65 | 0.066 |
Survival Analysis
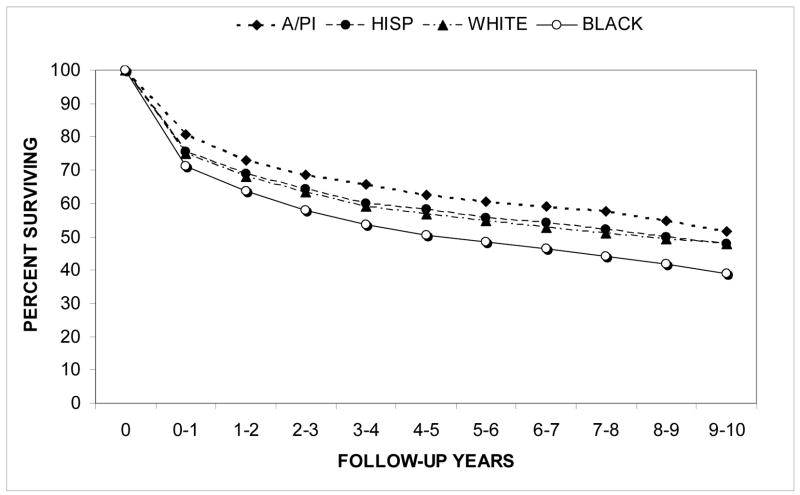
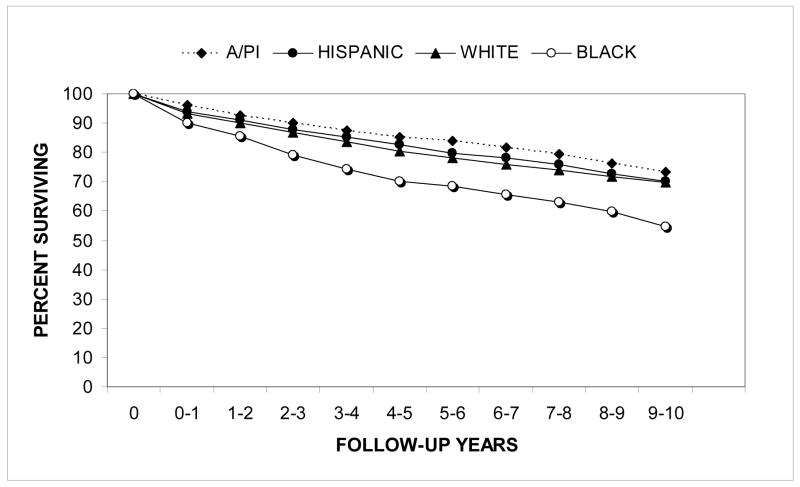
Relative survival rates for the first ten years after diagnosis are shown in Figure 4 for the racial/ethnic groups. Relative survival rates were higher for A/PI’s (z=1.96, p=0.05) and significantly lower for Blacks (z=6.43, p<0.0001) when compared to their counterparts. Relative survival rates were also significantly higher for females than for males (z=3.06, p<0.005).
Figure 4.
Renal cell carcinoma: relative cumulative actuarial survival from 1988–2004 by race/ethnicity
Relative survival rates for localized RCC patients by racial/ethnic group are shown in Figure 5. Comparing only localized RCC augmented the difference in survival between Black patients and all other groups.
Figure 5.
Localized renal cell carcinoma: relative cumulative actuarial survival from 1988–2004 by race/ethnicity
Table IV shows the causes of death for the study population, divided into racial/ethnic and gender groups. Cause of death is listed as neoplasm-specific for approximately one-third of RCC deaths, and of those neoplasm deaths, approximately 80% were listed as kidney-specific. Approximately 10% of patients who died did not have a death certificate available to establish the cause of death. White patients had a significantly higher percentage of neoplasm as the cause of death when compared to the other races/ethnicities, while Hispanics and A/PI’s had fewer death certificates available.
Table IV.
Cause of death by racial/ethnic and gender group
| Race/Ethnicity or Gender | Neoplasm (% kidney -specific) | Other | Death certificate not available |
|---|---|---|---|
| White | 36.0% (79.1%) | 54.7% | 9.3% |
| Black | 32.0% (80.0%) | 59.6% | 8.4% |
| Hispanic | 31.9% (84.9%) | 57.0% | 11.1% |
| Asian/Pacific Islander | 31.9% (81.8%) | 54.6% | 13.5% |
|
| |||
| Male | 34.8% (79.7%) | 55.5% | 9.8% |
| Female | 35.1% (80.8%) | 55.3% | 9.6% |
|
| |||
| Total study population | 34.8% (80.1%) | 55.5% | 9.7% |
DISCUSSION
The current analysis shows that annual age-adjusted incidence rates of RCC among Californians have risen steadily between 1988 and 2004. As shown in previous studies, localized cancer was found to account for most of the increased incidence.8, 9 This may largely be due to the increased incidental detection of RCC, resulting from the growing use of ultrasound and CT scans for non-renal cancer-related problems.10–12 Risk factors such as smoking, hypertension, obesity, and diet have been associated with RCC5, 7 and may play a role in the rising incidence. Of these factors, smoking prevalence has decreased over time and therefore may not explain the rising incidence of RCC. However, the prevalence of obesity has increased significantly over time and could be contributing to the increased incidence.
Black patients were found to have a significantly higher incidence rate than all other races/ethnicities. They were also diagnosed at a younger age with more localized (low-stage) cancer. It would be unlikely for this higher incidence rate to be explained by increased incidental detection since Black patients tend to have less access to healthcare for undergoing ultrasound and CT scans.14 It is possible that the disparity in incidence rates may be due in part to racially-based genetic and biologic differences in the tumor and the patient. Black patients also have a much higher prevalence of hypertension at a younger age,15 which is a significant risk factor for developing RCC. Overall greater environmental stress experienced by the Black community may also contribute to increased incidence of RCC.
Despite having more localized cancer, Black RCC patients still have a significantly lower survival rate than all other races/ethnicities; this decrease in survival is augmented when comparing only localized RCC. Previous studies have also shown this disparity, while acknowledging confounding factors such as co-morbidities.8 Other studies have attempted to account for co-morbidities by analyzing death certificate cause of death data to isolate cancer-specific deaths.5 However, death certificate accuracy is often as low as 40% due to wording inaccuracies and lack of training among physicians.16 Because of this and because 10% of the patients in this study did not even have a death certificate available, it was decided that the cause of death data was not an effective means for accounting for co-morbidities.
Instead, relative survival data was used to account for other causes of death that would be present in the general population for each gender and age. Relative survival rates confirmed that Black patients do not survive as well as their non-Black counterparts. This is true even though Black patients are diagnosed with more localized cancer. It was also noted that Black patients are diagnosed at a younger age, a circumstance that should give them more resilience in the face of aggressive treatments, but may suggest the presence of a more aggressive cancer. This observed disparity in survival rates for Black patients may also be due in part to lack of access to treatment and additional stressors associated with lower socioeconomic status. Moreover, Berndt et al showed that the difference in survival between black and white RCC patients can be substantially reduced by accounting for co-morbidities and the lower likelihood of receiving nephrectomy treatment among Black patients.17
On the other hand, A/PI’s were found to have a significantly lower annual age-adjusted incidence rate and a higher relative survival. This is consistent with trends in overall cancer incidence and survival among A/PI’s in California reported in 2003.18 This may partly be due to the higher percentage of localized cancers diagnosed among A/PI’s. Other factors could include differences in tumor aggressiveness, co-morbid diseases, cultural behaviors, and access to and use of the healthcare system. However, it is important to note that different Asian ethnic sub-groups often have different cancer burdens, which may skew the overall trends in the A/PI population.19
As previously reported, males were found to have approximately twice the incidence rate of females.4 However, contrary to previous reports, male incidence rates appeared to rise more rapidly than female incidence rates.5, 9, 20 This new trend may be related to increasing localized cancer incidence, since localized cancer was also shown to have increased more rapidly among males than females. Additionally, males were found to have a lower relative survival rate than females. This may be a result of the higher percent of localized cancer among females. A 2002 study suggested that the difference between male and female survival rates may be due to more extensive use of the healthcare system by females than males.20 Other potential causes of this observed disparity include biological differences in the tumor and in male versus female patients, as well as the higher prevalence of hypertension in males versus females.16
As with most studies, the findings of this study must be generalized with caution. Gaps in data completeness for staging and, to a much lesser extent, race/ethnicity may affect accuracy. Additionally, comorbidity data are not available in the CCR, which could influence the disparities in survival.
CONCLUSIONS
The incidence of RCC in California has risen steadily between 1988 and 2004, with localized cancer accounting for most of that increase. Significant differences in incidence rates and survival rates were observed among racial/ethnic and gender groups. Black patients had a significantly higher incidence rate and lower relative survival rate than all other races/ethnicities, while Asians/Pacific Islanders showed just the opposite. Males had twice the incidence rate and a slightly lower relative survival rate than females. Identification of such racial/ethnic and gender disparities in RCC incidence rates and survival rates may help elucidate biological, behavioral, and environmental factors that can potentially be addressed.
Acknowledgments
ACKNOWLEDGEMENTS AND DISCLAIMER
This study was supported by funding from: the National Cancer Institute’s grant R25CA65745, Cancer Center Core grant #5 P30 CA023100-22, and UCSF/UCLA Minority Training Program for Cancer Control Research grant R25 CA078583; the National Institutes of Health’s Division of National Center on Minority Health and Health Disparities EXPORT grant P60MD00220; the Minority Institution/Cancer Center Partnership Program grants #U56 CA92079 and #U56 CA92081; and the National Institute of Aging’s Medical Student Training in Aging Research grant T35AG026757.
The collection of cancer incidence data used in this study was supported by the California Department of Health Services as part of the statewide cancer reporting program mandated by the California Health and Safety Code Section 103885, the National Cancer Institute’s Surveillance, Epidemiology and End Result Program, and the Centers for Disease Control and Prevention National Program of Cancer Registries. The ideas and opinions expressed herein are those of the author and endorsement by the State of California, Department of Health Services, the National Cancer Institute and the Centers for Disease Control and Prevention is not intended nor should be inferred.
Key of Definitions for Abbreviations
- RCC
Renal Cell Carcinoma
- CCR
California Cancer Registry
- SEER
National Cancer Institute’s Surveillance, Epidemiology, and End Results Program
- API
Asian/Pacific Islander
Footnotes
Publisher's Disclaimer: This is a PDF file of an unedited manuscript that has been accepted for publication. As a service to our customers we are providing this early version of the manuscript. The manuscript will undergo copyediting, typesetting, and review of the resulting proof before it is published in its final citable form. Please note that during the production process errors may be discovered which could affect the content, and all legal disclaimers that apply to the journal pertain.
References
- 1.American Cancer Society. Cancer Facts and Figures 2007. 2007. [Google Scholar]
- 2.SEER Program Public Use Data Tapes 1973–2002, November 2004 Submission. Bethesda. National Cancer Institute, Division of Cancer Control and Population Science, Surveillance Research Program, Cancer Statistics Branch, 2005
- 3.Mufti GR, Gove JR, Badenoch DF, Fowler CG, Tiptaft RC, England HR, et al. Transitional cell carcinoma of the renal pelvis and ureter. Br J Urol. 1989;63:135. doi: 10.1111/j.1464-410x.1989.tb05149.x. [DOI] [PubMed] [Google Scholar]
- 4.Cancer incidence in five continents. VIII. IARC Sci Publ; 2002. p. 1. [PubMed] [Google Scholar]
- 5.Lipworth L, Tarone RE, McLaughlin JK. The epidemiology of renal cell carcinoma. J Urol. 2006;176:2353. doi: 10.1016/j.juro.2006.07.130. [DOI] [PubMed] [Google Scholar]
- 6.Noordzij MA, Mickisch GH. The genetic make-up of renal cell tumors. Urol Res. 2004;32:251. doi: 10.1007/s00240-002-0279-9. [DOI] [PubMed] [Google Scholar]
- 7.Amling CL. The association between obesity and the progression of prostate and renal cell carcinoma. Urol Oncol. 2004;22:478. doi: 10.1016/j.urolonc.2004.10.004. [DOI] [PubMed] [Google Scholar]
- 8.Vaishampayan UN, Do H, Hussain M, Schwartz K. Racial disparity in incidence patterns and outcome of kidney cancer. Urology. 2003;62:1012. doi: 10.1016/j.urology.2003.07.010. [DOI] [PubMed] [Google Scholar]
- 9.Chow WH, Devesa SS, Warren JL, Fraumeni JF. Rising incidence of renal cell cancer in the United States. Jama. 1999;281:1628. doi: 10.1001/jama.281.17.1628. [DOI] [PubMed] [Google Scholar]
- 10.Bretheau D, Lechevallier E, Eghazarian C, Grisoni V, Coulange C. Prognostic significance of incidental renal cell carcinoma. Eur Urol. 1995;27:319. doi: 10.1159/000475189. [DOI] [PubMed] [Google Scholar]
- 11.Homma Y, Kawabe K, Kitamura T, Nishimura Y, Shinohara M, Kondo Y, et al. Increased incidental detection and reduced mortality in renal cancer--recent retrospective analysis at eight institutions. Int J Urol. 1995;2:77. doi: 10.1111/j.1442-2042.1995.tb00428.x. [DOI] [PubMed] [Google Scholar]
- 12.Jayson M, Sanders H. Increased incidence of serendipitously discovered renal cell carcinoma. Urology. 1998;51:203. doi: 10.1016/s0090-4295(97)00506-2. [DOI] [PubMed] [Google Scholar]
- 13.Epi Info 6.01. Atlanta: Center for Disease Control and Prevention; 1994. [Google Scholar]
- 14.Geronimus AT, Bound J, Waidmann TA, Hillemeier MM, Burns PB. Excess mortality among blacks whites in the United States. N Engl J Med. 1996;335:1552. doi: 10.1056/NEJM199611213352102. [DOI] [PubMed] [Google Scholar]
- 15.Vargas CM, Ingram DD, Gillum RF. Incidence of hypertension and educational attainment: the NHANES I epidemiologic followup study. First National Health and Nutrition Examination Survey. Am J Epidemiol. 2000;152:272. doi: 10.1093/aje/152.3.272. [DOI] [PubMed] [Google Scholar]
- 16.Lakkireddy DR, Basarakodu KR, Vacek JL, Kondur AK, Ramachandruni SK, Esterbrooks DJ, et al. Improving death certificate completion: a trial of two training interventions. J Gen Intern Med. 2007;22:544. doi: 10.1007/s11606-006-0071-6. [DOI] [PMC free article] [PubMed] [Google Scholar]
- 17.Berndt SI, Carter HB, Schoenberg MP, Newschaffer CJ. Disparities in treatment and outcome for renal cell cancer among older black and white patients. J Clin Urol. 2007;25:24. doi: 10.1200/JCO.2006.10.0156. [DOI] [PubMed] [Google Scholar]
- 18.Nasseri K. Secular trends in cancer mortality, California 1970–1998. Cancer Detect Prev. 2004;28:143. doi: 10.1016/j.cdp.2003.12.007. [DOI] [PubMed] [Google Scholar]
- 19.McCracken M, Olsen M, Chen MS, Jr, Jemal A, Thun M, Cokkinides V, et al. Cancer incidence, mortality, and associated risk factors among Asian Americans of Chinese, Filipino, Vietnamese, Korean, and Japanese ethnicities. CA Cancer J Clin. 2007;57:190. doi: 10.3322/canjclin.57.4.190. [DOI] [PubMed] [Google Scholar]
- 20.Beisland C, Medby PC, Beisland HO. Renal cell carcinoma: gender difference in incidental detection and cancer-specific survival. Scand J Urol Nephrol. 2002;36:414. doi: 10.1080/003655902762467558. [DOI] [PubMed] [Google Scholar]


