Abstract
This study aimed to measure solid and liquid component parameters for canine vocal fold lamina propria tissue, as is consistent with the solid and liquid fraction parameters in the context of the biphasic theory. A liquid-displacement apparatus was developed and utilized to estimate volumes of small samples of tissue. Accuracy was determined by calibrations with an object of known mass and density (copper). The experimental apparatus was then used to determine the volume of eight tissue samples, followed by an apparently complete dehydration of the samples, yielding the dry or solid tissue. The mass and volume fractions of the liquid component were sufficiently higher than those of the solid component. These results represent preliminary experimental evidence for the biphasic composition (solid-liquid) of canine lamina propria tissue as predicted in the biphasic theory. This study presents an effective experimental method to estimate some of the biphasic model parameters, and may provide a valuable application in exploring the viscoelastic behaviors of vocal fold lamina propria tissue.
INTRODUCTION
Vocal fold (VF) tissue is known to be a highly hydrated interstitial tissue. The level of VF tissue hydration plays an important role in vocal function (Verdolini et al., 2002). Studies have shown that VF dehydration can lead to an increase in phonation threshold pressure and a decrease in vocal efficiency (Verdolini et al., 1994; Jiang et al., 2000). Classic viscoelastic models of VFs (Chan and Titze, 2000; Chan and Tayama, 2002), such as the quasi-linear model and the statistical network model, have been applied to study viscoelastic behaviors of the tissue. However, these models do not account for the liquid dynamics in the VF tissue. Clinically, dehydration contributing to dysphonia is associated with the loss of liquid components of the tissue. Without accounting for the liquid component in VF tissue, studies have not quantified the effects of liquid loss on the biomechanical properties of VF tissue.
A biphasic theory has been introduced to describe the effect of liquid components of the VF tissue (Zhang et al., 2008). VF tissue can be described as a porous solid component (collagen, proteoglycan, and other structural components) that is swollen by interstitial liquid. Biphasic (liquid-solid) descriptions of tissue, which consider the interaction between the solid and liquid components of the tissue, show potential for explaining rheologic properties of VF lamina propria (LP). It predicts that the liquid component of the tissue is critical for shielding the extracellular solid matrix from extreme stressors, indicating that dehydration may decrease the stress support offered by the interstitial liquid. In addition, the liquid component is important in determining the stiffness, viscosity, and mass of the tissue (Chan and Tayama, 2002). In the biphasic theory, the liquid volume fraction was defined to describe the ratio of liquid volume to the total tissue volume. The liquid loss due to dehydration can be quantitatively measured by a decrease in the liquid volume fraction. Therefore, the direct measurement of the liquid and solid components is necessary for the application of the biphasic theory, a better understanding of the multiphasic composition of VF tissue and the effect of these parameters on biomechanical tissue properties. Despite these parameters’ utility, liquid and solid volume fractions of laryngeal systems have not been measured in previous studies, although analogous parameters have been quantified in other biomedical systems, such as articular cartilage (Mow et al., 1980, 1984).
The purpose of this study was to measure the individual contributions of the liquid and solid components to the total VF LP tissue’s mass and volume. Due to the small tissue samples, we will apply a liquid-displacement apparatus to measure tissue volume. We will examine the accuracy of the experimental apparatus through measurements of copper samples, which has a known density and constant volume. Tissue volume measurement, in combination with the dry mass, allows for the calculation of the mass and volume fractions of the liquid and solid in the tissue. This information may lead to a better understanding of the biphasic description of VF LP tissue.
MATERIALS AND METHODS
Tissue sample preparation
Four larynges were harvested from healthy laboratory dogs, which yielded the eight tissue samples used in the experiment. Excision of the larynx was performed according to the procedure described by Jiang and Titze (1993). The excised larynges were placed in a 0.9% saline solution with a calculated density ρsa of 1.004 g∕ml (McCutcheon et al., 1993). The larynges were flash frozen in liquid nitrogen, stored in a freezer at −20 °C, and slowly unthawed in saline at about 4 °C a day before the experiment according to the Chan and Titze (2003) procedure which was found to minimize postmortem changes to VF tissue. A VF LP tissue was dissected out en block using a scalpel, with the anterior border 1 mm posterior to the anterior commissure, the posterior border 1 mm anterior to the arytenoid cartilage, the inferior border 5 mm inferior to the superior glottal edge, and the lateral border 5 mm lateral to the glottal edge. The thyroarytenoid muscle was then dissected away from the LP under a dissecting microscope using a scalpel. The epithelium was included in each sample in order to preserve the entire superficial lamina propria. The sample was then placed in a beaker containing 0.9% saline and allowed to equilibrate for 5–10 min before further handling.
Liquid-displacement method
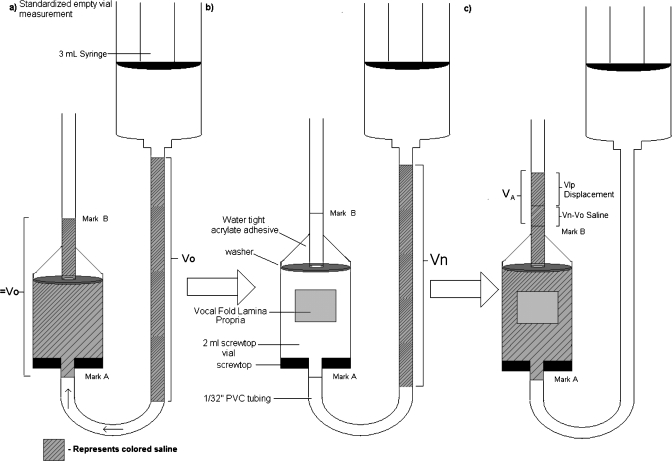
Due to the small size of VF tissue, directly measuring tissue volume would bring sufficient errors. We applied the liquid-displacement method to measure the LP tissue volume VLP. Figure 1 shows a schematic of this method, where the apparatus was assembled using approximately 2 m of 1/32 in. diameter clear PVC tubing, a 2 ml screw-top vial, a washer, silicone, and an acrylate adhesive. The screw-top vial was inverted and connected vertically downward (through the cap) to approximately 1.5 m of tubing in a U-bend shape. About 0.5 m of tubing was then run through the top of the vial using silicone adhesive for sealant. A washer was placed inside the vial, wedged against the chamber sides and below the silicone adhesive, preventing any volume changes in the chamber due to silicone compression.
Figure 1.
Schematic of the liquid-displacement measurement process.
Colored 0.9% saline solution was pushed via a 3 ml syringe (Terumo Supply, Elkton, MD) into the upper portion of the 1.5 m section of tubing and the height of this column was measured with an accuracy of 0.01 cm. 50 ml portions of saline had been colored using 1 drop of food dye to aid in measuring saline column height and identifying residual liquid remaining in the tubing. It was assumed that the small amount of dye used did not significantly affect the density or osmotic characteristics of the saline solution. Therefore, the density of the solution was calculated at 1.004 g∕ml (McCutcheon et al., 1993). Utilizing the known diameter of the tubing and the height of the water column, we were able to calculate the volume of this solution, V0. The syringe was attached to the upper 1.5 m section throughout the procedure and facilitated the movement of the saline column along the tubing by “pushing” air into the system. This known volume was then pushed through the tubing so that it was approximately 1 cm below the vial, completely filling the vial, and a few centimeters above the vial. The tubing was continuously checked throughout the process to assure that the least amount of residual liquid possible was left behind in the tubing. According to the ratio of residue to total volume pushed through the tubing, it was estimated that far less than 1% of the original volume remained adhered to the inner tubing surface. The levels of solution below and above the vial were marked as marks A and B, respectively, and were considered to contain the known volume, V0, between them. The fluid levels between marks A and B were measured to a ±0.5 mm accuracy, which reflects an error value even less than that caused by the above saline-residue error. This volume was considered the “empty vial” volume since this part of liquid was taken out and was used to determine the volume of LP tissue in successive experiments, as shown in Fig. 1a.
The tissue sample was then weighed on an electronic balance (SPE123, Ohaus Corporation, Pine Brook, NJ) accurate to 0.001 g, and immediately placed into the vial, soon to contain the new volume of saline, VN. A new volume of liquid (VN) was pumped into the upper 1.5 m of tubing, and the volume of this solution was calculated by measuring the height of the new column, and utilizing the known diameter of the tubing, as shown in Fig. 1b. This volume was then pushed through the vial containing the excised LP tissue until the lower level of the fluid was exactly level with mark A. The liquid level above mark B was measured and used to compute VA, or the volume of saline above mark B [Fig. 1c]. VA includes the contribution from the tissue volume (VLP) and the volume difference of VN−V0. From the measured V0, VA, and VN, we can thus obtain the tissue sample volume VLP by using the relationship
| (1) |
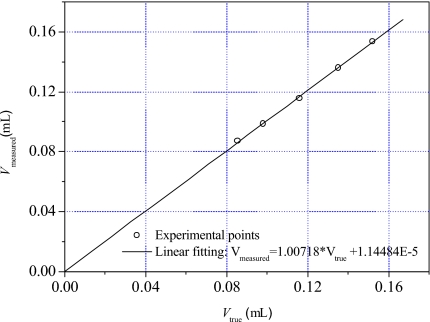
In order to examine the accuracy of the volume measurement by liquid-displacement method, we used pieces of 99.99% pure copper with the density of 8.92 g∕ml as test samples. Five small pieces of copper, all of which fit into the vial without restricting the flow of saline, were weighed with an accuracy of 0.001 g. From their mass and density, we calculated the volumes Vtrue of these copper pieces. The experimental volumes Vmeasured of these copper pieces were measured using the liquid-displacement method. The volume measurement of each copper sample was repeated five times. Figure 2 shows the relationship between Vtrue and the averaged Vmeasured of these copper pieces. The replicated volume measurements for all copper samples have the maximal error of 1.75% from their true values. The measured volumes Vtrue are a very close fit to a linear trend (R=0.99964), indicating a highly accurate volume measurement of small copper pieces.
Figure 2.
The relationship between the actual volume (Vtrue) and the experimentally measured volume (Vmeasured) of the five small copper samples.
Measurement of the volume and mass fractions of liquid and solid in VF lamina propria tissue
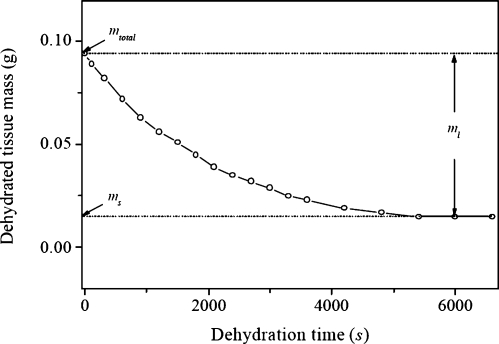
After measurement of the tissue volume VLP, the mass of the tissue sample was measured on the electronic balance. The LP includes both liquid and solid components; therefore, its total hydrated mass was recorded as mLP. The tissue density can be determined as ρLP=mLP/VLP. In order to completely dehydrate the tissue, the tissue samples were left in a vacuum oven (Isotemp Model 280A, Thermo Fisher Scientific, Waltham, MA) heated to 40 °C, and with the pressure lowered to approximately −15 mm Hg. The tissue was kept in the oven until it maintained a constant mass, which was denoted ms or the dried solid component of the lamina propria. The difference between the total mass of the hydrated tissue and the dry solid component mass represents the loss of liquid from the tissue, allowing the mass of the liquid component to be computed as ml=mLP−ms. We define the solid mass fraction as the fraction of the total mass represented by the solid mass and the liquid mass fraction as the fraction of the liquid mass of the total tissue mass. From the measured ms and mLP, we then can determine and as
| (2) |
Furthermore, the porous VF LP tissue was immersed in the physiological saline, which mimics the density and osmolarity of liquid in the tissue. The physiological saline as a bathing solution is considered to be isotonic to the tissue, thus preventing a net osmotic diffusion of water into or out of the tissue. Since the tissue can be viewed as in equilibrium with the saline, we can assume that the liquid density ρf sufficiently approached the density 1.004 g∕ml of the saline solution. We then can obtain the liquid volume as Vl=(mLP−ms)/ρf. The difference between the total volume and the fluid volume gives the solid volume as Vs=VLP−Vl. Similarly, we define the solid volume fraction as the fraction of solid volume versus total volume and the liquid volume fraction as the percent of the total volume occupied by the liquid phase. Thus, from the measured ms, mLP, and the total volume VLG of the lamina propria, we can determine and as
| (3) |
Clearly, these parameters are defined such that and . During the experiment, the volume measurement was repeated on each tissue sample three times to ensure consistency in computing these parameters. The average variation of these measurements was 2.85% of the total tissue volume. The masses (ml,ml) and volumes (Vs,Vl) of the eight VF LP samples from four excised larynges were measured in order to compare the results of liquid and solid components for each parameter.
RESULTS
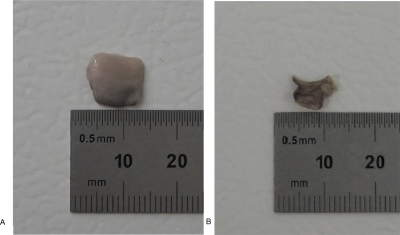
Figure 3 shows the typical results of the solid and liquid masses of a VF LP tissue. Before dehydration, using the electronic balance and liquid-displacement method, the total mass mLP and volume VLP of the LP tissue were measured as 0.094 g and 0.090 m, respectively. The tissue density ρLP can be estimated as 1.044 g∕m. After a thorough dehydration of the tissue, its mass approached a constant, as shown in Fig. 4, and thus the solid and liquid masses can be obtained as ms=0.015 g and ml=0.079, respectively. The liquid and solid volumes were estimated as Vl=0.079 ml and Vs=0.011 ml, respectively. Figures 4a, 4b illustrate the tissue sample before and after the complete dehydration. It can be seen that the dehydration sufficiently decreased the tissue volume. Based on Eqs. 2, 3, we can determine the solid and liquid fraction parameters of this tissue as , , , and .
Figure 3.
The estimated solid and liquid masses of a VF LP tissue during dehydration.
Figure 4.
A tissue sample before (a) and after (b) dehydration.
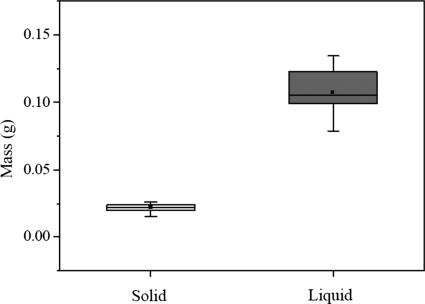
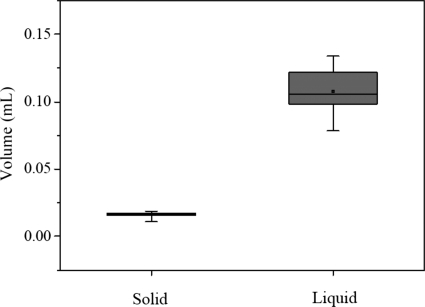
Using the same procedure, we obtained the solid and liquid fraction parameters of all eight tissue samples harvested from the four larynges used for the experiment. Figure 5 shows the distribution of the solid mass ms and the liquid mass ml. Mean values of ms and ml were estimated as 0.023 g and 0.111 g. Figure 6 shows the distributions of the solid volume Vs and the liquid volume Vl. The liquid volume with the mean value 0.111 ml was sufficiently higher than the solid volume with the mean value of 0.017 ml. Based on Eqs. 2, 3, the fraction parameters , , , and can be obtained, as summarized in Table 1. The mean value of the liquid mass fraction was 83.0%, which is sufficiently higher than that of the solid mass fraction (17.0%). The liquid volume fraction of 86.7% was higher than the solid volume fraction of 13.3%.
Figure 5.
The distributions of the solid and liquid masses from eight tissue data pieces excised from four larynges, where the line inside the box marks the median, and the upper and lower lines show maximum and minimum values. Error bars represent 10th and 90th percentiles.
Figure 6.
The distributions of solid and liquid volumes, from eight tissue data pieces excised from four larynges, where the line inside the box marks the median, and the upper and lower lines show maximum and minimum values. Error bars represent 10th and 90th percentiles.
Table 1.
Comparisons of solid and liquid groups on mass and volume fractions from eight tissue data pieces excised from four larynges, where the parameter values are given for each group (mean±standard deviation).
| Solid | Liquid | |
|---|---|---|
| Mass fraction ϕm (%) | 17.0±0.92 | 83.0±0.92 |
| Volume fraction ϕV (%) | 13.3±1.46 | 86.7±1.46 |
DISCUSSION
Past studies on articular cartilage have used the buoyancy (sink-float) procedure to measure the density of small tissue samples, which can be used to calculate volume (Lipshitz et al., 1976). However, this procedure requires an equilibrated solution of specific concentration, pH, and temperature, making it difficult to control for the permeable nature of the VF tissue in varied osmotic environments. Since the tissue would need to be submerged in a solution for this sink-float procedure, there may be a net diffusion of water, making an accurate volume measurement difficult. Other procedures used to measure large tissue volumes include ultrasound technology (Hornblower et al., 2007) and magnetic resonance imaging (Steen et al., 2007), but these require relatively expensive equipment, and may be inconvenient for the measurement of VF samples with a small volume. To overcome the limitations of these methods, we have applied a liquid-displacement method to directly measure the small tissue volume of LP tissue. The current apparatus (Fig. 1) provides an inexpensive and simple way to measure small tissue samples. Differing from the buoyancy procedure, the liquid-displacement method allows the properties of the tissue to be conserved in a physiologic solution. In addition, as shown in Fig. 2, the linear relation and small deviation between the actual Vtrue and measured Vmeasured copper volumes showed the accuracy of the liquid-displacement apparatus and methodology. The precision of the apparatus in measuring copper samples allowed us to take the volume measurements in samples as small as 0.085 ml.
We measured the mean density of eight LP tissue samples as 1.049 g∕ml, which is close to the density of the vocalis muscle reported in investigations by Perlman et al. (1984). Such a close relationship between LP density and vocal muscle density has also been used in recent studies of ultrasonic measurement (Huang et al., 2007) and computer modeling of VF tissue (Titze and Hunter, 2004; Jiang et al., 2001; Alipour et al., 2000). The relative density difference ∣ρsa−ρLP∣/ρLP between the saline solution and the LP tissue was less than 4%. This implies that errors in determining the liquid density ρf and other fraction parameters may be less than 4%. However, error values this small are much less than the differences between the liquid and solid fraction parameters, since the liquid fraction parameters are at least five times larger than the solid fraction parameters, as shown in Fig. 6.
Limitations in our study resided in the number and type of larynges used. Our preliminary estimations are based on eight tissue samples from four distinct larynges which is not a large enough data set. Yet these estimations are still of value since they indicate a substantial difference in the currently assumed liquid and volume fractions. However, a greater number of laryngeal measurements will be included in our future studies. Another limitation in our study is that our in vitro estimations may not be the best representation of the dynamic relationship between the fluid and solid phases of the in vivo laryngeal system.
The VF LP tissue can be thought of as a porous solid structure swollen by fluid. The solid structure is comprised of collagen, elastin, and proteoglycans. Collagen is a fibrous structural protein and elastin is the other main structural protein. Highly branched proteins, called proteoglycans, fill a large amount of the superficial layer juxtaposed with the other fibrous proteins. The fibrous units form a cohesive porous composite solid phase in VF lamina propria. VF solid structure allows for a large amount of liquid storage and permeable flow. For example, hyaluronic acid is one component that can attract and hold water within the LP forming large, space-filling aggregates. Tissue solid components interact with the liquid regulating its distribution and flow. Homogeneous, solid descriptions of the VF tissue have primarily been applied in previous lumped mass and continuum models (Titze and Hunter, 2004; Jiang et al., 2001; Alipour et al., 2000). These single phase solid models are inadequate in describing the intrinsic solid-liquid interaction in the VF tissue and phenomena such as tissue stress relaxation. The consideration of the liquid contribution in VF models may be important for better understanding the viscoelastic behavior of VF lamina propria.
We recently proposed a biphasic model of VF LP tissue to describe the solid-liquid interaction (Zhang et al., 2008). The biphasic theory predicts the stress relaxation of the LP and the crucial role of the liquid in stress support. However, there is no published research on the solid-liquid ratio of VF tissue, so the solid and liquid volume fractions ( and ) from the articular cartilage system (Mow et al., 1980, 1984) were used in that study. In this study, by developing an apparatus which allows the volume measures of solid and liquid components, we provided preliminary experimental measurements of the biphasic (solid-liquid) parameters of LP tissue. In Table 1, the mean liquid volume fraction and solid volume fraction of eight tissue samples harvested from four larynges were estimated as 86.7% and 13.3%, respectively. The lower in articular cartilage may be associated with differences in solid component composition. The amount or distribution of solid phase components holding water in the tissue could relate to differences in articular and VF . Biomechanical properties of VF tissue are fundamental factors affecting VF vibration and voice production (Chan et al., 2001). Our study investigated the biomechanical property of VF LP tissue by measuring its biphasic parameters, which may provide useful information for understanding the VF vibratory systems.
CONCLUSION
In this study, we have measured the liquid and solid component parameters in canine VF lamina propria. A volume displacement apparatus was used to determine the volume of the VF LP tissue. The volume measurement of small copper samples examined the accuracy of the experimental apparatus. Using eight LP tissue samples, we found that the mass and volume of the liquid component in VF LP tissue were sufficiently higher than those of the solid component. Average mass and volume fractions of the liquid component were estimated as 83.0% and 86.7%, respectively, which are sufficiently higher than 17% and 13.3% of the solid mass and volume fractions. Liquid represents the major composition of the VF LP tissue. The results showed preliminary experimental evidence for the biphasic property (solid-liquid) of LP tissue. The estimated biphasic parameters may serve as crucial parameters for future theoretical as well as experimental investigations exploring the viscoelastic behaviors controlling the vibratory motion of VF LP tissue.
ACKNOWLEDGMENTS
This study was supported by NIH Grant No. 1-RO1DC05522 from the National Institute on Deafness and other Communication Disorders.
References
- Alipour, F., Berry, D. A., and Titze, I. R. (2000). “A finite-element model of vocal-fold vibration,” J. Acoust. Soc. Am. 10.1121/1.1324678 108, 3003–3012. [DOI] [PubMed] [Google Scholar]
- Chan, R. W., and Titze, I. R. (2003). “Effect of postmortem changes and freezing on the viscoelastic properties of vocal fold tissues,” Ann. Biomed. Eng. 10.1114/1.1561287 31, 482–491. [DOI] [PubMed] [Google Scholar]
- Chan, R. W., Gray, S. D., and Titze, I. R. (2001). “The importance of hyaluronic acid in vocal fold biomechanics,” Otolaryngol.-Head Neck Surg. 10.1067/mhn.2001.115906 124, 607–614. [DOI] [PubMed] [Google Scholar]
- Chan, R. W., and Tayama, N. (2002). “Biomechanical effects of hydration in vocal fold tissues,” Otolaryngol.-Head Neck Surg. 10.1067/mhn.2002.124936 126, 528–537. [DOI] [PubMed] [Google Scholar]
- Chan, R. W., and Titze, I. R. (2000). “Viscoelastic shear properties of human vocal fold mucosa: Theoretical characterization based on constitutive modeling,” J. Acoust. Soc. Am. 10.1121/1.428354 107, 565–580. [DOI] [PubMed] [Google Scholar]
- Hornblower, V. D. M., Yu, E., Fenster, A., Battista, J. J., and Malthaner, R. A. (2007). “3D thoracoscopic ultrasound volume measurement validation in an ex vivo and in vivo porcine model of lung tumours,” Phys. Med. Biol. 10.1088/0031-9155/52/1/007 52, 91–106. [DOI] [PubMed] [Google Scholar]
- Huang, C., Sun, L., Dailey, S. H., Wang, S., and Shung, K. K. (2007). “High frequency ultrasonic characterization of human vocal fold tissue,” J. Acoust. Soc. Am. 10.1121/1.2756759 122, 1827–1832. [DOI] [PubMed] [Google Scholar]
- Jiang, J., Verdolini, K., Aquino, B., Ng, J., and Hanson, D. (2000). “Effects of dehydration on phonation in excised canine larynges,” Ann. Otol. Rhinol. Laryngol. 109, 568–575. [DOI] [PubMed] [Google Scholar]
- Jiang, J. J., and Titze, I. R. (1993). “A methodological study of hemilaryngeal phonation,” Laryngoscope 10.1288/00005537-199308000-00008 103, 872–882. [DOI] [PubMed] [Google Scholar]
- Jiang, J. J., Zhang, Y., and Stern, J. (2001). “Modeling of chaotic vibrations in symmetric vocal folds,” J. Acoust. Soc. Am. 10.1121/1.1395596 110, 2120–2128. [DOI] [PubMed] [Google Scholar]
- Lipshitz, H., Etheredge, R., and Glimcher, M. (1976). “Changes in the hexosamine content and swelling ratio of articular cartilage as functions of depth from the surface,” J. Bone Joint Surg. Am. 58, 1149–1153. [PubMed] [Google Scholar]
- McCutcheon, S. C., Martin, J. L., and Barnwell, T. O. (1993). “Water quality,” in Handbook of Hydrology, edited by Maidment D. R. (McGraw-Hill, New York: ), p. 11.3. [Google Scholar]
- Mow, V. C., Holmes, M. H., and Lai, W. M. (1984). “Fluid transport and mechanical properties of articular cartilage: A review,” J. Biomech. 10.1016/0021-9290(84)90031-9 17, 377–394. [DOI] [PubMed] [Google Scholar]
- Mow, V. C., Kuei, S. C., Lai, W. M., and Armstrong, C. G. (1980). “Biphasic creep and stress relaxation of articular cartilage in compression: Theory and experiments,” J. Biomed. Eng. 102, 73–84. [DOI] [PubMed] [Google Scholar]
- Perlman, A. L., Titze, I. R., and Cooper, D. S. (1984). “Elasticity of canine vocal fold tissue,” J. Speech Hear. Res. 27, 212–219. [DOI] [PubMed] [Google Scholar]
- Steen, R. G., Hamer, R. M., and Lieberman, J. A. (2007). “Measuring brain volume by MR imaging: Impact of measurement precision and natural variation on sample size requirements,” AJNR Am. J. Neuroradiol. 28, 1119–1125. [DOI] [PMC free article] [PubMed] [Google Scholar]
- Titze, I. R., and Hunter, E. J. (2004). “Normal vibration frequencies of the vocal ligament,” J. Acoust. Soc. Am. 10.1121/1.1698832 115, 2264–2269. [DOI] [PMC free article] [PubMed] [Google Scholar]
- Verdolini, K., Min, Y., Titze, I. R., Lemke, J., Brown, K., Mersbergen, M., Jiang, J. J., and Fisher, K. (2002). “Biological mechanisms underlying voice changes due to dehydration,” J. Speech Hear. Res. 45, 268–281. [DOI] [PubMed] [Google Scholar]
- Verdolini, K., Titze, I. R., and Fennell, A. (1994). “Dependence of phonatory effort on hydration level,” J. Speech Hear. Res. 37, 1001–1007. [DOI] [PubMed] [Google Scholar]
- Zhang, Y., Czerwonka, L., Tao, C., and Jiang, J. J. (2008). “A biphasic theory for the viscoelastic behaviors of vocal fold lamina propria in stress relaxation,” J. Acoust. Soc. Am. 10.1121/1.2831739 123, 1627–1636. [DOI] [PubMed] [Google Scholar]


