

Abstract
The growth factor, transforming growth factor-alpha (TGF-α) is strongly expressed in the hypothalamic circadian pacemaker, the suprachiasmatic nucleus (SCN). TGF-α is one of several SCN peptides recently suggested to function as a circadian output signal for the regulation of locomotor activity rhythms in nocturnal rodents. When infused in the brain, TGF-α suppresses activity. TGF-α suppresses other behaviors as well including feeding, resulting in weight loss. Elevated TGF-α is correlated with some cancers, and it is possible the TGF-α and its receptor, the epidermal growth factor receptor (EGFR), mediate fatigue and weight loss associated with cancer. If true for cancers outside of the brain, then systemic TGF-α should also affect behavior. We tested this hypothesis in hamsters with intraperitoneal injections or week-long subcutaneous infusions of TGF-α. Both treatments suppressed activity and infusions caused reduced food consumption and weight loss. To identify areas of the brain that might mediate these effects of systemic TGF-α, we used immunohistochemistry to localize cells with an activated MAP kinase signaling pathway (phosphorylated ERK1). Cells were activated in two hypothalamic areas, the paraventricular nucleus and a narrow region surrounding the third ventricle. These sites could be targets of TGF-α produced in the SCN but could also mediate effects of elevated TGF-α from tumors both within and outside the central nervous system.
Keywords: circadian, suprachiasmatic, cachexia, EGF, TGF-α, paraventricular nucleus
1. INTRODUCTION
Circadian rhythms are regulated by the suprachiasmatic nucleus (SCN) located in the anterior, ventral hypothalamus just above the optic chiasm [17]. The SCN receives direct retinal innervation that mediates entrainment to light/dark cycles and it is anatomically situated to influence functions such as autonomic tone, neuroendocrine activity, and vigilance states. Despite robust rhythms in these and other functions, the output mechanisms by which the SCN regulates diverse functions are not well understood. SCN efferents, primarily to other hypothalamic, thalamic areas, and basal forebrain areas have been described[21, 48], [20], and synaptic circuits for some functions have been proposed [1, 15], [4, 8, 28]
Synaptic communication via projection axons is likely to be essential for most output functions of the SCN. Evidence suggests, however, that SCN output also includes modulation of downstream targets by paracrine factors. Transplantation of the SCN into the third ventricle of an SCN-ablated, arrhythmic host restores wheel-running rhythmicity [22, 35] even when the graft is enclosed in a polymer capsule [41]. The restoration of rhythms by SCN grafts is likely to involve a molecule or molecules that are inhibitory to activity [47]. Recently, four SCN peptides have been shown to inhibit locomotor activity when infused into the third ventricle [3, 18, 19, 42]. Although these peptides are good candidates for SCN output signals, it has yet to be established that any of them are normally secreted by the SCN to control the timing of an animal’s daily activity. Furthermore, the specific targets that mediate the behavioral effects of these peptides have not been established.
Transforming growth factor-alpha (TGF–α) was the first of these peptides to be reported as a candidate output signal of the SCN [18]. It is expressed in the SCN [13, 18, 23, 24, 27], and intracereboventricular (ICV) infusions, both chronic and acute, reversibly inhibit wheel-running activity without affecting the period or phase of the underlying circadian pacemaker [18, 42]. TGF–α is structurally related to epidermal growth factor (EGF), which was also shown to suppress wheel-running activity [18]. This and the behavior of mice with a hypomorph mutation in the epidermal growth factor receptor (EGFR) led to the suggestion that the EGFR (also called ErbB-1) mediated the inhibition of wheel-running behavior, either the daily inhibition of activity that is part of circadian regulation or the acute inhibition of activity caused by light (negative masking) [18]. In a subsequent study it was found that mice with the EGFR mutation did not show a behavioral phenotype different from wildtype mice [29]. The reason for different findings in two studies is presently unclear, but the possibility that several SCN peptides inhibit activity may make it difficult to demonstrate the physiological role of any one of them.
The initial report of TGF–α as a candidate output signal described an effect of TGF–α on wheel-running activity. The circadian modulation of sleep and wakefulness was also disrupted by TGF–α but the relative amounts of these states were reported to be unchanged [18]. Since then the effect of TGF–α on other behaviors has been assessed [42]. ICV infusions of TGF–α caused a general suppression of active behaviors including feeding, leading to weight loss. The effects of TGF–α resembled in some respects those previously described for cytokines, such as interleukin-1, and characterized as “sickness behavior” [7]. Sickness behavior is thought to be a physiological and adaptive response to disease, infection, or injury [16]. It is likely that the mechanisms of sickness behavior involve hypothalamic mechanisms that in the healthy animal control processes such as activity, feeding, and temperature regulation.
TGF–α produced in the SCN, and the hypothalamic targets of TGF–α might normally be involved in the regulation of behavior, but in addition, when overproduced or administered experimentally might act on the same systems to cause effects similar to sickness behavior; TGF–α might normally be a mediator of sickness behavior. Fatigue and weight loss (cachexia) are common symptoms of cancer and some cancers overproduce TGF–α and its receptor [2, 5, 12, 43, 44, 50]. In a recent study, fatigue and loss of appetite were correlated with elevated blood levels of TGF–α in patients with colon cancer [36]. If tumors outside of the central nervous system affect behavior through TGF–α, then TGF–α should have behavioral effects when given systemically to animals. In previous studies, TGF–α was infused into the brain, and although TGF- is thought to not cross the blood brain barrier [32], specific access to the hypothalamus has not been examined. The goal of the present study was to determine whether systemic TGF–α affects behavior. In addition, the possible activation of hypothalamic targets by TGF–α was evaluated. The present findings suggest that EGFR signaling in the hypothalamus could be a target for the therapeutic treatment of disease symptoms.
MATERIALS AND METHODS
Acute injections
Ten male Syrian hamsters (Mesocricetus auratus, LVG, Charles River Laboratories, Kingston, NY) were housed in cages with running wheels on a 14:10 LD cycle in light-tight boxes with forced ventilation. Food and water were continuously available. The light source was a single 40-in. fluorescent tube, about 50 cm above cage tops. Wheel turns were registered by a micro-switch on each cage and recorded using ClockLab (ActiMetrics, Evanston, IL).
Each hamster received six injections 2-3 days apart, each with a different dose of TGF-α (0, 0.44, 0.88, 1.75, 3.5, or 7 μg/injection). The order of injections was randomly assigned for each hamster. An injection volume of 0.35ml (sterile saline) was given intra-peritoneally (IP) 30 minutes before lights-out.
The effect of TGF-α was measured by analyzing the amount of activity in a two-hour window beginning 30 minutes after lights-off (lights off is the approximate time of activity onset and is designated Zeitgeber Time, or ZT, 12). The amount of activity on the day of injection (within the predetermined window) was measured against activity during the same time on the day before (baseline). The level of activity on the day of injection was expressed as a percentage of the baseline day.
Chronic infusions
Eighteen male hamsters in three experiments of six hamsters each (LVG, Charles River Laboratories, Kingston, NY) were kept in running wheel cages on a 14:10 LD cycle with food and water continuously available. After two weeks the hamsters were anesthetized with sodium pentobarbital (100 mg/kg, IP) for implantation of osmotic mini-pumps (Alzet model 1007D, 100 μl reservoir, 0.5μl/hr delivery, Durect Corp, Cupertino, CA). Fur was trimmed dorsally between the shoulder blades to make a 1 cm incision in the skin. Using large forceps, a pathway was created under the skin, down the animal’s back so that the pump could be placed some distance from the incision. The incision was closed with wound clips. Hamsters were allowed to recover in their cages before returning the cage to the recording room.
On the day of surgery, cages were changed and all food was removed from cage tops. A pre-weighed amount of food (approximately 100g) was placed in the cage itself. Hamsters were weighed immediately post-surgery. One week following surgery, both the hamsters and food were weighed to determine the amount of food consumed and amount of weight lost or gained by each hamster.
Pumps were filled as described by the manufacturer. In each of three experiments three pumps contained TGF-α (Recombinant Human TGF-α, R&D Systems, Minneapolis) and three contained vehicle only. TGF-α was initially dissolved in a stock solution containing 10mM acetic acid, and 0.1% bovine serum albumin (BSA) at a concentration of 2μg/μl and subsequently diluted with sterile saline to obtain the different doses used in the three experiments (0.2μg/μl, 0.5μg/μl and 1.0μg/μl). Vehicle contained both the stock solution and sterile saline (1:1). The pumps were designed to release 100 μl at 12 μl/day for approximately 8 days. The three doses received were therefore 0.1, 0.25, and 0.5 μg/hour/animal.
Locomotor activity was analyzed in three sections of the experiment: pre-surgery, during TGF-α release (days 2-7 after surgery), and post TGF-α release (days 15-19 after surgery). Activity profiles were created by averaging the five days in each section. The average daily activity thus obtained for an individual hamster was averaged with other hamsters in the same group (defined by dose). A total of nine hamsters (3 in each experiment) received vehicle only, and the values for all nine were averaged.
P-ERK Immunohistochemistry
Male hamsters were housed in cages with running wheels on L:D 14:10 with food and water continuously available. In sets of two or four, hamsters were moved from the main holding room into light tight boxes with forced ventilation, and placed in constant dim red light. Hamsters were moved into dim red light three days before the day of injections and perfusions, and their running wheels were connected to the recording system. The hamsters were moved into dim red light to avoid the possibility that the bright light of the L:D cycle would cause P-ERK expression thereby masking any effect of EGF receptor activation.
Injections of TGF-α, EGF, or saline were given 30 minutes before the time of original lights-off (approximately 30 minutes before activity onset, CT11.5). All of the hamsters showed highly regular activity onsets. Hamsters that received TGF-α or EGF failed to show the predicted onset of activity on the day of the injection (confirming the acute effect of EGF receptor activation on behavior). In contrast, the hamsters that received saline showed the expected onset of activity prior to sacrifice and perfusion. Hamsters were always moved through the experiment in pairs. One hamster of each pair received an IP injection containing TGF-α or EGF (R&D Systems, 7 μg in 0.35ml) the other received saline only. Importantly, an experimental and a control hamster were always processed through immunohistochemistry together. Hamsters were perfused 1-1.5 hours after the injections.
For perfusion, hamsters were first anesthetized with sodium pentobarbital (150 mg/kg) in dim red light. When anesthetized, a black hood was placed over the head to minimize light exposure during perfusion. Hamsters were perfused with ice cold saline followed by 75ml of ice cold Zamboni’s fixative (0.4 %paraformaldehyde, 15% saturated picric acid. pH 7.4). The brains were promptly removed and placed in Zamboni’s fixative overnight. The following day, brains were transferred to a 20% sucrose solution (in PBS) for cryoprotection over night. Frozen 40μm sections were cut into PBS, washed in PBST (0.1% tritonx, 2×10 min), and then blocked with 0.3% hydrogen peroxide in PBS for 30 minutes. The sections were washed in PBST (3×5 min), blocked with gelatin (0.3% in PBST) for 2 hours, and incubated with primary antibody (1:400 in gelatin solution, Phospho-p44/42 MAPK, Mouse mAb, Cell Signaling Technology, Danvers, MA), overnight at room temperature. This antibody was previously used in hamsters to detect P-ERK [6] and we validated the reported staining in the SCN (see Results). Sections were washed in PBST (3×20 min) before a 1-hour incubation with secondary antibody (Goat Anti-Mouse IgG, Chemicon, 1:500 in gelatin solution). Sections were washed in PBST (3×5 min) and incubated in an avidin-biotin peroxidase complex (ABC kit, Vector Labs) for 60 minutes. After one final wash in TrisBS-T (3×5 min), sections were incubated with DAB (Vector Laboratories, 1/4 manufacturer recommended concentration). Finally, sections were mounted (in TBS) on to gelatin-coated slides, dried, and cover slipped with Permount.
Sections were analyzed for differences in staining of P-ERK in the SCN and other hypothalamic areas that showed staining, specifically the supraoptic nucleus (SON), paraventricular nucleus (PVN) and a narrow region surrounding the third ventricle (peri-V3). A single section per structure was analyzed in each hamster. A total of 10 hamsters received TGF-α, 4 received EGF and 12 received saline only. Staining was quantified using Image J (National Institutes of Health). A contrast threshold was applied to images in order to highlight immunostained cells identified by subjective criteria. The highlighted staining was subjected to a particle count procedure in which only specified-sized objects were included in the calculation of the total area stained. The total stained area for a particular structure was then averaged across the animals within a group and the groups were compared using Student’s t-test. Because the pattern of staining was identical in hamsters that received TGF-α or EGF these groups were combined for statistical comparisons of stained areas.
Light was previously shown to increase P-ERK in the SCN [6, 30]. Therefore, as a positive control for immunohistochemistry, a separate set of hamsters was given a one-hour light pulse, one hour after lights-off. Hamsters were perfused immediately at the end of the one hour-light pulse. To confirm that the red light used during TGF-α injections did not increase P-ERK, animals with exposure to dim red light only, were perfused at the same time as the light-exposed hamsters.
RESULTS
Acute Injections
Eight male hamsters each received five doses of TGF-α and a control injection of vehicle only (saline). Figure 1 shows a representative actogram from one hamster over the course of the experiment. Symbols are placed on the days of injections, and the type of symbol indicates the dose (see legend).
Figure 1.

The wheel–running activity record of a hamster entrained to a 14:10 light:dark cycle (rectangle at bottom). Each line of the record is 24 hours of recording and sequential days are plotted one below the other. The dark areas are the times when the hamster is active. The hamster received 6 intraperitoneal injections on the days and times indicated by the symbols. Each injection contained a different dose of TGF-α The suppression of activity by TGF-α is illustrated by the reduced activity after injection of the largest dose (open circle). Note that activity returned later in the same night after it was suppressed. The injection without TGF-α (open triangle) had no effect on activity (doses: closed square = 0.44 μg/injection, open square = 1.75 μg/injection, closed circle = 3.5μg/injection, open circle = 7 μg/injection, closed triangle = 0.88 μg/injection, open triangle = control).
As summarized in Figure 2, injections of TGF-α caused a suppression of activity when compared to saline alone. The two highest doses caused a significant suppression of activity relative to controls (see legend). Although not statistically significant, the means for the two lowest doses were both lower than the control mean. At both doses this appeared due to a single hamster that showed an almost complete absence of activity following the injection. It was not the same hamster in both instances and other hamsters also appeared to show some response to the lowest dose. For example, the hamster of Fig. 1 appeared to show a response to the lowest dose (closed square) even though on another day the same hamster did not show an obvious response to the third highest dose (open square). Thus there appears to be considerable variability in the response to TGF-α that is not related to the dose administered. Some of the variability might have come from the order of injections. The order was randomized for each hamster so that within each dose some injections were given early and some later in the series. Injections given early tended to have a greater effect than injections given later, for example, the first injection had an effect that was 117% of the average effect for the matching dose while the last injection had 82% of the average effect of the relevant dose. When the data were grouped according to injection order and expressed relative to the average effect of a particular dose, the overall variation was significant (ANOVA, F=2.9, df = 47, P<0.05). Because the order of doses was different within each animal the small order effect did not cause the dose dependent effect, but rather added to its variability.
Figure 2.

The effect of TGF-α on activity (1-3 hours after injection, see Methods) expressed as a percent of the activity on the day preceding an injection. Each symbol is the average of 8 hamsters and vertical lines represent standard errors. A one-way repeated measures analysis of variance (ANOVA) showed overall significance (F=5.3, df=47, P<0.01), and Newman-Kuels post-hoc analysis shows significance between the highest dose and the control (P<0.001), between the highest dose and the middle dose (P<0.01), and between the second highest dose and the control (P<0.05). Doses (μg/injection): 0, 0.44, 0.88, 1.75, 3.5, 7.
Chronic Infusions
Hamsters with surgically implanted osmotic mini-pumps containing TGF-α showed reduced activity during the release of TGF-α (Fig. 3). Activity during five days of pump infusion was compared to, and expressed as a percentage of the five days prior to surgery (baseline). These data are summarized in the top panel of Figure 4. The only dose that had a significant effect, compared to saline alone, was the highest dose (0.5μg/hour/hamster). Hamsters given this dose ran only 28% of the amount on the five days before surgery. In contrast, saline hamsters ran 115% of the five days before. The highest dose was also significantly different from the lowest dose, which was similar to controls. Activity was also measured over five days beginning 15 days after surgery to assess the return of activity. A one-way ANOVA showed that there was no longer a difference among treatment groups at that time (F=0.43, df=17, P >0.7, data not shown). Fig. 3 illustrates the return of activity in one hamster.
Figure 3.

The wheel –running activity record of a hamster entrained to a 14:10 light:dark cycle (rectangle at top). TGF-α (0.5 μg/hour) was continuously infused subcutaneously via osmotic mini-pump for approximately 7 days (vertical bar). Activity was suppressed during the infusion but returned after.
Figure 4.

The effects of different doses of TGF-α (0.1, 0.25, and 0.5 μg/hour/animal) infused for seven days on activity (% of activity before infusions), food consumption (grams/week), and change in body weight (grams/week). The symbols represent average values and vertical lines standard errors. The average values for infusions with vehicle only are based on 9 hamsters and all other averages are based on 3 hamsters/dose. All three measures showed significant differences across dose. (ANOVA: Activity – F=6.08, df=17; Food Consumed – F=5.04, df=17; Weight Loss – F=6.0, df=17; P< 0.02, *P<0.05 vs vehicle-only or the lowest dose, Newman-Kuels).
The amount of food consumed by the hamsters was reduced by the systemic infusion of TGF-α (Figure 4, middle panel). The amount of food consumed by hamsters receiving the highest dose was significantly less than the amount consumed by control hamsters (P <0.05). At this dose, hamsters (on average) ate only 25.6g of food during the week of infusion, while the hamsters receiving saline alone ate an average of 60.3g during the same time period.
Coinciding with the decline in food consumption was a significant loss of body weight in the group receiving the highest dose of TGF-α (19.3 g vs X in control hamsters). Hamsters receiving the lowest dose of TGF-α did not lose weight, and in the middle dose, one of the three hamsters lost 28g, or 19.5% of its starting weight, thus accounting for the large variance in that group (Figure 4, bottom panel). Although hamsters receiving the largest dose of TGF-α lost weight, the food consumed per gram body weight was still less than that of control hamsters (177 mg/g bw vs. 381 mg/g bw, P<0.001, t-test).
Brain activation by TGF-α
Single IP injections of TGF-α, EGF (7 μg in 0.35ml), or vehicle only were given to hamsters approximately 0.5 hours before activity onset (CT11.5). The hamsters were killed for histological analysis 1.5 hours later at approximately CT13 (see Materials and Methods). Figure 5 shows the activity record of a hamster that received saline (Fig. 5A) and a hamster that received TGF-α (Fig. 5B). As expected, the former started its activity before sacrifice. Hamsters receiving TGF-α or EGF did not become active, confirming that the expected effect on activity had occurred before the hamsters were killed for analysis.
Figure 5.

Wheel-running activity records of two hamsters, one saline-injected and one injected with TGF-α. The times of injections are shown by arrows. Hamsters given saline only began activity as predicted (A), while those given TGF-α failed to become active (B), indicating an effect of the peptide. Hamsters were anesthetized and perfused approximately 1 hour after the injections (asterisks). Hamsters were transferred to constant dim red light at the start of the records. The previous light/dark cycle is indicated at the top.
Injections of TGF-α or EGF increased immunostaining for P-ERK (relative to control hamsters) in specific areas of the hypothalamus (Fig. 6). This indicates increased activation of the MAPK signaling cascade in those areas. Activation occurred in the paraventricular nucleus (PVN), the posterior paraventricular nucleus (poPVN), and around the margins of the third ventricle (3V). The supraoptic nucleus (SON) showed strong staining in both control and treated hamsters, and even in the areas where P-ERK staining was strongly increased, there was some staining in control hamsters (Fig. 6, A-F). Figure 6, panel F, most clearly shows some amount of staining in the poPVN of a control hamster.
Figure 6.
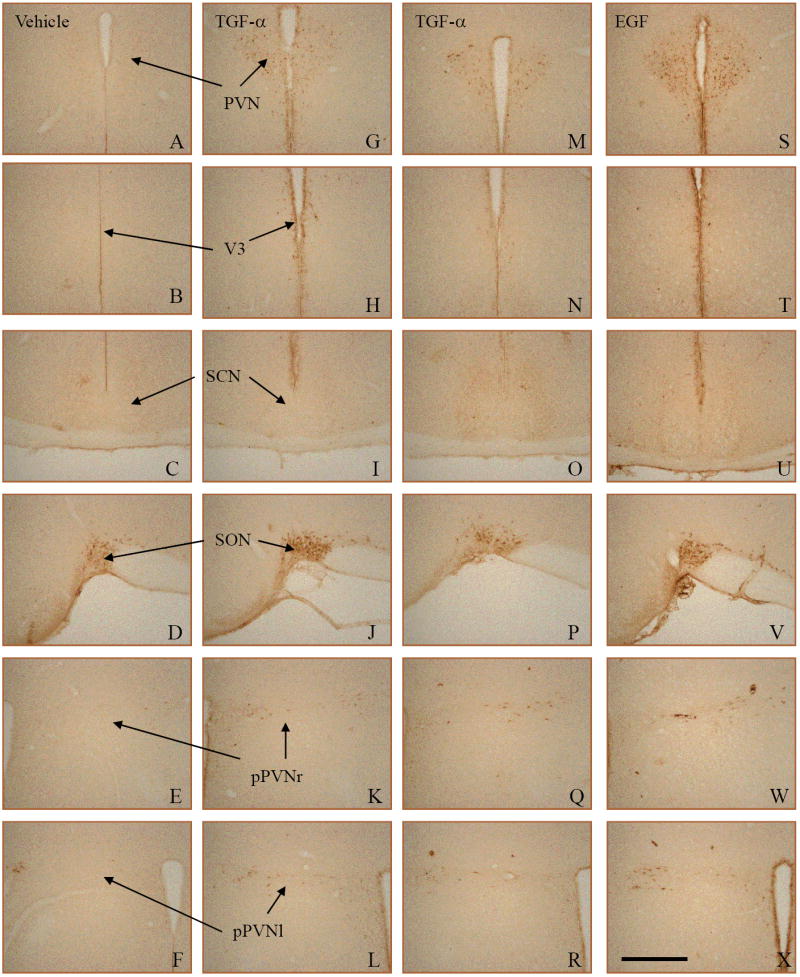
Immunohistochemistry for P-ERK after injections with TGF-α, EGF, or vehicle only (control). Each column of photomicrographs shows sections from a single hamster. Two examples of TGF-α effects (middle columns) are shown to illustrate variability. TGF-α (G-L and M-R) and EGF (S-X) treated animals showed increased PERK in the PVN (G,M,S), around the third ventricle (V3- H,N,T), and in the posterior PVN, both left and ride sides (pPVNr – K,Q,W and pPVNl - L,R,X). There was little to no staining in the SCN in any group (C,I,O,U) and all groups showed staining in the supraoptic nucleus (SON – D,J,P,V). The Scale bar in panel X = 500μm.
Hamsters injected with TGF-α (Fig. 6, G-R) exhibited MAPK activation in the PVN (G, M), poPVN (K, L, Q, R), and 3V margins (H, N) There was almost no staining in the SCN in either control hamsters (C) or hamsters given TGF-α (I, O). EGF-injected hamsters (S-X) displayed the same staining patterns as the TGF-α hamsters.
The quantification of staining (see Materials and Methods) and comparisons between control and treatment groups (Student’s t-test) showed significant differences in the PVN (P <0.05), the poPVN (P <0.002) and the margins of the third ventricle (P <0.0001). Although the staining in the PVN seemed to be most prominent, the third ventricle area was the most consistently different between groups. Neither the SON nor the SCN were significantly different between control and treatment groups (P >0.05).
The staining around the margins of the third ventricle included both cell bodies and processes and may have included cells of the ependyma. It appears, however, that in at least some sections the staining is in a subependymal layer and not in the ependyma itself (arrow in Fig. 8). Stained cell bodies and processes could also be seen in the parenchyma near the ventricle.
Figure 8.
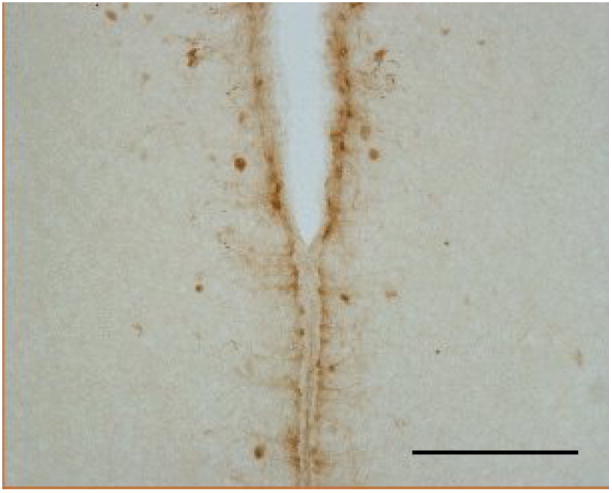
A zone around the third ventricle that was activated by TGF-α is shown at higher magnification than are the examples of Figure 6. Staining appeared to be in both neurons and in processes resembling tanycytes. Scale bar = 250μm
The pattern of P-ERK activation caused by light was different from that caused by TGF-α. As previously reported [6, 30], light caused an increase in P-ERK staining in the SCN (Fig. 9 E and F). The present results show, however, that light did not lead to greater staining in either the PVN or around the margins of third ventricle (Fig. 9, A-D), areas activated by TGF-α and EGF.
Figure 9.

Light exposure one hour after activity onset (CT13) increased P-ERK staining in the SCN. Hamsters receiving a one-hour light pulse are shown on the right (B,D,F), and control hamsters (no pulse, dim red light) on the left (A,C,E). Control hamsters showed little or no staining in the SCN (E), while hamsters exposed to bright light showed an increase in P-ERK (F). In contrast, the areas activated by TGF-α the PVN and the zone around the third ventricle (V3), were not affected by light (D and B). This suggests that TGF-α does not mediate the activation caused by light. Scale bar in panel F = 500 μm.
DISCUSSION
The present results show that systemic TGF-α suppresses wheel-running activity, reduces food consumption, and causes weight loss in hamsters. In addition, specific hypothalamic sites were activated by systemic TGF-α. The EGF receptor family and its ligands have long been known to regulate cell growth and proliferation and to play a role in the etiology of cancer [50]. There has, however, been little consideration given to the possible involvement of the EGF receptor family in behavioral changes associated with cancer. Although it has been proposed that sickness behavior and symptoms associated with cancer, such as fatigue and loss of appetite, share common mechanisms, these mechanisms are most commonly thought to involve inflammatory cytokines [5]. Until recently (see [37]) the EGF receptor family and its ligands have not been generally viewed as mediators of the behavioral changes associated with cancer or other disease.
Although EGF receptor signaling has not received the same attention as inflammatory cytokines in the mediation of sickness behavior, an effect of EGF on feeding behavior has been reported and it was suggested that these effects on feeding contribute to disease symptoms [33, 34]. More recently, Snodgrass-Belt et al. [42] found that the administration of TGF-α or EGF into the brain caused weight loss in hamsters and suggested a causal relationship between the production of these growth factors by tumors and cancer symptoms. At the same time, Rich et al. [36] found correlations between serum levels of TGF-α and loss of appetite and fatigue in colon cancer patients. The behavioral effects of TGF-α or EGF when administered in the brain suggest that these growth factors contribute to symptoms associated with brain tumors. If these growth factors contribute to behavioral changes associated with tumors outside the central nervous system, then their systemic administration, as assessed in the present study, should also have behavioral effects.
The present results show that TGF-α or EGF administered by acute intraperitoneal injections suppress wheel-running activity and that TGF-α administered chronically by subcutaneous pumps also suppresses activity and causes reduced food consumption and weight loss. Together, these results demonstrate that the production of TGF-α or EGF outside of the central nervous system has behavioral effects resembling sickness behavior.
A physiological role for EGF receptor signaling in the regulation of activity and feeding has yet to be established. The high expression of TGF-α mRNA in the hypothalamic circadian pacemaker, the suprachiasmatic nucleus (SCN), suggests that TGF-α is normally produced in an area where exogenously administered TGF-α has behavioral effects [18]. That is, infusions of TGF-α or EGF into the third ventricle near the SCN suppressed activity and food consumption and cause weight loss [42]. The SCN could communicate with other areas around the third ventricle via the cerebrospinal fluid; the SCN is known to release at least one peptide into cerebrospinal fluid (vasopressin) [40] and TGF-α has been measured in human cerebrospinal fluid [46]. In addition, EGF receptors, localized by immunohistochemistry or by in situ hybridization, have been reported in hypothalamic areas around the third ventricle [25, 26]. It has not been demonstrated, however, that the physiological activation of EGF receptors is correlated with behavioral changes or that interference with endogenous signaling has behavioral effects. Mice with a hypomorph mutation of the EGF receptor were found to express excessive activity relative to wild type siblings under certain conditions (the light portion of an LD cycle or during light pulses at night), indicating that EGF receptor signaling normally plays a role in the regulation of activity [18]. This finding could not, however, be repeated by another group [29]. Thus it has yet to be established that the behavioral effects of exogenous TGF-α or EGF administered centrally or in the periphery, mimic physiological effects of endogenously released EGF receptor ligands.
In mice [30] and hamsters [6] light exposure increases P-ERK in the hypothalamus (especially the SCN), consistent with the possibility that TGF-α mediates the suppression of activity caused by light (negative masking). In the present study, however, the patterns of activation by light and by TGF-α were different, suggesting that ERK activation by light is not mediated by TGF-α. In previous studies, however [6, 30], there was a suggestion that light activated ERK around the third ventricle, similar to TGF-α in the present study. Although this was not seen in the present study the possibility that there is some overlap in the activation patterns caused by TGF-α and light cannot yet be excluded. Moreover, it was recently reported that TGF-α mRNA expression in the SCN was increased by light in a diurnal rodent [45].
One way to examine the possible role of EGF receptor signaling in behavior is to locate EGF receptors in the brain. The EGF receptor and TGF-α have been described in many areas of the brain, in both neurons and glia and are thought to be involved in the normal growth and development of the brain, response of the brain to injury, glia/neuron interactions, and the growth of gliomas [10, 14, 49]. Despite the wide distribution of TGF-α and the EGF receptor, the local release of TGF-α from the SCN could act on local targets specific to the circadian regulation of activity. EGF receptor mRNA and protein have been described in the hypothalamus including areas near the SCN that may correspond to the subparaventricular zone (SPZ), an area thought to be important for regulation of activity and for the circadian modulation of feeding [18, 25, 27, 39]. Therefore, TGF-α acting in areas near the SCN could suppress both activity and feeding. No study, however, has specifically analyzed the location of EGF receptors with respect to the SPZ, i.e. quantified cells within an area defined by specific criteria.
In the present study, we identified possible targets of TGF-α by localizing an activated second messenger (the MAP kinase ERK1) in the best known EGF receptor-signaling cascade. Using immunohistochemistry for phosphorylated ERK1 (P-ERK), we identified activated cells in hamsters that showed suppressed activity after a systemic TGF-α injection. Two hypothalamic areas showed activation, the paraventricular nucleus (PVN) and cells close to and surrounding the third ventricle (periventricular region). We did not see activation in the SCN, and in the SON, activation was high with or without treatment. We did not systematically examine the entire brain and did not see any other obvious differences in the hypothalamus.
Two possible outcomes of the P-ERK localization experiment did not occur; widespread activation of ERK because EGF receptors are widely distributed or no activation anywhere because TGF-α could not penetrate the blood brain barrier. Selective activation as we observed, could have resulted from selective penetration of the blood brain barrier. In an analysis of the brain as a whole, TGF-α was found to accumulate in cerebral vasculature but did not enter the parenchyma [32]. In contrast to TGF-α, EGF is thought to rapidly penetrate the blood brain barrier [31]. Nevertheless, we saw no difference in the pattern of activation following TGF-α or EGF. This suggests that activation of selective areas was not related to the blood brain barrier. Why more areas of the brain, including the SCN, were not activated by systemic TGF-α or EGF is unclear. EGF receptors have been reported in the SCN of rats [13, 26] and in slice preparations, the SCN stains for P-ERK that increases after treatment with EGF [11]. It is possible that the preparation of slices affects expression of the EGF receptor and that a similar response would not occur in vivo.
We cannot exclude the possibility that EGF receptor activation by systemic TGF-α or EGF occurs primarily outside the central nervous and that the activation of cells in the hypothalamus is caused by secondary events. For example TGF-α could cause the release of prostaglandins or cytokines from vascular associated cells. These secondary signals could then act on brain targets that innervate the PVN or on the PVN itself [38]. Using FOS expression as an endpoint, the PVN is commonly found to be activated by systemic lipopolysaccharides or cytokines that induce fever [9]. Activation of cells around the third ventricle, as we observed, has not, however, been reported for fever-inducing treatments. It is not known whether TGF-α causes fever. Whether the actions of TGF-α (or EGF) are direct or indirect on hypothalamic targets, the present results show that systemic TGF-α affects behavior and activates those targets.
Figure 7.

In three of the five areas analyzed, P-ERK staining after TGF-α or EGF (open bars, n=14) was significantly greater than those same areas after vehicle only (shaded bars, n=12) (PVN, P<0.05; the third ventricle, P<0.0001; posterior PVN, P<0.002 ; Student’s t-test vs vehicle only). No significant differences in staining were seen in the SON or SCN.
Acknowledgments
The authors thank Dr. Jay McClaughlin for technical advice and Mehgan Cappacioli for assistance. Supported by NIH grant MH068796 to FCD.
Footnotes
Publisher's Disclaimer: This is a PDF file of an unedited manuscript that has been accepted for publication. As a service to our customers we are providing this early version of the manuscript. The manuscript will undergo copyediting, typesetting, and review of the resulting proof before it is published in its final citable form. Please note that during the production process errors may be discovered which could affect the content, and all legal disclaimers that apply to the journal pertain.
References
- 1.Aston-Jones G, Chen S, Zhu YOshinsky ML. A neural circuit for circadian regulation of arousal. Nat Neurosci. 2001;4:732–8. doi: 10.1038/89522. [DOI] [PubMed] [Google Scholar]
- 2.Chakrabarty S, Huang S, Moskal TLFritsche HA., Jr Elevated serum levels of transforming growth factor-alpha in breast cancer patients. Cancer Lett. 1994;79:157–60. doi: 10.1016/0304-3835(94)90254-2. [DOI] [PubMed] [Google Scholar]
- 3.Cheng MY, Bullock CM, Li C, Lee AG, Bermak JC, Belluzzi J, et al. Prokineticin 2 transmits the behavioural circadian rhythm of the suprachiasmatic nucleus. Nature. 2002;417:405–10. doi: 10.1038/417405a. [DOI] [PubMed] [Google Scholar]
- 4.Chou TC, Scammell TE, Gooley JJ, Gaus SE, Saper CBLu J. Critical role of dorsomedial hypothalamic nucleus in a wide range of behavioral circadian rhythms. J Neurosci. 2003;23:10691–702. doi: 10.1523/JNEUROSCI.23-33-10691.2003. [DOI] [PMC free article] [PubMed] [Google Scholar]
- 5.Cleeland CS, Bennett GJ, Dantzer R, Dougherty PM, Dunn AJ, Meyers CA, et al. Are the symptoms of cancer and cancer treatment due to a shared biologic mechanism? A cytokine-immunologic model of cancer symptoms. Cancer. 2003;97:2919–25. doi: 10.1002/cncr.11382. [DOI] [PubMed] [Google Scholar]
- 6.Coogan AN, Piggins HD. Circadian and photic regulation of phosphorylation of ERK1/2 and Elk-1 in the suprachiasmatic nuclei of the Syrian hamster. J Neurosci. 2003;23:3085–93. doi: 10.1523/JNEUROSCI.23-07-03085.2003. [DOI] [PMC free article] [PubMed] [Google Scholar]
- 7.Dantzer R. Cytokine-induced sickness behavior: mechanisms and implications. Ann N Y Acad Sci. 2001;933:222–34. doi: 10.1111/j.1749-6632.2001.tb05827.x. [DOI] [PubMed] [Google Scholar]
- 8.de la Iglesia HO, Meyer JSchwartz WJ. Lateralization of circadian pacemaker output: Activation of left- and right-sided luteinizing hormone-releasing hormone neurons involves a neural rather than a humoral pathway. J Neurosci. 2003;23:7412–4. doi: 10.1523/JNEUROSCI.23-19-07412.2003. [DOI] [PMC free article] [PubMed] [Google Scholar]
- 9.Elmquist JK, Scammell TE, Jacobson CD, Saper CB. Distribution of Fos-like immunoreactivity in the rat brain following intravenous lipopolysaccharide administration. J Comp Neurol. 1996;371:85–103. doi: 10.1002/(SICI)1096-9861(19960715)371:1<85::AID-CNE5>3.0.CO;2-H. [DOI] [PubMed] [Google Scholar]
- 10.Ferrer I, Alcantara S, Ballabriga J, Olive M, Blanco R, Rivera R, et al. Transforming growth factor-alpha (TGF-alpha) and epidermal growth factor-receptor (EGF-R) immunoreactivity in normal and pathologic brain. Prog Neurobiol. 1996;49:99–123. doi: 10.1016/0301-0082(96)00009-3. [DOI] [PubMed] [Google Scholar]
- 11.Hao H, Schwaber J. Epidermal growth factor receptor induced Erk phosphorylation in the suprachiasmatic nucleus. Brain Res. 2006;1088:45–8. doi: 10.1016/j.brainres.2006.02.100. [DOI] [PubMed] [Google Scholar]
- 12.Italiano A. Targeting the Epidermal Growth Factor Receptor in Colorectal Cancer: Advances and Controversies. Oncology. 2006;70:161–167. doi: 10.1159/000093092. [DOI] [PubMed] [Google Scholar]
- 13.Jobst EE, Robinson DW, Allen CN. Potential pathways for intercellular communication within the calbindin subnucleus of the hamster suprachiasmatic nucleus. Neuroscience. 2004;123:87–99. doi: 10.1016/j.neuroscience.2003.08.059. [DOI] [PubMed] [Google Scholar]
- 14.Junier MP. What role(s) for TGFalpha in the central nervous system? Prog Neurobiol. 2000;62:443–73. doi: 10.1016/s0301-0082(00)00017-4. [DOI] [PubMed] [Google Scholar]
- 15.Kalsbeek A, Buijs RM. Output pathways of the mammalian suprachiasmatic nucleus: coding circadian time by transmitter selection and specific targeting. Cell Tissue Res. 2002;309:109–18. doi: 10.1007/s00441-002-0577-0. [DOI] [PubMed] [Google Scholar]
- 16.Kelley KW, Bluthe RM, Dantzer R, Zhou JH, Shen WH, Johnson RW, et al. Cytokine-induced sickness behavior. Brain Behav Immun. 2003;17(Suppl 1):S112–8. doi: 10.1016/s0889-1591(02)00077-6. [DOI] [PubMed] [Google Scholar]
- 17.Klein DC, Moore RY, Reppert SM. Suprachiasmatic nucleus : the mind’s clock. New York: Oxford University Press; 1991. [Google Scholar]
- 18.Kramer A, Yang FC, Snodgrass P, Li X, Scammell TE, Davis FC, et al. Regulation of daily locomotor activity and sleep by hypothalamic EGF receptor signaling. Science. 2001;294:2511–5. doi: 10.1126/science.1067716. [DOI] [PubMed] [Google Scholar]
- 19.Kraves S, Weitz CJ. A role for cardiotrophin-like cytokine in the circadian control of mammalian locomotor activity. Nat Neurosci. 2006;9:212–9. doi: 10.1038/nn1633. [DOI] [PubMed] [Google Scholar]
- 20.Kriegsfeld LJ, Leak RK, Yackulic CB, LeSauter J, Silver R. Organization of suprachiasmatic nucleus projections in Syrian hamsters (Mesocricetus auratus): an anterograde and retrograde analysis. J Comp Neurol. 2004;468:361–79. doi: 10.1002/cne.10995. [DOI] [PMC free article] [PubMed] [Google Scholar]
- 21.Leak RK, Moore RY. Topographic organization of suprachiasmatic nucleus projection neurons. J Comp Neurol. 2001;433:312–34. doi: 10.1002/cne.1142. [DOI] [PubMed] [Google Scholar]
- 22.Lehman MN, Silver R, Gladstone WR, Kahn RM, Gibson M, Bittman EL. Circadian rhythmicity restored by neural transplant. Immunocytochemical characterization of the graft and its integration with the host brain. Journal of Neuroscience. 1987;7:1626–1638. doi: 10.1523/JNEUROSCI.07-06-01626.1987. [DOI] [PMC free article] [PubMed] [Google Scholar]
- 23.Li X, Sankrithi N, Davis FC. Transforming growth factor-alpha is expressed in astrocytes of the suprachiasmatic nucleus in hamster: role of glial cells in circadian clocks. Neuroreport. 2002;13:2143–7. doi: 10.1097/00001756-200211150-00031. [DOI] [PubMed] [Google Scholar]
- 24.Lindley J, Deurveilher S, Rusak B, Semba K. Transforming growth factor-alpha and glial fibrillary acidic protein in the hamster circadian system: daily profile and cellular localization. Brain Res. 2008;1197:94–105. doi: 10.1016/j.brainres.2007.12.053. [DOI] [PubMed] [Google Scholar]
- 25.Ma YJ, Costa ME, Ojeda SR. Developmental expression of the genes encoding transforming growth factor alpha and its receptor in the hypothalamus of female rhesus macaques. Neuroendocrinology. 1994;60:346–59. doi: 10.1159/000126769. [DOI] [PubMed] [Google Scholar]
- 26.Ma YJ, Hill DF, Junier MP, Costa ME, Felder SE, Ojeda SR. Expression of epidermal growth factor receptor changes in the hypothalamus during the onset of female puberty. Mol Cell Neurosci. 1994;5:246–62. doi: 10.1006/mcne.1994.1029. [DOI] [PubMed] [Google Scholar]
- 27.Ma YJ, Junier MP, Costa ME, Ojeda SR. Transforming growth factor-alpha gene expression in the hypothalamus is developmentally regulated and linked to sexual maturation. Neuron. 1992;9:657–70. doi: 10.1016/0896-6273(92)90029-d. [DOI] [PubMed] [Google Scholar]
- 28.Moore RY. Neural control of the pineal gland. Behav Brain Res. 1996;73:125–30. doi: 10.1016/0166-4328(96)00083-6. [DOI] [PubMed] [Google Scholar]
- 29.Mrosovsky N, Redlin U, Roberts RB, Threadgill DW. Masking in waved-2 mice: EGF receptor control of locomotion questioned. Chronobiol Int. 2005;22:963–74. doi: 10.1080/07420520500395086. [DOI] [PubMed] [Google Scholar]
- 30.Obrietan K, Impey S, Storm DR. Light and circadian rhythmicity regulate MAP kinase activation in the suprachiasmatic nuclei. Nat Neurosci. 1998;1:693–700. doi: 10.1038/3695. [DOI] [PubMed] [Google Scholar]
- 31.Pan W, Kastin AJ. Entry of EGF into brain is rapid and saturable. Peptides. 1999;20:1091–8. doi: 10.1016/s0196-9781(99)00094-7. [DOI] [PubMed] [Google Scholar]
- 32.Pan W, Vallance K, Kastin AJ. TGFalpha and the blood-brain barrier: accumulation in cerebral vasculature. Exp Neurol. 1999;160:454–9. doi: 10.1006/exnr.1999.7215. [DOI] [PubMed] [Google Scholar]
- 33.Plata-Salaman CR. Food intake suppression by growth factors and platelet peptides by direct action in the central nervous system. Neurosci Lett. 1988;94:161–6. doi: 10.1016/0304-3940(88)90288-1. [DOI] [PubMed] [Google Scholar]
- 34.Plata-Salaman CR. Epidermal growth factor and the nervous system. Peptides. 1991;12:653–63. doi: 10.1016/0196-9781(91)90115-6. [DOI] [PubMed] [Google Scholar]
- 35.Ralph MR, Foster RG, Davis FC, Menaker M. Transplanted suprachiasmatic nucleus determines circadian period. Science. 1990;247:975–978. doi: 10.1126/science.2305266. [DOI] [PubMed] [Google Scholar]
- 36.Rich T, Innominato PF, Boerner J, Mormont MC, Iacobelli S, Baron B, et al. Elevated serum cytokines correlated with altered behavior, serum cortisol rhythm, and dampened 24-hour rest-activity patterns in patients with metastatic colorectal cancer. Clin Cancer Res. 2005;11:1757–64. doi: 10.1158/1078-0432.CCR-04-2000. [DOI] [PubMed] [Google Scholar]
- 37.Rich TA. Symptom clusters in cancer patients and their relation to EGFR ligand modulation of the circadian axis. J Support Oncol. 2007;5:167–74. discussion 176-7. [PubMed] [Google Scholar]
- 38.Rivest S, Lacroix S, Vallieres L, Nadeau S, Zhang J, Laflamme N. How the blood talks to the brain parenchyma and the paraventricular nucleus of the hypothalamus during systemic inflammatory and infectious stimuli. Proc Soc Exp Biol Med. 2000;223:22–38. doi: 10.1046/j.1525-1373.2000.22304.x. [DOI] [PubMed] [Google Scholar]
- 39.Saper CB, Lu J, Chou TC, Gooley J. The hypothalamic integrator for circadian rhythms. Trends Neurosci. 2005;28:152–7. doi: 10.1016/j.tins.2004.12.009. [DOI] [PubMed] [Google Scholar]
- 40.Schwartz WJ, Reppert SM. Neural regulation of the circadian vasopressin rhythm in cerebrospinal fluid: A pre-eminent role for the suprachiasmatic nuclei. Journal of Neuroscience. 1985;5:2771–2778. doi: 10.1523/JNEUROSCI.05-10-02771.1985. [DOI] [PMC free article] [PubMed] [Google Scholar]
- 41.Silver R, LeSauter J, Tresco PA, Lehman MN. A diffusible coupling signal from the transplanted suprachiasmatic nucleus controlling circadian locomotor rhythms. Nature. 1996;382:810–813. doi: 10.1038/382810a0. [DOI] [PubMed] [Google Scholar]
- 42.Snodgrass-Belt P, Gilbert JL, Davis FC. Central administration of transforming growth factor-alpha and neuregulin-1 suppress active behaviors and cause weight loss in hamsters. Brain Res. 2005;1038:171–82. doi: 10.1016/j.brainres.2005.01.030. [DOI] [PubMed] [Google Scholar]
- 43.Tang P, Steck PA, Yung WK. The autocrine loop of TGF-alpha/EGFR and brain tumors. J Neurooncol. 1997;35:303–14. doi: 10.1023/a:1005824802617. [DOI] [PubMed] [Google Scholar]
- 44.Tisdale MJ. Cachexia in cancer patients. Nat Rev Cancer. 2002;2:862–71. doi: 10.1038/nrc927. [DOI] [PubMed] [Google Scholar]
- 45.Tournier BB, Dardente H, Vuillez P, Pevet P, Challet E. Expression of Tgfalpha in the suprachiasmatic nuclei of nocturnal and diurnal rodents. Neuroscience. 2007 doi: 10.1016/j.neuroscience.2006.12.026. [DOI] [PubMed] [Google Scholar]
- 46.Van Setten GB, Edstrom L, Stibler H, Rasmussen S, Schultz G. Levels of transforming growth factor alpha (TGF-alpha) in human cerebrospinal fluid. Int J Dev Neurosci. 1999;17:131–4. doi: 10.1016/s0736-5748(98)00069-0. [DOI] [PubMed] [Google Scholar]
- 47.Vogelbaum MA, Menaker M. Temporal chimeras produced by hypothalamic transplants. Journal of Neuroscience. 1992;12:3619–3627. doi: 10.1523/JNEUROSCI.12-09-03619.1992. [DOI] [PMC free article] [PubMed] [Google Scholar]
- 48.Watts AG, Swanson LW. Efferent projections of the suprachiasmatic nucleus: II. Studies using retrograde transport of flourescent dyes and simultaneous peptide immunohistochemistry in the rat. Journal of Comparative Neurology. 1987;258:230–252. doi: 10.1002/cne.902580205. [DOI] [PubMed] [Google Scholar]
- 49.Xian CJ, Zhou XF. Roles of transforming growth factor-alpha and related molecules in the nervous system. Mol Neurobiol. 1999;20:157–83. doi: 10.1007/BF02742440. [DOI] [PubMed] [Google Scholar]
- 50.Yarden Y. The EGFR family and its ligands in human cancer. signalling mechanisms and therapeutic opportunities. Eur J Cancer. 2001;37(Suppl 4):S3–8. doi: 10.1016/s0959-8049(01)00230-1. [DOI] [PubMed] [Google Scholar]