Abstract
Transrectal-ultrasound-guided brachytherapy uses small titanium-shelled radioactive seeds to locally treat prostate cancer. During the implantation procedure, needles inserted transperitoneally cause gland movement resulting in seed misplacement and suboptimal dosimetry. In a previous study, an algorithm based on singular spectrum analysis (SSA) applied to envelope-detected ultrasound signals was proposed to determine seed locations [J. Mamou and E. J. Feleppa, J. Acoust. Soc. Am. 121, 1790–1801 (2007)]. Successful implementation of the SSA algorithm could allow correcting dosimetry errors during the implantation procedure. The algorithm demonstrated promise when the seed orientation was parallel to the needle and normal to the ultrasound beam. In this present study, the algorithm was tested when the seed orientation deviated up to 22° from normality. Experimental data from a seed in an ideal environment and in beef were collected with a single-element, spherically focused, 5 MHz transducer. Simulations were designed and evaluated with the algorithm. Finally, objective quantitative scoring metrics were developed to evaluate the algorithm performance and for comparison with B-mode images. The results quantitatively established that the SSA algorithm always outperformed B-mode images and that seeds could be detected accurately up to a deviation of approximately 10°.
INTRODUCTION
Brachytherapy is a cancer-treatment procedure that is becoming widely accepted for treating prostate cancer. This procedure consists of the permanent implantation of small radioactive seeds (containing iodine or palladium) within the prostate gland.1, 2 Most types of prostate-brachytherapy seeds consist of a thin, rigid, smooth, cylindrical, titanium shell, and are 4.5 mm long by 0.8 mm in diameter. Currently, transrectal ultrasound (TRUS) is the standard imaging modality for treatment-planning dosimetry, guiding, and monitoring seed implantation.3, 4
Seeds are inserted transperitoneally through a needle guided by a fixture that is linked to the TRUS probe. After insertion, the seeds ideally are oriented normally to the ultrasonic beam and parallel to the needle. However, movement of the prostate during seed insertion often leads to the seeds being inserted away from their optimal location and with an orientation that deviates from being normal to the transducer beam. Sometimes seeds even are placed outside of the prostate, for example, in the bladder, the urethra, or the circulatory system5, 6 leading to potentially harmful bioeffects from radioactivity. An imaging method that enables visualization of seeds during the implantation procedure would be valuable for taking immediate corrective action by implanting seeds in underdosed regions. Unfortunately, existing TRUS imaging systems used to plan and guide seed implantation do not reliably image implanted seeds. The predominant causes for the difficulty in ultrasonically imaging implanted seeds are seed specularity, shadowing, and clutter from other highly reflecting entities (e.g., calcifications or hemorrhage) in the gland.
Currently, seed location and orientation typically are determined from postimplant x-ray computed tomography (CT) or magnetic resonance imaging (MRI) performed 3 h to 2 weeks after the implantation procedure.7, 8, 9 If, based on imaging results, the radiation oncologist decides that the current dosage is not sufficient to successfully treat the cancer, patients must undergo additional, multiweek, external-beam radiation therapy for dose correction. Therefore, radiation oncologists would find a real-time TRUS-based imaging method that is capable of providing accurate, postinsertion, seed-location and seed-orientation information to be very valuable. Such a modality would enable timely feedback for intraoperatively correcting deficiencies in the radiation dose delivered to the gland and would eliminate the need for CT or MRI imaging and follow-up radiation therapy.
To date, only modest investigations have been conducted to establish the expected distribution of seed angles after insertion in the prostate gland. Follow-up CT or MRI images cannot reliably establish the location and orientation information of each seed.10 A recent study by Corbet et al. looking at quantifying the effect of seed orientation on dose derived an angle probability distribution function based on postimplant radiographs of 10 patients.11 Their distribution model had a mean angle of 0° between the seed axis and the ultrasound beam, but the distribution had long tails: Only 58% of seeds were predicted to have an angle smaller than 20° from normal to the beam. The actual immediate postimplant angle distribution might have a smaller variance around 0°, because in this study the radiographs were taken a month after seed implantation.
In a previous publication, we described a novel ultrasonic method for detecting and imaging brachytherapy seeds.12 The method seeks to exploit the “tail” of repeating echoes that typically appears beyond the seed, distal to the transducer. It uses the envelope-detected signals derived from the (rf) echo signals produced by an ultrasound probe as the input and forms a color-coded image termed a P-mode image. A P-mode image consists of the conventional B-mode image augmented by color-coded information indicative of the likelihood of seed presence. The strength of the method is the envelope-detected signals used as algorithm inputs are available readily in the operating room because these signals are the video signals used to generate the clinical image. The algorithm is based on a signal-processing framework called singular spectrum analysis (SSA)13, 14, 15 and the color-coded information displayed on the P-mode image is obtained by detecting and quantifying the strength of the seed tail signal using the SSA framework.
Our first publication described the SSA algorithm as a viable method to detect and image seeds.12 However, because the emphasis was on the development and validation of the SSA algorithm, the experiments and simulations were limited to the case where a single seed was oriented orthogonally to the transducer axis. In the present paper, the SSA-algorithm performance is evaluated when the seed orientation with respect to the transducer is varied. Ultrasound experiments were conducted in an ideal environment (i.e., acoustically transparent gelpad) and in a tissue-like (i.e., degassed ex vivo beef) environment. Simulations also were developed based on empirical data acquired from the ideal-environment experiments. To quantify performance, we developed two score metrics. The first metric quantifies how well the seed location is determined by the SSA algorithm (i.e., the true-positives produced by the algorithm) and the second metric evaluates whether the SSA algorithm produces false-positives. The paper is organized as follows: Section 2 presents the methods used to acquire data, to simulate data, to compute the score metrics, and briefly reviews P-mode image formation; Sec. 3 presents the results of the simulations and experiments; and Sec. 4 presents the discussion and conclusions of the study.
MATERIAL AND METHODS
Seeds
The seeds used in this study were nonradioactive versions of commonly used palladium (Pd103) seeds. The seeds were described in Ref. 12 and are an increasingly popular seed for brachytherapy treatment of prostate cancer.
Data collection and experiments
All the data were acquired using a 5 MHz, single-element transducer (S∕N 25653, Panametrics Inc., Waltham, MA). The transducer has a focal length of 51 mm and a diameter of 14 mm (i.e., an F-number=3.7). The transducer was excited with a Panametrics 5900 pulser∕receiver unit. The rf echo signals were digitized using an Acqiris DB-110 A∕D board (Acqiris, Monroe, NY) at a sampling rate of 50 MS∕s. The spacing between adjacent A lines was 100 μm. Following digitization, the rf data were saved, envelope-detected, and processed offline using the SSA algorithm.
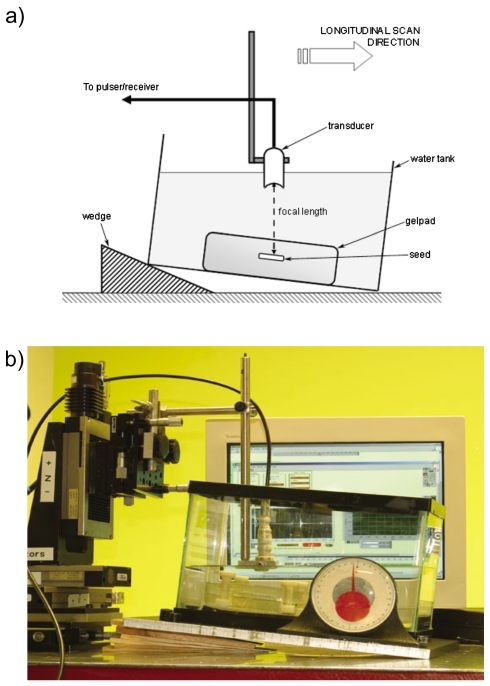
In the first set of experiments, a seed was inserted into an acoustically transparent gelpad (Aquaflex, Parker Laboratories, Fairfield, NJ) that was placed in a water bath for scanning. The angle between the seed and the acoustic-beam axis was varied by tilting the bath while the transducer remained vertical [Fig. 1a]. This setup allowed us to change the angle of the seed with respect to the ultrasound beam by increasing or decreasing the tilt angle of the tank. The initial angle of the seed was determined by scanning along the long axis of the seed. This longitudinal B-mode scan indicated whether the seed was inserted into the gelpad at an angle. If the seed appeared slanted in the longitudinal scan, the angle of the tank was adjusted to remove the incline. Once the seed was horizontal (i.e., at 0°), it was scanned in two directions: along the long axis of the seed (a longitudinal scan) and across the cross section of the seed (a transverse scan). Care was taken to ensure that the seed was centered simultaneously in the transverse and longitudinal scan planes. The seed also was maintained in the focal region of the transducer. To vary the angle of the seed, angled wedges were placed under the water tank. The tilt angle was measured with a protractor attached to the base of the tank [Fig. 1b]. The angle was varied from 0° (i.e., horizontal) to 22° from the horizontal in steps of 1°, with centered transverse and longitudinal scans performed at each angle. Figure 1b shows the experimental laboratory setup. The monitor in the background displays a single A line using the custom LabVIEW (National Instruments, Austin, TX) software that acquired the rf data.
Figure 1.
(Color online) Laboratory setup for gel-pad experiments. (a) Schematic of the experimental setup showing the seed inserted into an acoustically transparent gel pad in a water tank. The angle of the seed is changed by using different wedges. (b) Actual experimental setup with a protractor measuring the tilt angle. The monitor in the background displays the GUI for the data-acquisition software.
In the second set of experiments, a similar assembly was used to acquire data from a seed inserted in a piece of beef. The beef was degassed prior to seed insertion and had a thickness of 2 cm. The tank was filled with phosphate-buffered saline, and echo data were collected at 1° increments from 0° to 21° employing the method that was used in the gelpad experiments (Fig. 1).
Angle-dependent simulations
Simulations of seed rf echo signals from 0° to 11° were performed in order to evaluate the performance of the SSA algorithm under controlled conditions. The simulations were based on the empirical data obtained from the gelpad experiments and designed so that a complete B-mode image could be formed. The rf data corresponding to each A line was simulated at a sampling rate of 50 MS∕s, and the spacing between two adjacent A lines was 100 μm for consistency with acquired experimental data.
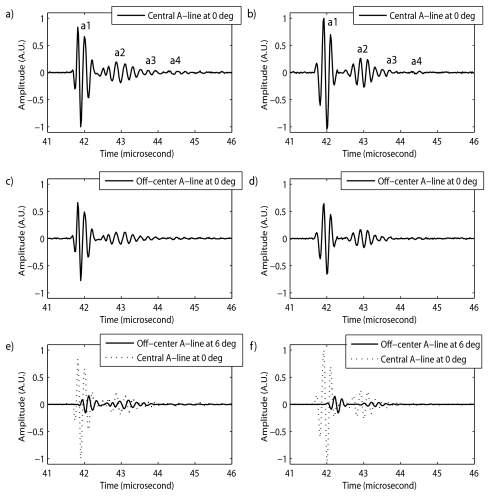
Figure 2 displays rf echo signals (i.e., one A line) from experimental longitudinal scans (seed in gelpad) in the left column, and the corresponding simulated rf echo signals in the right column. The rf echo signal from the center of the seed at an angle of 0° (in longitudinal and transverse directions) was modeled as four pulses, 0.8 μs apart, with center frequencies of 5 MHz. Figures 2a, 2b show the central A line (i.e., echo from the center of the seed) at 0° with the four pulses (i.e., a1, a2, a3, and a4). Pulses a1 and a3 were modeled as Hanning-windowed, three-cycle tone bursts. Pulses a2 and a4 were modeled as having five and four cycles, respectively. Similar A lines were simulated on either side of the central A line to obtain a complete B-mode image. The off-center A lines were deduced from the center A line by weighting the central A line so that the maximum amplitude of the seed echoes gradually decreased on moving away from the center of the seed (as observed experimentally). Figures 2c, 2d show the experimental and simulated A lines 2 mm away from the center of the seed. The peak amplitudes of these off-center A lines are 34% (i.e., 9.3 dB) lower than those of Figs. 2a, 2b.
Figure 2.
Comparison of experimental and simulated rf A lines for longitudinal scans. Left column displays A lines from gel pad experiments. Right column displays the corresponding simulated A lines. (a) and (b) A lines from the center of a seed at 0°. (c) and (d) Off-center A lines from a seed at 0°, showing lower peak amplitudes. (e) and (f) Off-center A lines from a seed at 6°, showing the delays introduced to model tilting of the seed. Central A lines from a seed at 0° are shown for reference.
In the transverse and longitudinal simulations, as the angle of the seed increased, the peak amplitude values of the modeling pulses were lowered to match the corresponding experimental values. In the simulated longitudinal scans only, the seed itself had to appear tilted in the B-mode image. Simulating the tilt of the seed was achieved by delaying the off-center A lines to simulate one end of the seed being farther from the transducer than the other. The delays were computed based on the angle being modeled. Figures 2e, 2f display off-center A lines from experiments and simulated echo signals at an angle of 6°. The dotted plots represent the central A lines at 0°. Figures 2e, 2f illustrate the added delay for tilting and the change in peak amplitude of the echo data as the angle of the seed with the ultrasound beam is varied.
For all simulations, white Gaussian noise was added to the simulated rf signals to match the same signal-to-noise ratio (SNR) as in the experimental data. Finally, the simulated rf signals were envelope-detected to form simulated B-mode images and to provide the signals needed as input for the SSA algorithm.
Performance-evaluation metrics
Two types of scoring metrics were developed to evaluate the ability of the SSA algorithm to detect and image seeds at various angles. The first type of metric was used for the gelpad experiments and the corresponding simulations. This metric termed Score was chosen to equal the maximum P-mode value in a region-of-interest (ROI) containing the actual and known location of the seed. In the case of the gelpad experiments and simulations, this metric captures the complete performance of the algorithm because false-positives never occurred (i.e., the SSA algorithm never interpreted the envelope-detected white Gaussian noise as being a seed).
However, for the beef experiments, a second type of metric needed to be created to account for possible false-positives as well as false-negatives. Two measures of the second type were computed from the generated P-mode values by applying the SSA algorithm to the envelope-detected rf echo signals. The first measure of the second type was termed the Seed Score (SS) and the second was the Worst False Positive (WFP). The metrics were designed so that the SS indicates how well the seed is detected and imaged by the algorithm and WFP provides information regarding the possible false-positives.
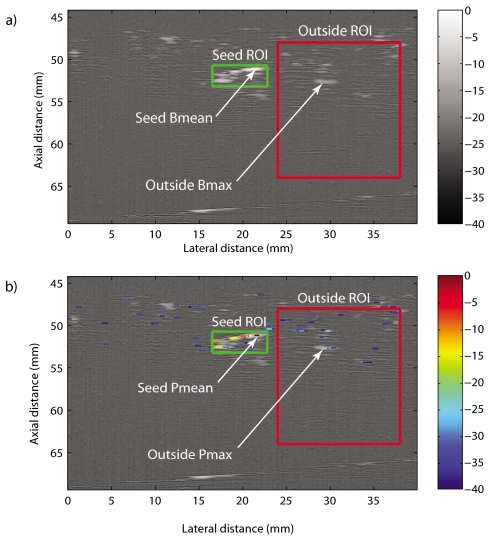
To illustrate how SS and WFP were computed, Figure 3a shows a longitudinal B-mode image of a seed at an angle of 6° marked with two ROIs: one termed “seed” ROI includes the seed and the other termed “outside” ROI includes highly echogenic structures but not the seed. Figure 3b shows the corresponding P-mode image. SS was estimated using
| (1) |
where SeedPMean is the mean of the three maximum P-mode values within the seed ROI, and OutsidePrms is the root-mean-square of all P-mode values within the outside ROI.
Figure 3.
(Color online) Illustration of the seed and outside ROIs used to evaluate algorithm performance (i.e., SS and WFP). (a) Longitudinal B-mode scan of a seed at 6°. (b) P-mode values superimposed on the B-mode image. The same seed ROI and outside ROI are used to compute B-mode and P-mode scores.
To compute WFP, a matched filter was used to compute the two-dimensional (2D) correlation between the P-mode values in the outside ROI and a rectangular mask of size 0.19 mm×0.5 mm. From an image-processing standpoint this operation is a 2D moving-average filter (i.e., a low-pass operation). This 2D filtering allows selecting areas where large P values are adjacent to each other (i.e., form a connected component having large P values, like a possible seed) and discarding large P values that are isolated (i.e., probably noise and not a seed). Thus, the rationale is that the peak of the 2D correlation indicates where in the outside ROI a connected component of large P values looks the most like a seed. The quantity OutsidePMax was defined as the P-mode value at the location of the maximum of the 2D correlation and WFP was defined by
| (2) |
Arrows in Fig. 3b indicate the positions of the SeedPMean and OutsidePMax.
In Eqs. 1, 2, the subscript P indicates that SSP and WFPP were computed from the P-mode values. For comparison, the same scores were computed from the B-mode data. Equations 3, 4 define the seed Score and WFP for the B-mode image:
| (3) |
and
| (4) |
Arrows in Fig. 3a indicate the positions of SeedBMean and OutsideBMax. (The subscript B indicates that SSB and the WFPB were computed from the B-mode values.)
Comparing the scores obtained with the P-mode data with those obtained with the B-mode data determines whether the SSA algorithm improves the quality of the detection and imaging of seeds over visual assessment of conventional (i.e., B-mode) ultrasound images.
Singular spectrum analysis algorithm
The current SSA algorithm is identical to the algorithm presented in great detail in a previous publication12 except for the introduction of soft thresholds in the eigenvalue-pair selection process. In the previous version of the algorithm, eigenvalue pairs of the auto-correlation matrix of the envelope-detected signals were selected when the following three inequalities were true:
-
1)
i<k90 and j<k90, where k90=Min {l, such that }.
-
2)
∣1−λi∕λj∣<0.04.
-
3)
The frequencies, fi and fj, at which the spectra (i.e., the magnitude of the Fourier transforms) of eigenvectors Ei and Ej reach their maxima, respectively, are such that ∣1−fi∕fj∣<0.03.
In these inequalities, the eigenvalues of the autocorrelation matrix are ordered from the largest to the smallest, (λ1>⋯>λM), and E1,⋯,EM are the corresponding eigenvectors. The set of selected eigenvalues is denoted by Γ. Following eigenvalue selection, a new time signal, sr, is constructed from the selected pairs by (see Ref. 12 for notations):
| (5) |
A P value indicative of the likelihood of a seed presence is derived from sr. The last step of the algorithm consists of forming the color-coded P-mode image that indicates where the algorithm believes each seed is located.12
Soft thresholds. Simulations of signals having eigenvalue pairs near the thresholds of the three inequalities led to results with large standard deviations depending on whether for a particular realization the eigenvalues satisfied the inequalities. The hard thresholds used in the previous version of the algorithm essentially made the P-mode image a noncontinuous function of the rf data, but continuity translates into greater algorithm robustness. The soft-threshold approach presented below makes the SSA algorithm continuous.
To implement the soft threshold, we kept the first inequality the same (i.e., item 1 in Sec. 2E) and defined:
| (6) |
| (7) |
| (8) |
| (9) |
Equation 5 then was rewritten as
| (10) |
where
| (11) |
and
| (12) |
where the parameter α can be adjusted to select how “soft” the thresholds should be. The criteria for choosing α are discussed in the following.
Equation 10 essentially says that the sum is extended to all eigenvalues up to the 90% total variance of the signal (i.e., index k90) but weighted by a coefficient, γk, that is now continuous. Note that Eq. 11 reduces to Eq. 5 if γk is defined to be equal to 1 when Δ(k)<1 and Δ′(k)<1 and equal to 0 otherwise.
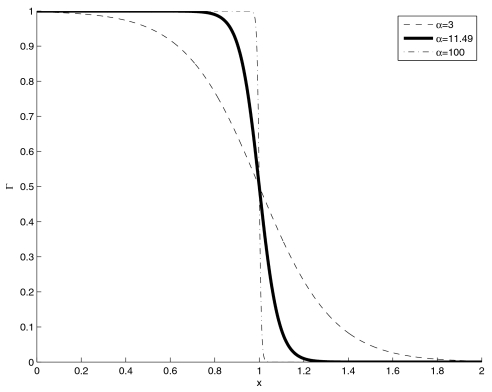
Figure 4 displays the function Γ(x) for three different values of α. Figure 4 shows that as the numerical value of α increases, the function Γ(x) converges to a discontinuous function (see curve for α=100) and Eq. 11 reduces to Eq. 5. The smaller the value of α the “softer” the thresholds become (e.g., α=3). The solid curve is the one used in this study, and the value of α was chosen such that Γ(0.8)=1−Γ(1.2)=0.99. Essentially, if Δ(k)<0.8 and Δ′(k)<0.8 or if Δ(k)>1.2 and Δ′(k)>1.2, then the eigenvalues are summed or dismissed, respectively, just as in the hard threshold case. Between these values, the algorithm behaves continuously; the eigenvalues are added, but are weighted by a coefficient that depends on how “certain” the algorithm is that the considered eigenvalue is part of a pair. This behavior is the reason that the thresholds are termed soft, and because Γ(x) is continuous (actually infinitely differentiable), the algorithm is continuous.
Figure 4.
Soft-threshold Γ(x) function for three different values of parameter α.
RESULTS
Gel-pad experiments and single-seed simulations
The longitudinal and transverse scans of a seed in a gel pad were analyzed with the SSA algorithm. The simulations of seed echoes based on the acquired experimental data also were employed to generate P-mode images. To evaluate simulation performance, each angle (from 0° to 11° incremented in 1° steps) in each direction was simulated ten times with different realizations of white Gaussian noise.
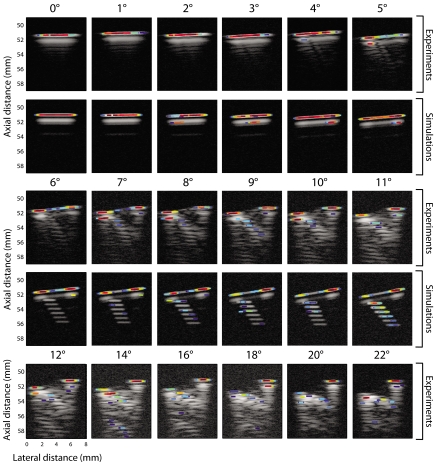
Figure 5 displays the longitudinal P-mode images of experimental data (first, third, and fifth rows) and of one realization of the simulated data (second and fourth rows). The SNRs of the experimental data varied from 44 dB at 0° to 39 dB at 22°. The SNRs of the simulated data were matched to those of the experimental data at each seed angle. The P-mode images are displayed with a 40 dB dynamic range.
Figure 5.
(Color online) Longitudinal P-mode images of a seed in a gel pad at different angles with corresponding simulations. The first, third, and fifth rows display experimental data from 0° to 22° of seed tilt. Second and fourth rows show simulated B-mode images from 0° to 11° of seed tilt. All scans are 8 mm across, and the P values have a dynamic range of 40 dB.
For the experiments and the simulations, Fig. 5 shows that the seed was perfectly detected (as shown by the red area on the P-mode images) by the SSA algorithm when the angle of the seed was below 6°. The P values at these low angles were well-localized at the first echo from the seed. As the angle of the seed increased above 6°, the shape of the seed in the longitudinal B-mode images changed: Echo amplitudes at the center of the seed became noticeably lower than those at the ends of the seed (third and fifth rows of Fig. 5). Overall, the P-mode images at angles greater than 6° were of lower quality than those obtained at smaller angles, but the seed could always be detected. For example, at angles between 12° and 22° (fifth row in Fig. 5), large P values were still visible at the first echo from the seed, but other regions of the P-mode image also lit up. The undesired P values centered over multiple reflections at the back of the seed (i.e., the side of the seed farthest from the transducer) weakened the specificity of the algorithm at higher angles. Overall, the performance of the algorithm in the longitudinal case was very good. The seed always was found and displayed by the algorithm and only a few possible false-positives occurred.
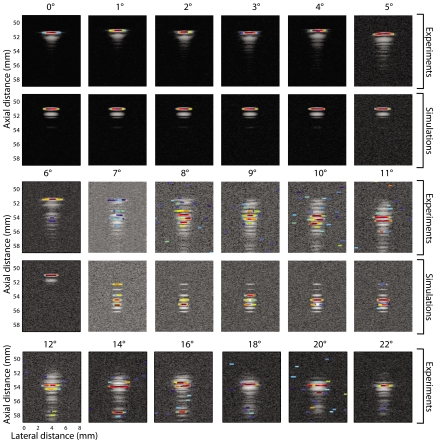
Figure 6 displays the P-mode images for the transverse data in the same format as Fig. 5. The results demonstrate that the algorithm performed perfectly up to an angle of 6°. At angles greater than 6°, the seed also was detected, but the corresponding P values appeared slightly below the actual seed location (e.g., 2 mm below for the 11° and 22° cases). Such a difference is not of great importance for dosimetry, but we are currently investigating ways of modifying the algorithm to correctly recover depth. Just as in the longitudinal case, weak but undesired P values occurred away from the actual seed location at angles greater than 8° (e.g., the 10° or 20° cases). These weak, spurious P values would most likely not be falsely interpreted as seeds in a clinical setting. Overall, the performance of the SSA algorithm was perfect up to 6°, and satisfactory up to 22°. The seed always was detected but sometimes was imaged at an apparent location that was deeper than the actual location.
Figure 6.
(Color online) Transverse P-mode images of a seed in a gel pad at different angles, with corresponding simulations. The first, third, and fifth rows display experimental data from 0° to 22° of seed tilt. The second and fourth rows show simulated B-mode images from 0° to 11° of seed tilt. All scans are 8 mm across, and the P values have a dynamic range of 40 dB.
Figures 56 also demonstrate that our simulation method produced P-mode images that were visually similar to those of the experiments for both seed orientations and for angles up to 11°. At lower angles, the seed is perfectly recovered (e.g., in the 4° case for both orientations), but when the angle increased, the performance of the algorithm worsened in simulations just as it did in experiments.
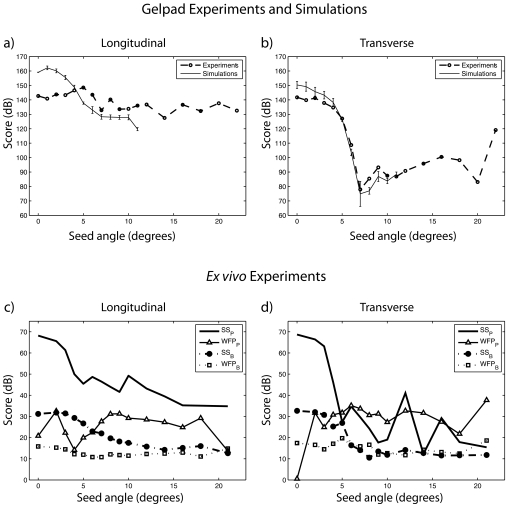
To quantify the above-noted observations, Score values were computed for the longitudinal and transverse scans and displayed in Figs. 7a, 7b, respectively. For the simulations, each data point is the mean of ten realizations and is displayed with error bars symbolizing standard deviations. The experimental results of Fig. 7a are fairly constant in demonstrating that the algorithm detects the seed at every angle the same way. The simulation results are slightly more angle dependent; results are better at lower angles (up to 20 dB better) before stabilizing at about 5 dB below the experimental curve.
Figure 7.
Evaluation of the performance of the SSA algorithm in simulations and using experimental data. Scores for a seed in a gel pad (a) from longitudinal scans and simulations and (b) from transverse scans and simulations. Seed Scores (SS) and Worst False Positive (WFP) measures from P-mode and B-mode data of a seed in beef for (c) longitudinal and (d) transverse scan directions.
The trend of the Score value is different for the transverse seed orientation [Fig. 7b]. The experimental and simulated curves are very similar and follow the same trend. The Score value decreased very quickly from about 140 dB at 0° to about 75 dB at 7°. Beyond 7°, both curves remained fairly low (i.e., below 100 dB) except for an odd high experimental value of 120 dB for 21°. Figure 7b demonstrates that, as is qualitatively apparent in Fig. 6, the SSA algorithm performance drops quickly with increasing angles in the transverse direction.
Multiple-seed simulations
Figure 8 shows a clinically more-realistic application of our seed-simulation methods. In Figs. 56, only a single seed was modeled. In this section, we describe a multiseed simulation study.
Figure 8.
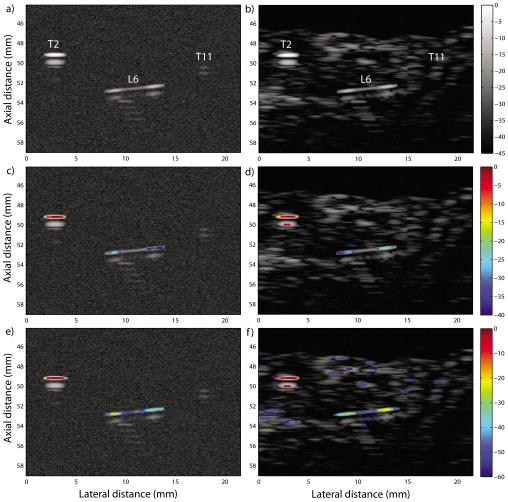
(Color online) Simulated data with Gaussian noise background in the left column and beef tissue background in the right column. Three simulated seeds are shown in each image: two seeds scanned in the transverse direction, one at 2° (T2) and the other at 11° (T11), and a seed at 6° scanned in the longitudinal direction (L6). (a), (b) The simulated B-mode images. (c), (d) The corresponding P mode with a 40 dB dynamic range. (e), (f) The corresponding P mode with a 60 dB dynamic range.
Figure 8 displays a simulated conventional B-mode image containing three seeds. Two of the seeds (T2 and T11) are simulated in the transverse direction with angles of 2° and 11°, respectively, and the third seed (L6) is simulated in the longitudinal direction with an angle of 6°. Figure 8a was obtained by adding white Gaussian noise to the simulated seeds to simulate a gel-pad experiment. Figure 8b was obtained by adding echoes from beef tissue to the simulated seed to simulate a seed in clutter-containing beef experiments. For both cases, the SNR was set to 40 dB.
Figures 8c, 8d display the resulting P-mode images with 40 dB dynamic range. T2 and L6 are easily identified by the algorithm in both images. However, noise and the weaker echo magnitude did not allow identification of L11.
Figures 8e, 8f display the same P-mode images as Figs. 8c, 8d, but with a 60 dB dynamic range to evaluate whether an extended dynamic range would allow detecting and imaging T11. The resulting images demonstrate that the algorithm simply did not detect T11 even with the extended dynamic range; the seed is not visible either in Fig. 8e or in Fig. 8f
This multiseed simulation demonstrates that our seed-simulation method can be used for objective evaluation of all the native versions of the SSA algorithm or of other algorithms without the immediate need for experimental data. Future versions of the SSA algorithm will be tested first on multiseed simulations and then, if encouraging results are obtained, on experimental data.
Ex vivo experiments
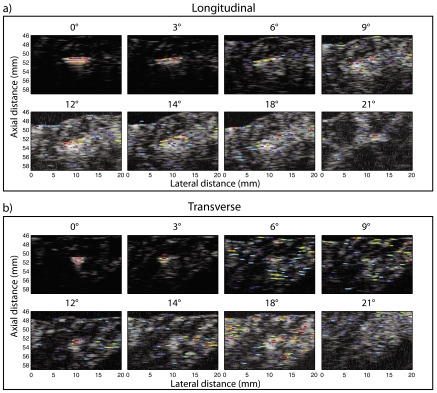
A set of ex vivo experiments tested the performance of the SSA algorithm in an environment that more realistically resembles the prostate. In these ex vivo experiments, a single seed was inserted into a piece of degassed beef and scanned in longitudinal and transverse directions at angles ranging from 0° to 21° using the same apparatus as for the gel pad experiments (Fig. 1). Some of the resulting P-mode images are displayed in Fig. 9. The dynamic range of the P values was maintained at 40 dB for all the images.
Figure 9.
(Color online) Ex vivo experiments: B-mode scans of a seed inserted into a piece of fresh, degassed, beef overlaid with P-mode data. (a) Longitudinal scans of the seed at various angles. (b) Transverse scans of the seed at the same angles. The P values have a dynamic range of 40 dB.
Increasing the angle of the normal to the seed with respect to the transducer beam reduced the SNR of the B-mode images because the echo signal amplitude reflected by the seed decreased. Thus, detection of the seed in the conventional B-mode image was more difficult at larger seed-tilt angles. Detection of the seed from P-mode images was possible over a much larger angle range (i.e., up to 20°) than was possible using the B-mode images. However, as in the gel-pad experiments, the best identification of the seed by the algorithm occurred at smaller angles (i.e., between 0° and 6° with respect to the normal). As the tilt angle of the seed increased, more possible false positives appeared in the surrounding tissue. In most cases, the P values of the possible false-positives were 20 to 30 dB lower than the P value at the seed location. These spurious P values increased the uncertainty in seed localization. In order to quantity these observations, SSP, SSB, WFPP, and WFPB were evaluated at each angle and for each seed orientation.
For the longitudinal cases [Fig. 7c], the SSP curve indicates that, as expected, the performance of the algorithm degrades with increasing angle. However, because SSP is greater than WFPP at every angle; the actual seed always has the highest P-mode value, so that it would always be detected as a seed before anything else in the image is falsely identified as a seed. This fact tends to confirm that the seed always is detected, but that as the angle increases, more P-mode structures mimic seeds. WFPP does not vary substantially with angle; it is nearly constant at 30 dB. This uniformity is expected because WFPP measures an intrinsic property of the beef tissue that should be independent of angle. The SSB curve has the same trend as the SSP, but is about 40 dB lower, which means that P mode has about 40 dB better seed contrast than the B-mode image does. Moreover, the difference between the SSP and the WFPP is much more than that between SSB and the WFPB. This means that the likelihood of producing a false positive is greater using the B-mode image than using the P-mode image. This is particularly true at angles greater than 11° when the SSB and WFPB curves meet (i.e., on the B-mode image the seed looks exactly like the background). The longitudinal study demonstrates that at any angle, the P-mode image dramatically outperforms the B-mode image. The actual seed always would be detected on the P-mode image, while in the B-mode image it merges into the background at angles greater than 11°. Although both methods would find the seed at smaller angles, the P-mode image provides about 40 dB more contrast between the seed and the background than the B-mode image provides.
For the transverse results [Fig. 7c], the SSP curve shows that the ability of the algorithm to detect a seed decreases quickly with increasing angle. Beyond 6°, SSP essentially oscillates at low values near 25 dB. Except for the anomalous value at 0°, WFPP is fairly constant at the same value as in the longitudinal case (i.e., 30 dB). Thus, the SSP is not always greater than WFPP, which means that in certain cases (e.g., the 11° case), false-positives will be produced preferentially to the actual seed because they have larger P values. At a tilt angle less than 5°, SSB is about 40 dB below SSP, meaning that the P-mode image has better seed contrast than the B-mode image. At angles beyond 5°, SSB≈WFPB, which means that on the B-mode image, the seed looks just like the background. The transverse study shows that at low angles, the P-mode image dramatically outperforms the B-mode image in terms of seed contrast and detection. However, beyond 6°, the two methods perform approximately equally.
These ex vivo experiments clearly demonstrate the superiority of the SSA algorithm over the visual assessment of a conventional B-mode image for detecting and locating seeds. However, the results also indicate that in a realistic, clutter-containing environment, the SSA method works best at modest angles.
DISCUSSION
The proposed SSA algorithm appears to be an attractive choice for real-time clinical detection and imaging of seeds inserted into the prostate (or other treated organ). The only inputs required by the algorithm are the envelope-detected signals that readily are available on clinical scanners, i.e., the envelope-detected signals that are used to form the conventional B-mode implantation planning and guidance images. Furthermore, because the SSA method exploits the existence of the seed-signal repetitions,12 the algorithm should be able to perform independently of the transducer technology, time-gain compensation methods, or beamforming techniques that are used.
In this study, one of the weaknesses of the previously described SSA algorithm12 was mitigated by introducing the soft-threshold approach. From our experience, the standard deviations of some specific simulation cases were reduced using the new approach. This standard-deviation reduction suggests that the robustness of the algorithm was improved. From a theoretical standpoint, the use of soft thresholds made the P-mode image a continuous function of the envelope-detected data. However, with our chosen value for α, we did not experience major changes in the results of the actual experiments. This suggests that in most experimental cases, eigenvalue pairs are well inside the chosen tolerance values. We currently are investigating how lowering the tolerance values and increasing α (i.e., applying a softer threshold) will influence the algorithm performance. We anticipate that we may be able to optimize these parameters to increase the sensitivity of the SSA algorithm.
SSA algorithm performance was evaluated for its dependence on seed orientation. The cylindrical geometry and highly specular reflective symmetry of the seed make the efficacy of the algorithm depend upon the angle between the seed and the ultrasound beam axis. The findings of this study suggest that while the SSA algorithm performs well at modest angles, it performs far better than conventional B-mode imaging over a wide range of angles. The far superior contrast obtained in the P-mode image compared to the B-mode image was demonstrated quantitatively as illustrated in Fig. 7. Certainly, finding a way to improve the algorithm to perform at larger angles would be of great value, but considering the modest echo strength of the seed at angles greater than 10°, the algorithm would need to be made robust in low SNRs and high-clutter environments. Our hope is that the SSA algorithm performs well in real-time during the implantation procedure so that it can be used even if its most-reliable performance occurs at angles below 10°.
At this stage of development, making the SSA algorithm real-time is not yet a priority. Nevertheless, by simple optimization of our Matlab (Mathworks Inc., Natick, MA) programs along with improvements in computer technologies, we have been able to reduce the processing time necessary to generate a P-mode image by about 60% to less than 1 min. While this is still far from real-time, we are confident that the SSA algorithm can be implemented in a more-rapid manner (e.g., using C++ language) and we anticipate that using graphics processing units can reduce the necessary processing time sufficiently to allow for clinically practical, real-time computation of P-mode images.
Our scoring system offers a quantitative and systematic means of evaluating the performance of any seed-imaging algorithm whose output is a spatial “likelihood” map. In this study, we compared B mode and P mode, but other investigators may develop other imaging approaches, and their performances could be compared objectively using our score metrics.
Also, new TRUS probes that are currently becoming available will allow for obtaining real-time three-dimensional (3D) B-mode images of the prostate either through mechanical scanning or through beam-forming algorithms. For example, the probe of the TargetScan system (Envisioneering Medical Technologies, St. Louis, MO) contains a single-element transducer that is mechanically scanned inside the probe to obtain a series of adjacent sector scans leading to a complete 3D data set.16 A slightly different approach is used in the probe of the Sonablate-500 system (Focus Surgery Inc., Indianapolis, IN) which contains two transducers: one for high-intensity focused ultrasound treatment and one for imaging. Both transducers can be mechanically scanned within the probe to image or treat the prostate in a 3D fashion.17 We hypothesize that the SSA algorithm used in conjunction with advanced TRUS probes may become an extremely valuable tool because each seed within the gland would be insonified at a modest angle (e.g., <10°) with respect to one of the insonification axes employed (or simulated) by such TRUS probes.
Another thrust of our investigation is to understand the physical origin of the repetition signals backscattered from a seed. To date, we have not yet determined conclusively what the origin of these signals is. Our hope is that if we fully can comprehend how the repetition signals originate, then the SSA algorithm can be optimized to be more specific to seed repetitions than to actual tissue structures that might be about 1 μs apart (i.e., ∼0.75 mm). This certainly would decrease the incidence of false-positives that result from randomly occurring periodic arrangements of scatterers in the prostate gland. We also will seek to determine whether we can predict how the repetition changes as a function of seed orientation. The SSA algorithm then could be used not only to detect and images seeds, but also to recover orientation information.
Finally, we are initiating a clinical study with the current version of the SSA algorithm. The algorithm will be tested over a large number of patients to obtain receiver operator characteristic curves that will provide an objective assessment of algorithm performance under actual clinical conditions.
ACKNOWLEDGMENT
This research is supported in part by NIH Grant No. CA098465.
References
- Holm H. H., Juul N., Pedersen J. F., Hansen H., and Stroyer I., “Transperineal 125iodine seed implantation in prostatic cancer guided by transrectal ultrasonography,” J. Urol. (Baltimore) 130, 283–286 (1983). [DOI] [PubMed] [Google Scholar]
- Blasko J. C., Ragde H., and Schumacher D., “Transperineal percutaneous iodine-125 implantation for prostatic carcinoma using transrectal ultrasound and template guidance,” Endocurie∕Hyperthermal Oncol. 3, 131–139 (1987). [Google Scholar]
- Crook J., McLean M., Catton C., Yeung I., Tsihlias J., and Pintilie M., “Factors influencing risk of acute urinary retention after trus-guided permanent prostate seed implantation,” Int. J. Radiat. Oncol., Biol., Phys. 10.1016/S0360-3016(01)02658-X 52, 453–460 (2002). [DOI] [PubMed] [Google Scholar]
- Wei Z., Ding M., Downey D., and Fenster A., “3D TRUS guided robot assisted prostate brachytherapy,” Med. Image Comput. Comput. Assist. Interv. 8, 17–24 (2005). [DOI] [PubMed] [Google Scholar]
- Sommerkamp H., Rupprecht M., and Wannemacher M., “Seed loss in interstitial radiotherapy or prostatic carcinoma with I-125,” Int. J. Radiat. Oncol., Biol., Phys. 14, 389–392 (1988). [DOI] [PubMed] [Google Scholar]
- Merrick G. S., Butler W. M., Dorsey A. T., Lief J. H., and Benson M. L., “Seed fixity in the prostate∕perprostatic region following brachytherapy,” Int. J. Radiat. Oncol., Biol., Phys. 10.1016/S0360-3016(99)00405-8 46, 215–220 (2000). [DOI] [PubMed] [Google Scholar]
- Brinkmann D. H. and Kline R. W., “Automated seed localization from ct data sets of the prostate,” Med. Phys. 10.1118/1.598346 25, 1667–1672 (1998). [DOI] [PubMed] [Google Scholar]
- Liu H., Cheng G., Yu Y., Brasacchio R., Rubens D., Strang J., Liao L., and Messing E., “Automatic localization of implanted seeds from post-implant ct images,” Phys. Med. Biol. 10.1088/0031-9155/48/9/308 48, 1191–1203 (2003). [DOI] [PubMed] [Google Scholar]
- Miquel M. E., Rhode K. S., Acher P. L., Macdougall N. D., Blackall J., Gaston R. P., Hegde S., Morris S. L., Beaney R., Deehan C., Popert R., and Keevil S. F., “Using combined x-ray and mr imaging for prostate i-125 postimplant dosimetry: Phantom validation and preliminary patient work,” Phys. Med. Biol. 10.1088/0031-9155/51/5/005 51, 1129–1137 (2006). [DOI] [PubMed] [Google Scholar]
- Bloch B. N., Lenkinski R. E., Helbich T. H., Ngo L., Oismueller R., Jaromi S., Kubin K., Hawliczek R., Kaplan I. D., and Rofsky N. M., “Prostate postbrachytherapy seed distribution: Comparison of high-resolution, contrast-enhanced, T1- and T2-weighted endorectal magnetic resonance imaging versus computed tomography: Initial experience,” Int. J. Radiat. Oncol., Biol., Phys. 69, 70–78 (2007). [DOI] [PubMed] [Google Scholar]
- Corbett J. F., Jezioranski J. J., Crook J., Tran T., and Yeung I. W., “The effect of seed orientation deviations on the quality of 125I prostate implants,” Phys. Med. Biol. 10.1088/0031-9155/46/11/303 46, 2785–2800 (2001). [DOI] [PubMed] [Google Scholar]
- Mamou J. and Feleppa E. J., “Singular spectrum analysis applied to ultrasonic detection and imaging of brachytherapy seeds,” J. Acoust. Soc. Am. 10.1121/1.2436713 121, 1790–1801 (2007). [DOI] [PMC free article] [PubMed] [Google Scholar]
- Vautard R. and Ghil M., “Singular spectrum analysis in nonlinear dynamics, with applications to paleoclimatic time series,” Physica D 10.1016/0167-2789(89)90077-8 35, 395–424 (1989). [DOI] [Google Scholar]
- Vautard R., Yiou P., and Ghil M., “Singular-spectrum analysis: A toolkit for short, noisy chaotic signals,” Physica D 10.1016/0167-2789(92)90103-T 58, 95–126 (1992). [DOI] [Google Scholar]
- Broomhead D. and King G., “Extracting qualitative dynamics from experimental data,” Physica D 10.1016/0167-2789(86)90031-X 20D, 217–236 (1986). [DOI] [Google Scholar]
- Traxel E. J., Belani J. S., Bostwick D. G., Humphrey P. A., and Andriole G. L., “Evaluation of target scan device in prostate cancer detection,” J. Endourol 19, 918–919 (2005). [Google Scholar]
- Illing R. and Emberton M., “Sonablate-500: Transrectal high-intensity focused ultrasound for the treatment of prostate cancer,” Expert Rev. Med. Devices 3, 717–729 (2006). [DOI] [PubMed] [Google Scholar]


