

Abstract
In humans, maternal cells are present in the affected tissues of children with inflammatory myopathy, scleroderma, and neonatal lupus. It is unknown if maternal cell microchimerism (MCM) contributes to the pathology of disease. We sought to understand the factors that affect MCM to serve as a baseline for future mechanistic studies. Using a mouse model, we bred female mice transgenic for the luciferase (Luc) reporter gene to wild type (WT) males. The WT offspring were sacrificed at various postnatal ages. DNA was extracted from multiple organs and real-time PCR amplification was used to quantify Luc transgene as a marker for maternally derived cells. Sensitivity was 1 to 2 transgenic cells per 100,000 WT cells. MCM was noted in 85% of mice and 45% of tissues assayed. The average quantity of MCM was 158 maternal cells per 100,000 neonatal cells. The organs displaying the highest frequency and quantity of MCM were heart and lung (p<0.001). Postnatal age up to 21 days did not appear to affect levels of MCM (p=0.47), whereas increasing parity may increase levels of MCM. The data show that MCM is a common occurrence in healthy newborn mice, is present in their major organs, and that there are organ specific differences. This may represent differential migration of maternal cells, or varying receptivity of specific fetal organs to microchimerism. Pregnancy history appears to play a role in maternal cell trafficking. The role of MCM in pregnancy and disease pathogenesis remains to be elucidated.
Keywords: maternal cell microchimerism, mouse, real time PCR, maternal-fetal trafficking
INTRODUCTION
Microchimerism is the presence of two genetically distinct and separately derived populations of cells in the same individual or organ. This commonly occurs in patients with bone marrow transplants, recipients of blood transfusions, or twins. Maternal cell microchimerism (MCM) is the existence of maternally derived cells that are passed from the mother into the fetus, through the placenta. To date, several methods have been used to detect the presence of maternal cells in offspring, primarily relying on differences between the fetal and maternal genomes (i.e. transgenes, sex chromosomes, HLA alleles, and thyroid peroxidase alleles). Any unique genes that are present in the mother, but not present in the offspring, may be used to study MCM [1–5].
MCM in the human has been described in umbilical cord blood and in fetal blood as early as 13 weeks of gestation [1–3]. Maternal cells have been found in the liver, spleen, thymus, thyroid, and skin of four male infants that died of various congenital anomalies within the first week of life [4]. This was noted prior to receiving any blood transfusions. Many examples of human MCM exist. For example, maternal cells have been documented in the peripheral blood of male scleroderma patients as old as 49 years of age [5]. Maternal cells have also been found in the livers of patients with biliary atresia at a frequency of 2 to 4 per 25,000 cells [6]. A recent study duplicated these findings and confirmed maternal origin of these cells using HLA typing [7]. Maternal cells have been detected in the myocardium of four infants who died from congenital heart block as a sequela of neonatal lupus syndrome [8]. Even more intriguing, most of these cells also expressed a marker for cardiac myocytes. Most recently, MCM was noted in higher quantity and frequency in males with type I diabetes; these cells were shown to produce insulin [9]. These latter two studies provide evidence that microchimeric cells may have the potential to differentiate in a manner compatible with their host tissue.
Limited studies have also documented the presence of MCM in the mouse. In mice with severe combined immunodeficiency (SCID), maternal cells were noted in thymus, lung, heart, and bone marrow [10]. In immunocompetent pups, MCM has been documented in the liver, spleen, and thymus [11, 12]. Maternal cell transfer through breastfeeding has also been demonstrated [12]. Maternal cells were able to translocate across the GI tract, flow through the portal circulation and eventually localize in the liver of male offspring. Recently, the bidirectional trafficking of maternal and fetal cells has been demonstrated in mouse placentas during gestation. Maternal cells were observed in the labyrinth scattered near fetal blood spaces and the maternal blood sinuses of the spongiotrophoblast [13].
Despite the documented presence of these maternally derived cells in offspring, there has been no systematic understanding of their natural history. In the present study, we sought to understand their frequency, quantity, time course, and inter-organ differences in the neonate. Our hypothesis was that understanding factors that affect the presence of MCM will serve as a baseline for future mechanistic studies using disease models.
MATERIALS AND METHODS
Animals
The Institutional Animal Care and Use Committee (IACUC) of Tufts University School of Medicine reviewed and approved the study. All institutional guidelines regarding the ethical use and care of experimental animals were followed. Female FVB mice with the luciferase (Luc) transgene under the control of the ubiquitous cytomegalovirus (CMV) promoter were obtained from Xenogen Corporation (Alameda, CA). We bred these mice to wild type (WT) FVB male mice (Taconic Labs, Hudson, NY). As negative controls for non-specific Luc detection, WT males were bred to WT females.
Neonatal pups were phenotyped or genotyped using the methods described below. At postnatal days 1, 7, 14, and 21, mice were sacrificed using CO2 inhalation, followed by cervical dislocation. Lung, heart, liver, small bowel, spleen, kidneys, and brain were obtained by dissection. Tissues were rinsed with 1X PBS to minimize blood contamination, and approximately 25 mg of tissue (10 mg of spleen) was placed in a 2 ml tube. Some of the organs from the 1 day old mice were less than 25 mg. In this instance the entire organ was placed in a 2 ml tube. The tissues were then flash frozen in liquid nitrogen, and stored at −80°C for subsequent DNA extraction. Due to the small size of the neonatal organs, tissue homogenization was not necessary. All instruments were washed with 100% EtOH between each animal dissection, and the order of organ procurement was done in a random fashion for each animal.
Phenotyping/Genotyping
Two methods were used to identify WT pups resulting from the transgenic × WT matings. Mice were phenotyped using the IVIS Model 200 in vivo imaging system (Xenogen). Neonatal pups were injected with 250 μg of D-luciferin (Sigma-Aldrich, St. Louis, MO) and anesthetized with inhaled isoflurane. Phenotyping and genotyping yielded a clear-cut distinction between transgenic and WT mice. Only WT mice (i.e. those without luminescent signal) were chosen for the experiments.
Genotyping of the mice by real time quantitative PCR amplification of the Luc transgene was performed when phenotyping was not possible (i.e. on weekends). In this method, entire litters were sacrificed and DNA was extracted from the liver. We chose the liver as a “sentinel” organ as it is the largest solid organ in newborn mice. When real-time quantitative PCR showed strong amplification of the Luc transgene, the pup was considered to be transgenic and not used for further experiments.
DNA Extraction
Genomic DNA extraction was performed on all samples using the QIAamp® DNA Mini Kit (Qiagen, Valencia, CA) according to the manufacturer’s instructions. The only modification of their protocol was that DNA was prepared in two elutions using 100 μl of diethylpyrocarbonate (DEPC) H2O per elution. DNA was then stored at −20°C if immediate analysis was planned, or −80°C until future analysis.
Sensitivity
To test the ability to detect small quantities of transgene in a large background of WT DNA, we performed sensitivity experiments. Serial dilutions of DNA from transgenic mice ranging from 1 to 1000 pg were mixed with each of three quantities of DNA from virgin female WT mice (0, 10000 and 100000 pg) and real-time PCR amplification of the transgene was performed. Fixed amounts of DNA from WT and transgenic mice were added to mixtures based on amplification of Apob (present as two copies per cell) and Luc (present as one copy per cell), respectively. Although there is no published report of the quantity of DNA per cell from an FVB mouse, the average quantity of DNA per cell based on other strains is approximately 6 pg (14).
Real-Time PCR
Multiple primer and fluorescently labeled probe sets to the Luc transgene were developed using ABI Prism® Primer Express™ v.1.0 software by PE Biosystems (Applied Biosystems, Foster City, CA). Using the Primer Express™ penalty score, several candidate primer and probe sets were identified. BLAST searches were performed on all candidate primer and probe sets to confirm sequence identity. Conventional PCR was used to evaluate potential primer combinations. Reactions were set up in 50 μl volumes, consisting of 5 μl of DNA extracted from the livers of fully transgenic CMV-LUC mice, 20 μl of PE-ABI Taqman Master Mix, 100 μM of each primer, and 20 μl of DEPC water. Thermal cycle conditions were 50°C for 2 minutes, 95°C for 10 minutes, then 40 cycles of 95°C for 15 seconds and 60°C for 60 seconds. The PCR product was then isolated by electrophoresis on a 2% agarose gel. The primer set yielding the most distinct band was chosen.
The following primers and fluorescently labeled probe were selected to amplify the Luc transgene: 5′-TTGTGGATCTGGATACCGGG-3′ (forward primer), 5′-ACTTCAGGCGGTCAACGATG-3′ (reverse primer), and 5′-FAM-TTAATCAAAGAGGCGAACTGTGTGTGAGAGG-TAMRA-3′ (probe), where FAM is 6-carboxyfluorescein and TAMRA is 6-carboxytetramethylrhodamine.
All quantitative real-time PCR amplification was performed using an ABI 7700 Sequence Detection System with SDS v1.9 software (Applied Biosystems). Extracted DNA was first analyzed for the genomic sequence Apob, which was used to measure the quantity of total mouse DNA [15]. These experiments were done in duplicate. Reactions were set up in 50 μl volumes, consisting of 25 μl of DNA, 20 μl of Taqman Master Mix (Applied Biosystems), 100 μM of each primer, and 200 μM of probe.
In order to standardize the reaction kinetics, two different concentrations of DNA were used based on tissue specific yield. In lung, heart, spleen, and kidney, 200,000 pg per 25 μl reaction was used, and in liver, small bowel, and brain, 600,000 pg per 25 μl reaction was used. Thermal cycle conditions for all experiments consisted of 50°C for 2 minutes, 95°C for 10 minutes, then 40 cycles of 95°C for 15 seconds and 60°C for 60 seconds. All Luc PCR was done in triplicate and each reaction plate included negative controls (no template, no probe, no primer, and WT DNA for Luc PCR) and positive controls (DNA from WT animals for Apob PCR, and transgenic DNA for Luc PCR).
Tissues were considered to have MCM present if ≥ 2 wells had detectable levels of Luc transgene. If only 2 wells had detectable levels of luc transgene, samples were assayed again whenever possible. Tissues were considered to have MCM if ≥ 2 wells were again positive. Detectable levels of Luc transgene < 5.0 pg (the lowest quantity of template on the standard curve) were considered zero.
Statistical Analyses
Medians and 25th and 75th percentile ranges were generated for quantitative Luc transgene amplification measured in the lung, heart, liver, small bowel, spleen, kidney, and brain tissues for different postnatal ages. Due to skewed distribution, all measures were logarithmically transformed prior to the statistical analyses. We used a random effect mixed model to determine the effects of postnatal age, organ, and the interaction of age and organ on the development of MCM. To estimate the linear effect of postnatal time on the quantity of Luc amplification, we used the hierarchical regression model while accounting for organ source, parity, and maternal clustering. In a post-hoc analysis, we compared ratios of Luc transgene amplification between the postnatal day 1 and day 21 using Wilcoxon rank sum analysis. All statistical analyses were performed using SAS/STAT software (SAS Institute, Inc., Cary, NC).
RESULTS
Experimental Matings
A total of 10 transgenic females were mated to 3 different WT males. The matings yielded 18 litters and a total of 145 offspring. Sixty offspring were WT by either phenotyping or genotyping. Fourteen to 16 mice were sacrificed at each of the postnatal time points (Figure 1).
Figure 1.

Schematic diagram of animal matings. Shaded box indicates mice selected for experimentation.
Phenotyping/Genotyping
Phenotyping yielded a clear cut distinction between transgenic and WT mice (Figure 2). Genotyping using real time quantitative PCR showed strong amplification of the Luc transgene (>300,000 pg/5 μl) in transgenic pups. If there was luminescence noted on IVIS imaging or real time quantitative PCR showed strong amplification of Luc transgene, these pups were identified as inheriting the transgene. In mice inheriting the transgene, maternal cells, also possessing the transgene would not be discernable. These pups were excluded from further experiments.
Figure 2. In vivo imaging of mice on postnatal day 1.
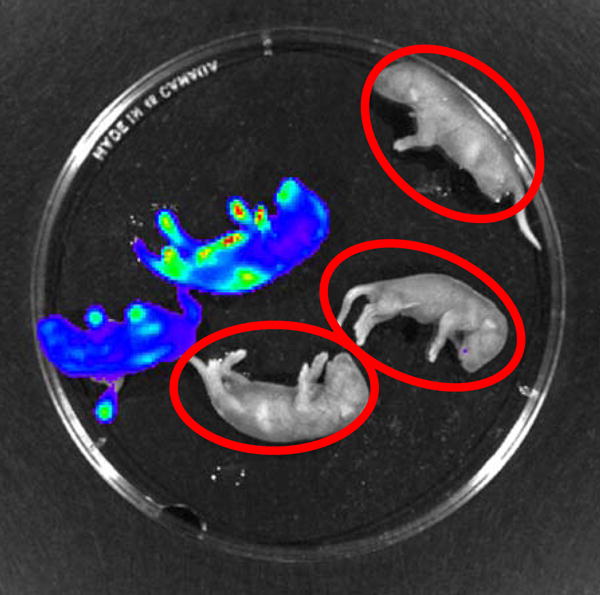
The mice emitting the blue-green color carry the Luc transgene. The mice circled in red are wild-type mice and were selected for the experiments.
Sensitivity
The sensitivity of PCR detection of the Luc transgene was established as 1 to 2 pg per 100,000 picograms of total DNA. Based on an average quantity of 6 pg per cell for both WT and transgenic strains, and the Luc transgene being present at one copy per cell and the Apob sequence at two copies per cell, this sensitivity allowed for the detection of approximately 2 to 4 microchimeric transgenic cells in a background of 100,000 WT cells (Supplemental Table 1). Regression analysis showed that the quantities of Luc transgene determined by PCR amplification at all concentrations of mixed transgenic and WT DNA were highly correlated to the calculated amounts of transgenic DNA added to each reaction (r2=0.90)
Negative controls
Four WT × WT matings yielded 33 pups. All pups were phenotyped, and no pups had evidence of luciferase luminescence on IVIS imaging. Five pups from each litter were sacrificed at various postnatal time points. Two of the 140 tissues assayed showed low levels of Luc transgene. This occurred in the heart sample of two mice sacrificed at postnatal day 14. Although this may be the result of contamination from residual cells left on the dissecting instruments, it is also possible that the false positive rate of our assay is 2 of 140.
Microchimerism
Transgenic maternal cells were present in 51 of 60 (85%) of WT mice and in 190 of 420 (45%) WT tissues assayed (Table 1). Every organ was represented, and MCM was seen in at least one organ at each postnatal age. The average quantity of transgenic DNA per organ was 1979 pg per μg of total DNA assayed. This is equivalent to an average of 158 maternal cells per 100,000 neonatal cells (Supplemental Table 2).
Table 1.
Proportion of newborn mice with detectable maternal cell microchimerism
| Postnatal age (days) | ||||
|---|---|---|---|---|
| Organ | 1 | 7 | 14 | 21 |
| Heart | 10/16 (63) | 11/15 (73) | 6/14 (43) | 10/15 (67) |
| Lung | 10/16 (63) | 12/15 (80) | 8/14 (57) | 11/15 (73) |
| Brain | 3/16 (19) | 10/15 (67) | 4/14 (28) | 10/15 (67) |
| Liver | 7/16 (44) | 9/15 (60) | 7/14 (50) | 7/15 (47) |
| Kidney | 9/16 (56) | 5/15 (33) | 6/14 (43) | 7/15 (47) |
| Spleen | 3/16 (19) | 6/15 (40) | 2/14 (14) | 3/15 (20) |
| Sm Bowel | 6/16 (38) | 3/15 (20) | 1/14 (7) | 4/15 (27) |
pups positive for maternally-inherited luciferase transgene/total number of pups analyzed (%).
We observed organ to organ differences in quantities of MCM. The heart and lung tissues exhibited greater quantities of MCM than all other organs (p<0.001). MCM in heart and lung tissues were not statistically significantly different from one another (p=0.63).
When each organ was analyzed for postnatal age, there was no statistically significant linear effect on levels of MCM (Table 2). No significant interacting effect of age with organ on the occurrence of MCM was detected (p=0.24). Furthermore, when all 7 organs from a single animal were analyzed, there was no statistically significant linear effect of postnatal age (p=0.47).
Table 2.
Median quantity of maternal cell microchimerism in organs from newborn mice
| Postnatal Age (days) | |||||||||
|---|---|---|---|---|---|---|---|---|---|
| 1 | 7 | 14 | 21 | ||||||
| Organ | Median | (25–75%) | Median | (25–75%) | Median | (25–75%) | Median | (25–75%) | p value* |
| Heart | 122.29 | (0–3101) | 482.90 | (0–1385) | 0.00 | (0–248) | 224.30 | (0–581) | 0.89 |
| Lung | 175.28 | (0–1086) | 259.60 | (78–2381) | 58.80 | (0–430) | 89.68 | (0–292) | 0.49 |
| Brain | 0.00 | (0–0) | 106.13 | (0–823) | 0.00 | (0–14) | 53.07 | (0–118) | 0.15 |
| Liver | 0.00 | (0–267) | 33.14 | (0–112) | 5.31 | (0–295) | 0.00 | (0–44) | 0.86 |
| Kidney | 55.31 | (0–717) | 0.00 | (0–88) | 0.00 | (0–90) | 0.00 | (0–312) | 0.79 |
| Spleen | 0.00 | (0–0) | 0.00 | (0–556) | 0.00 | (0–0) | 0.00 | (0–0) | 0.63 |
| Sm Bowel | 0.00 | (0–59) | 0.00 | (0–0) | 0.00 | (0–0) | 0.00 | (0–18) | 0.75 |
Concentrations presented as pg of Luc transgene per μg of ApoB
Linear regression of log-transformed quantities adjusted for parity
Except for the kidney and small bowel, there was a trend toward peak median microchimerism on postnatal day 7, a nadir on day 14, and recovery of levels similar to day one by postnatal age 21 (Table 2). This pattern in the brain was statistically significant (p=0.01).
The original study design did not establish groups according to parity for each female mouse. Statistical analysis, however, accounted for multiple factors, and suggested that advancing maternal parity may be associated with a trend toward increased MCM (Figure 3).
Figure 3.

Effect of the number of pregnancies (parity) on maternal cell microchimerism.
DISCUSSION
Although MCM in humans was initially noted in the 1960’s when karyotyping of male infants revealed the presence of maternal cells [16, 17], no systematic study of the factors that influence the presence of microchimerism has been done. Baseline characteristics such as the number of maternal cells present, temporal factors, and susceptible organs have not yet been definitively established. The lack of feasibility in humans necessitated the use of an animal model.
The small number of microchimeric transgenic cells and their likely diffuse populations were well below the limit of detection by in vivo imaging. Therefore, we developed a novel real time quantitative PCR technique for the Luc transgene that was extremely sensitive. By achieving a sensitivity of 1 to 2 microchimeric cells per 100,000 WT cells, we were able to detect greater frequency and greater quantities of MCM than previously described. Although Shimamura et al. were able to detect 0.3% microchimeric cells in the spleen (we detected 0.12%), they we unable to detect microchimeric cells in other organs [11]. Zhou et al. detected 0.015% microchimeric cells in the liver using fluorescent microscopy of GFP+ cells [12], while we detected 0.034%.
Our results show that MCM is a common finding in healthy newborn mice. MCM was seen in the majority of mice assayed (85%). It is possible that by assaying a greater quantity of DNA, our ability to detect MCM would have improved. The inherent limitation in the quantity of DNA available from the small organs of the 1 day old mice however, limited our ability to do this. Nevertheless, the 85% frequency is similar to the frequency of maternal cells detected by flow cytometry in SCID mice at 20 days’ gestation [10]. These investigators postulated that the immunocompromised state of their mice increased their quantity of microchimerism. The high frequency of MCM in our study was seen in healthy newborn mice, and may reflect greater sensitivity of current techniques. Furthermore, MCM was detected in 45% of all tissues assayed, and every tissue type assayed was represented. Our study showed that MCM was frequently present in multiple major organ systems of healthy mice.
The higher level of MCM observed in heart and lung is intriguing. This may reflect a differential ability for an organ to host microchimeric cells, or may represent preferred sites of cell deposition. It does not support a simple blood flow model of cell deposition where one would expect the first organ encountered to have the highest amount of MCM. In the fetal circulation, the liver is the first organ encountered. Several groups have shown a predominance of MCM in immunologically active organs (thymus, spleen, liver, bone marrow) [10, 12, 18]. This predominance has led to speculation that microchimeric cells may be leukocytes that have crossed the placenta. In our study, heart and lung had greater quantities of MCM when compared to the liver and spleen. This may be partially explained by the greater sensitivity of real time quantitative PCR, when compared to the other methods used. Furthermore, we quantified MCM in seven solid organs using uniform methods that allowed for comparison of inter-organ differences. The predominant type of microchimeric cells needs to be investigated.
MCM did not decrease with increased postnatal age. This was an unexpected finding that differs from fetal cell microchimerism (FCM). In FCM, the highest levels appear immediately post-partum, decline in number, and appear to achieve a low steady state [15]. In many organs the level of MCM initially increased from postnatal day 1 to 7. It is possible that this is a period of time that the maternally derived cells are migrating from the circulation and localizing in specific organs. It is also possible that microchimeric cells increase due to maternal cell transmission via breastfeeding [12]. The trend towards a nadir at 14 days and subsequent recovery of levels may reflect the targeting of microchimeric cells by the naive newborn immune system, the development of immune tolerance, and the acquisition of a steady state. Wan et al. postulated that maternal cells are less well recognized or even tolerated by the immature immune system of newborn mice [18]. As such, they may play a role in immunologic development and regulation. Although this is speculation, the varying levels of MCM may indicate an intentional selection or tolerance for these cells to persist. This study was designed to describe the pattern of MCM in newborn mice. Future studies examining mice at older postnatal ages may be helpful in describing the potential steady state, organ to organ fluctuation, and attrition of MCM across the lifespan of an organism. In addition, the incorporation of techniques such as immunohistochemistry to assess for cellular phenotype would be useful to further evaluate MCM. Nevertheless, our data do not suggest that these cells are decreasing in number, as one would expect if they were being cleared.
This study was not designed to examine an effect of advancing parity on MCM. A non-random distribution of parity in the different postnatal time points may confound the data, so the results must be interpreted with caution. Regardless, it is interesting to note the trend of higher levels of MCM with advancing parity. This may simply be the effect of repeated placentation and increased cell trafficking by virtue of increased placental porosity, or may be evidence of increasing immune tolerance. It may also be an effect of advancing maternal age. In mice, advanced parity has been associated with higher levels of feto-maternal cell trafficking [15]. Parity may affect cell trafficking and warrants further study.
Future studies should take into account additional factors such as maternal age at delivery, and newborn mouse weights. These factors are potential markers of abnormal placentation. Studies in humans have shown increased cellular trafficking in pregnancies associated with abnormal placentation [19], with maternal age, fetal aneuploidy, and intrauterine growth restriction being important factors. It is not known if the pregnancies in this study were normal or complicated. Maternal pregnancy history may play a role in MCM and should be accounted for in the future. In addition, further technical optimization (e.g. real-time PCR parameters) may also be helpful to maximize sensitivity and specificity for the detection of very rare microchimeric DNA sequences.
This study shows that MCM is a more common occurrence than previously believed. Maternal parity and neonatal organ-specific factors influence levels of MCM. While the specific role of these cells is at present unknown, their widespread and consistent presence suggests that they may have a biological role in the newborn.
Supplementary Material
Acknowledgments
The authors would like to thank Inga Peter for her assistance with statistical analysis, Ellen Miller for her technical expertise with our mouse model, and the Division of Newborn Medicine, Floating Hospital for Children, Boston, MA for its support.
Footnotes
Supported by NIH HD049469-02
References
- 1.Hall JM, Lingenfelter P, Adams SL, Lasser D, Hansen JA, Bean MA. Detection of maternal cells in human umbilical cord blood using fluorescence in situ hybridization. Blood. 1995;86:2829–2832. [PubMed] [Google Scholar]
- 2.Petit T, Gluckman E, Carosella E, Brossard Y, Brison O, Socie G. A highly sensitive polymerase chain reaction method reveals the ubiquitous presence of maternal cells in human umbilical cord blood. Exp Hematol. 1995;23:1601–1605. [PubMed] [Google Scholar]
- 3.Lo ES, Lo YM, Hjelm NM, Thilaganathan B. Transfer of nucleated maternal cells into fetal circulation during the second trimester of pregnancy. Br J Haematol. 1998;100:605–606. doi: 10.1046/j.1365-2141.1998.0636a.x. [DOI] [PubMed] [Google Scholar]
- 4.Srivatsa B, Srivatsa S, Johnson KL, Bianchi DW. Maternal cell microchimerism in newborn tissues. J Pediatr. 2003;142:31–35. doi: 10.1067/mpd.2003.mpd0327. [DOI] [PubMed] [Google Scholar]
- 5.Maloney S, Smith A, Furst DE, Myerson D, Rupert K, Evans PC, Nelson JL. Microchimerism of maternal origin persists into adult life. J Clin Invest. 1999;104:41–47. doi: 10.1172/JCI6611. [DOI] [PMC free article] [PubMed] [Google Scholar]
- 6.Suskind DL, Rosenthal P, Heyman MB, Kong D, Magrane G, Baxter-Lowe L, Muench MO. Maternal microchimerism in the livers of patients with biliary atresia. BMC Gastroenterology. 2004;4:14. doi: 10.1186/1471-230X-4-14. [DOI] [PMC free article] [PubMed] [Google Scholar]
- 7.Kobayashi H, Tamatani T, Tamura T, Kusafuka J, Yamataka A, Lane GJ, Kawasaki S, Ishizaki Y, Mizuta K, Kawaraski H, Gittes G. Maternal microchimerism in biliary atresia. J Ped Surgery. 2007;42:987–991. doi: 10.1016/j.jpedsurg.2007.01.051. [DOI] [PubMed] [Google Scholar]
- 8.Stevens AM, Hermes HM, Rutledge JC, Buyon JP, Nelson JL. Myocardial-tissue-specific phenotype of maternal microchimerism in neonatal lupus congenital heart block. Lancet. 2003;362:1617–1623. doi: 10.1016/S0140-6736(03)14795-2. [DOI] [PubMed] [Google Scholar]
- 9.Nelson JL, Gillespie KM, Lambert NC, Stevens AM, Loubiere LS, Rutledge JC, Leisenring WM, Erickson TD, Yan Z, Mullarkey ME, Boespflug ND, Bingley PJ, Gale EA. Maternal microchimerism in peripheral blood in type 1 diabetes and pancreatic islet beta cell microchimerism. Proc Natl Acad Sci USA. 2007;104:1637–1642. doi: 10.1073/pnas.0606169104. [DOI] [PMC free article] [PubMed] [Google Scholar]
- 10.Piotrowski P, Croy BA. Maternal cells are widely distributed in murine fetuses in utero. Biol Reprod. 1996;54:1103–1110. doi: 10.1095/biolreprod54.5.1103. [DOI] [PubMed] [Google Scholar]
- 11.Shimamura M, Ohta S, Suzuki R, Yamazaki K. Transmission of maternal blood cells to the fetus during pregnancy: detection in mouse neonatal spleen by immunofluorescence flow cytometry and polymerase chain reaction. Blood. 1994;83:926–930. [PubMed] [Google Scholar]
- 12.Zhou L, Yoshimura Y, Huang Y, Suzuki R, Yokoyama M, Okabe M, Shimamura M. Two independent pathways of maternal cell transmission to offspring: through placenta during pregnancy and by breastfeeding after birth. Immunology. 2000;101:570–580. doi: 10.1046/j.1365-2567.2000.00144.x. [DOI] [PMC free article] [PubMed] [Google Scholar]
- 13.Vernochet C, Caucheteux SM, Kanellopoulos-Langevin C. Bi-directional cell trafficking between mother and fetus in mouse placenta. Placenta. 2007;28:639–649. doi: 10.1016/j.placenta.2006.10.006. [DOI] [PubMed] [Google Scholar]
- 14.Capparelli R, Cottone C, D’Apice L, Viscardi M, Colantonio L, Lucretti S, Iannelli D. DNA content differences in laboratory mouse strains determined by flow cytometry. Cytometry. 1997;29:261–266. doi: 10.1002/(sici)1097-0320(19971101)29:3<261::aid-cyto9>3.0.co;2-e. [DOI] [PubMed] [Google Scholar]
- 15.Khosrotehrani K, Johnson KL, Guegan S, Stroh H, Bianchi DW. Natural history of fetal cell microchimerism during and following murine pregnancy. J Reprod Immunol. 2005;66:1–12. doi: 10.1016/j.jri.2005.02.001. [DOI] [PubMed] [Google Scholar]
- 16.Turner JH, Wald N, Quinlivan WL. Cytogenetic evidence concerning possible transplacental transfer of leukocytes in pregnant women. Am J Obstet Gynecol. 1966;95:831–833. doi: 10.1016/0002-9378(66)90086-x. [DOI] [PubMed] [Google Scholar]
- 17.el-Alfi OS, Hathout H. Maternofetal transfusion: immunologic and cytogenetic evidence. Am J Obstet Gynecol. 1969;103:599–600. doi: 10.1016/s0002-9378(15)31866-4. [DOI] [PubMed] [Google Scholar]
- 18.Wan W, Shimizu S, Ikawa H, Sugiyama K, Yamaguchi N. Maternal cell traffic bounds for immune modulation: tracking maternal H-2 alleles in spleens of baby mice by DNA fingerprinting. Immunology. 2002;107:261–267. doi: 10.1046/j.1365-2567.2002.01499.x. [DOI] [PMC free article] [PubMed] [Google Scholar]
- 19.Bianchi DW, Williams JM, Sullivan LM, Hanson FW, Klinger KW, Shuber AP. PCR quantitation of fetal cells in maternal blood in normal and aneuploid pregnancies. Am J Hum Genet. 1997;61:822–829. doi: 10.1086/514885. [DOI] [PMC free article] [PubMed] [Google Scholar]
Associated Data
This section collects any data citations, data availability statements, or supplementary materials included in this article.