

Summary
The general transcription factor TFIID is a large multi-subunit complex required for the transcription of most protein-encoding genes by RNA polymerase II. Taking advantage of a TFIID preparation partially depleted in the initiator-binding Taf2p subunit we determined the conformational and biochemical variations of the complex by electron tomography and cryo electron microscopy of single molecules. Image analysis revealed the extent of conformational flexibility of the complex and the selection of the most homogeneous TFIID subpopulation allowed us to determine an improved structural model at 23Å resolution. This study also identified two subpopulations of Taf2p-containing and Taf2p-depleted TFIID molecules. By comparing these two TFIID species we could infer the position of Taf2p, which was confirmed by immuno-labeling using a subunit-specific antibody. Mapping the position of this crucial subunit in the vicinity of Taf1p and of TBP sheds new light on its role in promoter recognition.
Introduction
The general transcription factor TFIID is a multisubunit protein required for the initiation of eukaryotic DNA transcription by RNA polymerase II (Pol II). In the yeast Saccharomyces cerevisiae, TFIID is essential for both cell viability and ongoing high-level mRNA gene transcription. Consistent with these observations genome-wide chromatin immunoprecipitation location analyses (ChIP-chip) have demonstrated that in vivo TFIID is resident on most active mRNA gene promoters (Zanton and Pugh, 2006). Similarly in higher eukaryotes, the null alleles of TFIID components lead to lethality through early embryogenesis defects (Mohan et al., 2003). ChIP-chip studies performed with human cells have shown that ~90% of scored mRNA gene promoters were occupied by TFIID (Kim et al., 2005). Thus TFIID is utilized extensively for Pol II-mediated mRNA gene transcription.
TFIID is composed of the TATA box binding protein (TBP) and 14 TBP-associated factors (Tafs) whose sequences are conserved from yeast to humans (Burley and Roeder, 1996). In a reconstituted in vitro system, TBP by itself can direct the formation of a transcriptional pre-initiation complex (PIC) when combined with the five general transcription factors (GTFs) TFIIA, -B, -E, -F and –H, and will support RNA polymerase II initiation from a TATA box-containing promoter (Hampsey and Reinberg, 1999). However, this basal transcription system fails to respond to activators, and only poorly transcribes genes that do not contain TATA-elements (Juven-Gershon et al., 2008). Recent experiments demonstrate crosstalk between modified nucleosomes and mammalian TFIID through an interaction between the PHD finger of Taf3p and trimethylated histone H3 at lysine 4 (Vermeulen et al., 2007). Although an explicit role for TFIID in histone acetylation lacks direct in vivo evidence, the histone acetyl transferase domain of Taf1p is capable of acetylating the N-termini of free or nucleosomal histones (Mizzen et al., 1996). Numerous reports, using various in vivo contexts and readouts have documented that several Tafs, in particular Taf4p and Taf12p, contribute to transcriptional activation (Hamard et al., 2005; Mengus et al., 1997; Taatjes et al., 2004; Voulgari et al., 2008). A direct interaction was documented in S. cerevisiae between the transcription transactivator Rap1p and the Taf4p, 5p and 12p components of highly purified TFIID (Garbett et al., 2007). These findings identify TFIID as a major transcriptional coactivator that can respond to several distinct biological pathways.
Tafs have been shown to assist TBP in promoter DNA binding showing that TFIID is a core promoter recognition complex (Lee et al., 2005; Martinez et al., 1994). Taf1p and Taf2p can form a subcomplex with TBP that specifically binds to promoter DNA in vitro (Chalkley and Verrijzer, 1999). The Taf2p subunit was shown to interact specifically with the Initiator (Inr) element found at the transcription start site of many genes (Oelgeschlager et al., 1996; Purnell et al., 1994; Sypes and Gilmour, 1994; Verrijzer et al., 1994). For these reasons it has been hypothesized that Taf2p-Inr interactions play a key role in both promoter binding and start site selection (Hansen and Tjian, 1995).
The studies described in this report were aimed at elucidating the location of Taf2p within the yeast TFIID (yTFIID) complex. Taf2p is the only integral TFIID subunit whose location within the complex has yet to be determined (Leurent et al., 2004). Given the large size (Mr=161 kDa) and key functionalities of Taf2p in promoter recognition noted above, there is a clear need to map the location of this subunit in the TFIID holocomplex. The complexity of TFIID has prevented structure determination by X-ray crystallography, and thus far electron microscopy has provided the only available structural models (Andel et al., 1999; Brand et al., 1999). Image analysis of isolated yTFIID molecules revealed a three-dimensional (3-D) model at 32Å resolution (Leurent et al., 2002). Human TFIID (hTFIID) was recently investigated in cryo electron microscopy but the resolution was not dramatically improved over that obtainied for yTFIID (Grob et al., 2006). The authors described considerable conformational flexibility within hTFIID, which is a major limitation for high-resolution structural determination.
In the present work the structural variability of a TFIID preparation partially depleted in Taf2p was studied. This analysis allowed us to discriminate between two major contributions to structural variations: the conformational flexibility of the TFIID molecule and the lack of Taf2p. An additional domain was identified in some yTFIID molecules, and immuno-labeling demonstrated that this domain mapped to the N-terminal portion of Taf2p. The N-terminus of Taf2p bears sequence homology with the M1 family of metallopeptidases (Callebaut et al., 2005) whose atomic structure has been solved. This homology domain could be fitted into the additional density generated by Taf2p. The Taf2p content thus appears as a major source of specimen heterogeneity and the selection of a homogeneous Taf2p-containing TFIID subpopulation allowed us to significantly improve the resolution of the TFIID model to 23Å.
Results
Taf2p Heterogeneity in TFIID Prepared by Different Procedures
During the course of pilot experiments to explore alternative purification strategies for yeast TFIID we observed large variations in the stoichiometry of the Taf2p subunit relative to our standard TFIID preparation. Our standard TFIID purification method used a yeast strain expressing an N-terminally HA1-tagged Taf1p and involved Bio-Rex 70, anti-HA mAb and Mono-S FPLC chromatography (Sanders et al., 2002; Sanders and Weil, 2000). To investigate the use of the Tandem Affinity Purification (TAP) method for TFIID purification, we utilized a yeast strain expressing C-terminally TAP-tagged Taf1p (Rigaut et al., 1999). The TAP method was optimized for TFIID solubilization and overall yield. We often observed reduced amounts of Taf2p relative to Taf1p in the TAP-purified TFIID (see Sypro Ruby stained SDS-PAGE, Figure 1A). Quantitation of the amounts of these two Tafs in the various preparations confirmed this observation; the Taf2p/Taf1p content of HA-TFIID was 0.7 compared to TAP-TFIID preparations A (Taf2/Taf1p = 0.1) and B (Taf2/Taf1p = 0.4). It is likely that Taf2p is preferentially lost from the TFIID complex. Such loss of the full-length Taf2p subunit was observed previously by Smale and colleagues who have reported that human Taf2p, which they termed CIF, readily dissociates from hTFIID (Kaufmann et al., 1996). We have observed a similar phenomenon; a fraction of yeast Taf2p dissociated from yeast TFIID during ion exchange chromatography, perhaps in association with other TFIID subunits (Figure 1B; compare Taf2p/Taf1p amounts (asterisks) in the Mono-S Input (In) versus amounts in gradient Fractions, 4, 5–10). Together these results suggest that complete loss of the Taf2p subunit is the most likely explanation for the reduced stoichiometry of this subunit in the case of the TAP-purified TFIID. The different TFIID preparations were found to contain negligible amounts of DNA (Supplemental Figure S1) indicating that variable DNA content does not introduce additional variations.
Figure 1.

Heterogeneity in Taf2p content in TFIID purified by different methods.
(A) Sypro Ruby stained SDS-PAGE gel showing the subunit content of either HA-tagged Taf1p (HA) or TAP-tagged Taf1p (two independent preparations, TAP-A and TAP-B) purified TFIID. MW standards were run in parallel (MW) and the TFIID subunits are labeled. The stained gel was scanned (BioRad FX imager) and Taf1p and Taf2p content determined using QuantityOne software (BioRad). (B) Apparent dissociation of a portion of Taf2p from the TFIID holocomplex during Mono-S FPLC chromatography. CaM-Sepharose eluted TAP-TFIID was subjected to Mono-S FPLC chromatography and eluted with 1M NaCl as shown. The protein composition of the fractionated TFIID was measured by SDS-PAGE as in panel A; Fraction number, Molecular weight standards (MW), Input to Mono-S column (In) and unbound proteins (BT) indicated. The Taf2p and Taf1p subunits in the Mono-S 1M salt-eluted fractions are indicated by asterisks.
Single particle tomography
We decided to use the observed Taf2p subunit deficiency to our advantage given that otherwise the TFIID subunit composition of the TAP-TFIID was normal (cf. Figure 1A). We reasoned that image analysis of the TFIID preparation partially depleted in Taf2p should reveal different particle populations and identify the location of the subunit within the holocomplex. The TAP-A-TFIID preparation is likely to contain two major forms of structural variation: biochemical differences in Taf2p content and conformational changes. Standard image analysis of molecular views is unable to resolve such complex variation since most views cannot be unambiguously attributed to a given species. Consequently we used electron tomography of single particles to experimentally reveal these different TFIID populations. This method generates a low resolution 3-D model for each individual particle. A total of 157 individual molecular volumes were reconstructed from a field of negatively stained TAP-A-TFIID molecules. These volumes were aligned one with respect to the others using a combination of interactive and correlation based methods (Supplemental Figure S2). The aligned volumes were classified into 28 groups according to maximal interclass resemblance and an average volume was calculated for each class. As a consequence of the limited resolution (estimated to be 50 Å on average) only large 3-D variations could be detected (Figure 2A). In general the volumes showed a three-lobed organization as reported previously, although 4 out of the 28 volumes apparently lacked one lobe, and the relative size of the lobes was found to be highly variable. The enclosed angle between the three lobes and the distance between the centers of the external lobes A and B also showed large variations. In the most closed conformation the distance between the lobes is 100 Å and the enclosed angle is 53°, whereas in the most open conformation the distance between lobe A and B is 220 Å and the enclosed angle is 115°.
Figure 2.
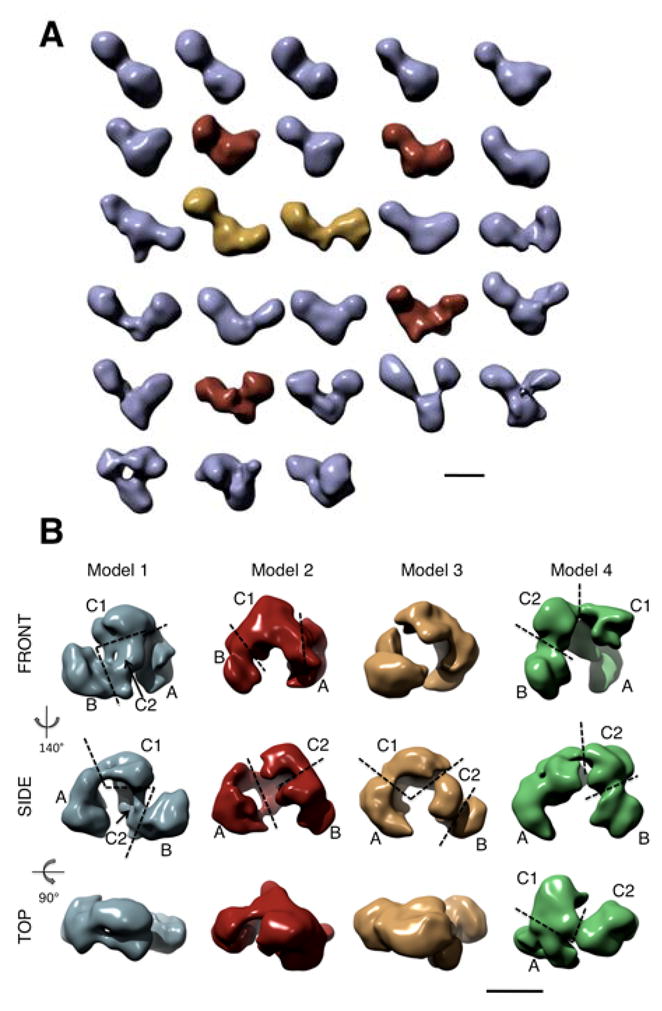
Structural variants of TFIID.
(A) Gallery of TFIID volumes obtained by electron tomography of negatively stained particles. The 28 represented volumes are averages obtained upon clustering of a total of 157 aligned individual volumes. The six volumes that were most frequently used in the refinement are colored differently; those which were progressively less used in the later refinement and discarded are in yellow whereas the four major variants are in red. (B) Four major structural variants obtained upon analysis of an image dataset of frozen hydrated, negatively stained TFIID molecules. All four models show three-lobes (A, B and C) and lobe C is separated into two domains (C1 and C2). The dashed lines represent the limits of each domain. The bars represent 10 nm.
The volumes obtained by electron tomography of single molecules provide a repertoire of the most extreme conformations that can be found in the TAP-A-TFIID preparation. The observed variability is likely to reflect the full range of conformational space as well as the biochemical variations of the data set plus any possible structural perturbations introduced by the preparation method.
Analysis of the TFIID structural variants in negatively stained, frozen hydrated samples
In order to reveal greater structural detail, and to improve the statistical significance of the tomography volumes, we analyzed a large image dataset of 44,233 single particles for which two parameters were modified to reduce preparation-induced specimen variability (Supplemental Figure S3). Firstly the TFIID molecules were observed under negative stain cryo-electron microscopy conditions in order to preserve the hydrated structure of the particle (Golas et al., 2005). Secondly the molecules were chemically cross-linked according to the GraFix method (Kastner et al., 2008) in order to lock the complex in a reduced number of conformational states. The tomographic volumes were utilized to sort the particle images into different categories and to verify which structural variants were present. Among the 28 average tomographic volumes, only 6 were used extensively since 75% of the images aligned with highest correlation against references issued from these volumes. The remaining 22 volumes were each used by less than 5% of the images and were discarded from further analysis. Upon refinement two of the six models were progressively less used and were discarded once they attracted less than 5% of the images. Four stable TFIID populations were thus identified, and a 3-D model was reconstituted for each (Figure 2B). These results suggest that dehydration is likely to be the source of a large part of the variation found in the tomographic volumes, and that only a limited fraction of the particles adopt the most extreme conformations after chemical cross-linking.
The four remaining models are organized as a molecular clamp formed by three or four successive lobes (A, B, C1 and C2) but differ significantly in the relative position of the lobes since the distance between the centers of the external lobes varied from 140 Å to 159 Å. When the same intensity threshold is set to all models, model 4 was found to be larger than the three other models. Models 1, 2 and 3 comprise an average volume of 910 nm3 (911, 891 and 927 nm3, respectively) whereas the volume of model 4 is 1027 nm3, a value 6.5σ above the average volume of the other models. This indicates that the TFIID molecules contributing to model 4 enclose an additional mass. The direct superposition of the models however, was not possible because of the complex structural transition experienced by TFIID (Figure 2B). The 3-D models were therefore split into four subdomains that were consistently observed in order to align the domains one with respect to the others and to analyze the TFIID rearrangements more accurately (Figure 3A). The A-lobes issued from models 1–3 have a similar beak-like shape of 10.5 by 6 by 6 nm in size and occupy an average volume 332 nm3 (σ = 3.2%) whereas in model 4 the A-lobe appears slimmer and occupies a volume of 247 nm3 (Figure 3C). The volume of the B-lobes was stable in all models (206 nm3, σ = 5.6%) and their shape was also fairly similar except for model 2 in which it appeared split into two sub-domains and thus more elongated. Lobe C showed the largest variability in size and shape and could be divided into two modules, C1 and C2, whose relative orientations vary, suggesting that these modules can move as independent entities. Whereas the C1- and C2-lobes from models 1–3 were similar in size with an average volume of 252 nm3 (σ = 7.6%) and 118 nm3 (σ = 14.2%) respectively, these two lobes were larger in the case of model 4. While the size of lobe C1 showed a moderate increase of 49 nm3 (2.6 σ above the average of models 1–3), the volume of lobe C2 more than doubled with an increase of 158 nm3 (9.3 σ above the average of models 1–3).
Figure 3.

Comparison of the obtained TFIID models.
(A) Dissection of TFIID model 3 into 4 sub-domains A, B, C1 and C2. (B) Table showing the volume occupied by the different lobes A, B, C1 and C2. The average volume (Average) of a given lobe as well as the standard deviation (σ) are shown in the last rows. Note that for lobe C2 these values were calculated from models 1, 2 and 3 only. The columns labeled “Δ/σ” represent the difference between the volume of a lobe and the average volume of that lobe normalized by the associated standard deviation. (C) Alignment of lobes A, B and C dissected from all four TFIID models showing their structural homology. (D) Fitting of TFIID model 3 into the envelope of the larger model 4 reveals two additional densities (highlighted by asterisks; *) in lobe C; colors, red, blue, yellow and brown represent lobes B, C2, C1 and A, respectively. Bar indicates 2 nm, model bottom was rotated 97° relative to top model
Altogether, these results indicate that model 4 comprises an additional protein density in lobe C2. In order to better delineate the additional density and to compensate for the flexibility of the structure, the dissected lobes from model 3 were individually positioned into model 4. This flexible domain docking revealed two additional protuberances present only in model 4: a large one in lobe C2 and a smaller one that connects lobe C1 to the A-lobe (indicated by asterisks in Figure 3D).
In order to assess whether the structural heterogeneity found in the TAP-A-TFIID preparation is related to the Taf2p depletion detected by the biochemical data, we analyzed the relative abundance of the four major TFIID populations within an image dataset of the HA-TFIID preparation that contains a higher Taf2p complement. Model 4, which represents 23% of the TAP-A-TFIID preparation, increased to 55.2% in the HA-TFIID preparation indicating that the largest TFIID structure is more abundant in the preparation that contains more Taf2p thus confirming that the additional protein domain found in model 4 reflects the presence of this subunit. Model 4 is thus the most comprehensive TFIID structure and was therefore further refined to reach the model shown in Figure 6, Supplemental Figure S3 and movie S1. The resolution tests for this model calculated from 10,205 images gave values of 23 Å and 19 Å for the 0.5 Fourier shell correlation and the half-bit criteria, respectively. Interestingly the size of the additional domain located between the C1 and A lobes increased significantly upon refinement.
Figure 6.

Molecular environment of Taf2p within TFIID
(A) Alignment of the previous TFIID volume (lower row; violet) with the higher resolution model described in this report (upper row; yellow); the three lobes of the structure A, B and C are labeled. (B) Localization of Taf2p relative to previously mapped Taf1p and TBP. (C) Identification of a crescent-shaped TFIID subcomplex obtained upon removal of the Taf1p, Taf2p and TBP densities.
Antibody labeling of Taf2p
To further confirm that the additional density in model 4 corresponded to Taf2p, HA-TFIID was labeled with an antibody raised against a peptide corresponding to residues 5–19 of Taf2p (Supplemental Figure S4). The specific immune complexes formed upon incubating the peptide affinity-purified antibodies with TFIID were negatively stained and visualized by electron microscopy. A total of 1,600 individual TFIID-IgG images were selected and aligned against references issued from model 4, which we hypothesized contained the full length Taf2p. After image clustering, the class-averages where the antibody was clearly bound to TFIID were used to calculate a 3-D map in which the position of the antibody binding site could be determined by density difference with the unlabeled model 4 (Figure 4A). The bound antibody highlighted the additional density present in the C2-lobe of model 4, a result consistent with the hypothesis that this density defines the Taf2p subunit of TFIID.
Figure 4.

TFIID immunolabeling with Taf2 antibody
(A) Immunolabeling of TFIID by an antibody directed against the N-terminus of Taf2p. The 3-D model of TFIID is represented in yellow and the red surface represents the difference map between the antibody-labeled TFIID and the unlabeled complex. (B) Alignment between Leukotriene A4 hydrolase and human Taf2p. The conserved amino acids are highlighted. (C) Docking of the atomic structure of the leukotriene A4 hydrolase domain that is homologous to the N-terminal part of Taf2p into the additional density present in lobe C2 of model 4 shown in teal. The bars represent 2 nm; indicated in red is the additional density of the anti-Taf2p IgG.
The peptide used to generate the antibody overlaps with the first six residues of the leukotriene A4 hydrolase homology domain. This homology extends over Taf2p residues 11–533, and the entire conserved catalytic region defining the M1 protease family (residues 1–458 of leukotriene A4 hydrolase). This region comprises structural domains A and B in the crystal structure of the protease (Thunnissen et al., 2001). The homology between Taf2p and leukotriene A4 hydrolase is substantial since overall, 18% of the residues are identical for the two domains. Moreover, the pattern of hydrophobic core residues of the protease appears well conserved while the identity of important residues in turns (predominantly Pro and Gly) and numerous acidic and basic residues that form intramolecular salt bridges in the crystal structure have also been conserved between the two proteins (Figure 4B). Taken together, these observations indicate that Taf2p is likely to adopt a ternary structure highly similar to the A and B domains of leukotriene A4 hydrolase. No significant homology exists between the remainder of the Taf2p sequence and the additional domain in the crystal structure, which is specific to the leukotriene A4 hydrolase subfamily of the M1 proteases. The docking of the atomic structure indicated that the additional density revealed in model 4 has a size large enough to accommodate the human Leukotriene A4 hydrolase domain (Figure 4C). Thus the slightly elongated and asymmetric shape of the domain fits within the external contours of the C2 domain envelope, thereby providing additional constraints for a precise positioning of the atomic structure. Together these experiments indicate that the N-terminal part of Taf2p is located in lobe C2 of TFIID.
Plasticity of the TFIID structure
The comparison between the four TFIID models indicates that with the exception of lobe C2, the domains are mostly conserved in size and shape, but that the overall structure of TFIID is variable. To further describe these TFIID domain movements, each cryoEM model was represented as a skeleton where the center of each lobe is schematized by a disk, each connected by a wire (Figure 5A). Angle α was defined as the angle between lobes A, C1 and C2, and β as the angle between lobes C1, C2 and B. The variation in α appears continuous within a range of 60°, from 53° (model 1) to 113° (model 4) (Figure 5B). The angle β shows a smaller variation (23°) and appears to adopt two values: 120° in models 1 and 4 and 97° in models 2 and 3 (Figure 5C). This suggests that lobe B can adopt two discrete conformations relative to lobe C. Another level of variability is the rotation of lobes around their connections. In this respect, lobes C2 and B show the highest flexibility since their relative orientation was found to change by up to 73° between their positions in models 1 and 2. This contrasts with the fixed position of lobe A relative to lobe C1. Collectively these data argue that the yTFIID complex is a flexible assembly that is likely capable of adopting a number of distinct conformations.
Figure 5.
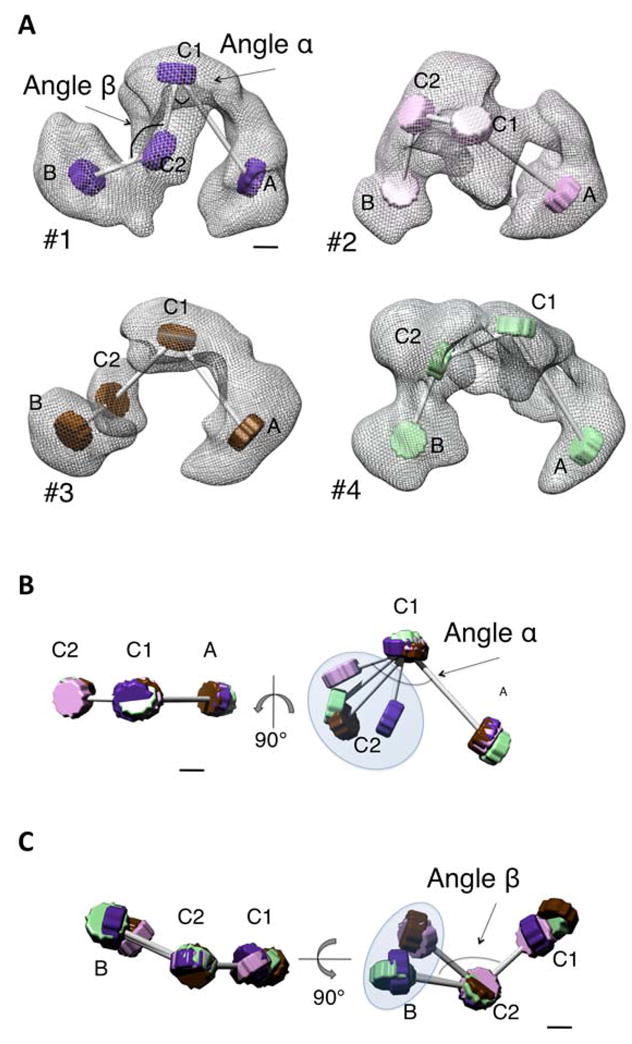
Flexibility of the TFIID structure.
(A) TFIID models 1, 2, 3 and 4 are represented as skeletons in which the centers of the four major domains are symbolized by disks and the domain connections by rods. (B) Variations in the α angle between domains A, C1 and C2. (C) Variations in the β angle between domains B, C2 and C1. The bars represent 2 nm.
Discussion
The present cryo-EM study of frozen hydrated and negatively stained yeast TFIID molecules provides the highest resolution map available for this multiprotein transcription initiation factor and stresses the importance of specimen heterogeneity in the quest of finer details. Earlier attempts have previously shown that conformational changes constitute a major limitation for reaching high resolution structural information (Grob et al., 2006). Our results further emphasize the importance of variations in subunit composition, which may, as in the case of Taf2p, affect specimen homogeneity. Interestingly our new model not only shows greater structural detail but also converges towards the structure of the human TFIID determined independently (Grob et al., 2006) (Supplemental Figure S5).
The structural characterization of molecular variations by electron microscopy can be resolved by either experimental or computational methods (Leschziner and Nogales, 2007). In all computational approaches a starting model is required either for alignment of the particles, or for angular assignment of the particle views for 3-D reconstruction. The use of a starting model may however bias the analysis, particularly if large structural fluctuations are suspected since alignment and/or angular assignment may be incorrect for the most extreme conformations. In this report specimen heterogeneity was addressed experimentally by performing electron tomography to generate a 3-D model for each molecule without the need for any alignment or clustering before 3-D reconstruction. The drawbacks of using this method, such as accumulated electron irradiation and large missing wedge of information that result from the tilting experiment were overcome, to some extent, by respectively lowering the electron dose and a posteriori averaging of molecular volumes. Further progress in resolution will need to address any additional structural and conformational fluctuations by biochemical improvement of specimen homogeneity, or stabilization of a particular conformation, by using more accurate tomographic data collection from cryo samples to detect subtle intermolecular variations and by developing computational methods to separate heterogeneous image datasets.
Conformational changes within yTFIID
The gallery of volumes resulting from the tomography experiments showed extremely large movements of the major domains. The conformational space explored by TFIID is considerably reduced when the hydrated state of the molecules is preserved and upon stabilization of a limited number of structural states by the GraFix method. Nevertheless, the refinement process selected out four abundant states of TFIID and revealed complex conformational transitions that are not limited to a spring-like flexibility between the most extreme lobes but involve significant reorganizations within domains. The four identified states could either represent stable conformations or average snapshots of a continuous structural transition. Two lines of evidence indicate that at least some transitions are not completely continuous and that stable states may exist. First, lobe B appears to adopt two discrete positions relative to the rest of the structure (angle β in Figure 5) while lobe C2 seems to adopt a continuous variation. Second, only one of the four states showed an additional density suggesting that the presence of Taf2p stabilizes a particular TFIID conformation.
Whereas lobes A and B appeared most stable, lobe C was found to undergo considerable conformational transitions. This observation is consistent with previous work that analyzed conformational variations in human TFIID, where it was also noted that the central domain is subject to reorganization (Grob et al., 2006). The precise mechanism and the functional significance of these conformational changes remain to be elucidated. The possibility that the structure of TFIID can be adapted to allow for the recognition of a large variety of promoters, each with distinct activator binding site distributions is particularly attractive. Along these lines, the recently reported structural change of human TFIID upon incorporation of the cell-type specific Taf4b paralogue instead of Taf4p was correlated with modified promoter selectivity (Liu et al., 2008). These observations suggest that the precise conformation of the TFIID complex may contribute to the specificity of promoter recognition. Alternatively, transcription factor-TFIID interaction(s) may alter TFIID conformation and directly modify promoter selectivity.
Taf2p structure-function relationships
The localization of Taf2p was determined by taking advantage of biochemical variation in Taf2p content and by immuno-labeling. Collectively these approaches showed that the N-terminal part of Taf2p is located in the C-lobe. Moreover, this domain has a size and a shape capable of accommodating the homologous aminopeptidase fold. A second protein domain was also found to be missing in those TFIID particles that do not contain the N-terminal part of Taf2p. This domain connects lobes C to lobe A and may correspond to the C-terminal part of Taf2p. Taken together these data suggest that the complete subunit is missing from TFIID, and that the loss of Taf2p apparent by SDS-PAGE analysis of TAP-tagged TFIID is most likely not due to partial proteolytic cleavage.
In order to position Taf2p relative to the previously mapped TFIID subunits (Leurent et al., 2002; Leurent et al., 2004), our former 32 Å resolution model was aligned against the present 23 Å resolution model and an unambiguous superposition could be obtained (Figure 6A). Our results indicate that the C-terminal part of Taf2p maps close to TBP, a TFIID subunit that interacts with the N-terminus of Taf1p with high affinity (Bai et al., 1997; Banik et al., 2001; Verrijzer et al., 1994) (Figure 6B). This proximity is consistent with earlier data showing a direct interaction between these three proteins forming a stable subcomplex capable of binding promoter DNA in vitro (Chalkley and Verrijzer, 1999). Although the existence of such a subcomplex has yet to be demonstrated in vivo, the finding that in the P. falciparum genome homologues of Taf1p, Taf2p and TBP, but of no other Tafs (with the possible exception of Taf10p) could be identified, strengthens the functional significance of a Taf1p-Taf2p-TBP subcomplex (Callebaut et al., 2005). Within TFIID this ternary complex is likely to be extended and to encompass both lobes A and C since the largest C-terminal part of Taf1p was found to be located in lobe A where it could contact the C-terminal part of Taf2p, whereas the N-terminal end of Taf1p reached toward lobe C where the N-terminal part of Taf2p was mapped (Leurent et al., 2004). TBP was also found to be located between the A and C lobes. In this respect it is notable that a C-terminal 369 aa fragment of Drosophila Taf2p was reported to bind directly and independently to both TBP and Taf1p (Verrijzer et al., 1994). The major contacts between these polypeptides are thus likely to occur through the C-terminal portion of Taf2p, which we speculate corresponds to the protein density located between lobes A and C.
The extended DNA binding profile of TFIID compared to TBP can be partially mimicked by the Taf1p-Taf2p-TBP ternary complex suggesting that this subcomplex contains many of the DNA binding properties of TFIID (Verrijzer et al., 1995; Verrijzer et al., 1994). Taf2p by itself was reported to interact with the initiator core promoter element (Inr) (Kaufmann et al., 1996; Verrijzer et al., 1995; Verrijzer et al., 1994) and in the context of human TFIID, Taf2p could be cross-linked to the Adenovirus Major Late Promoter Inr element (Oelgeschlager et al., 1996). Taken together these results indicate that Taf2p is likely to participate in start-site selection on certain promoters through its ability to bind the Inr. The relative positions of TBP and Taf2p in our TFIID model thus suggest an orientation of the promoter DNA: the upstream region should contact TBP whereas the transcription initiation site of the promoter would be positioned closer to the Taf2p region. The TBP-Taf2p location further defines a curved DNA binding interface that, according to our model, can be as large as 15 nm and could thus accommodate up to 45bp of promoter DNA within the clamp. It is tempting to speculate that this distance is related to the downstream DNase I hypersensitive sites which were detected on several yeast promoters at 45 bp downstream of the TATA box (Sanders et al., 2002) but additional experiments are required to address this question. Finally the proposed location for the promoter DNA within the clamp formed by TFIID gives strong spatial constraints for the assembly of the pre-initiation complex. The volume forming the clamp is large enough to contain a sphere with a diameter of 12.5 nm and could thus accommodate several transcription proteins.
Identification of a TFIID core sub-complex
Several lines of evidence indicate that the 3-D architecture of TFIID is likely to contain a stable core subcomplex onto which an independent module is assembled. The use of RNAi to probe the stability of the TFIID complex in Drosophila tissue culture cells revealed the existence of a stable core-TFIID subcomplex composed of Taf5p and the two Histone Fold Domain (HFD) -containing Taf pairs Taf4/12 and Taf6/9 (Wright et al., 2006). This core-TFIID is believed to be decorated with peripheral subunits, in particular those which compose the Taf1p-Taf2p-TBP subcomplex. Additional results consistent with these observations had previously been reported during biochemical analyses of TFIID purified from yeast expressing a temperature-conditional mutated form of Taf1p (Singh et al., 2004). In order to translate these observations onto our electron microscopy map, the potential protein densities of Taf1p, Taf2p and TBP were removed from the TFIID envelope. The shape of the remaining structure is reminiscent of that of a stable in vitro reconstituted complex composed of Taf5p and the three HFD-pairs Taf4/12, Taf6/9 Taf8/10 (Leurent et al., 2004) and interestingly presents an almost symmetric crescent-shaped structure (Figure 6C). Consistent with this observation are the biochemical quantization and in vivo self-association properties of yeast Tafs which showed that several polypeptides are present with more than one copy in each TFIID molecule (Sanders et al., 2002). These results were confirmed by immuno-electron microscopy data that showed that at least Taf5p and the five HFD-containing subunits (Taf10p, Taf6p/9p, Taf4p/12p) are present as two copies (Leurent et al., 2002). The Tafs present as two copies are likely to form a two-fold symmetric assembly similar to the subcomplex outlined within TFIID. Altogether, the higher resolution structure and the immuno-labeling studies strongly suggest that TFIID is composed of two subcomplexes. On one hand a core complex containing Taf5p and most of the HFD-containing Taf-pairs (Taf6/9, Taf4/12, Taf8/10, Taf11/13) is proposed to adopt a crescent-shaped two-fold symmetric structure. On the other hand a complex containing Taf1p, Taf2p and TBP, as well as probably Taf7p, is predicted to be recruited to this core complex.
In summary, we have mapped the location of the Taf2p subunit within the yeast TFIID holocomplex. Further, by capitalizing on the sub-stoichiometric Taf2p content of certain preparations of TFIID, complemented by single particle tomography, immuno-labeling and cryo EM, we have generated a 23 Å model of yeast TFIID. This new model has both higher structural resolution as well as increased definition of the location of the three TFIID subunits, Taf1p, Taf2p and TBP that likely participate critically in both promoter binding and promoter selectivity. Additional experimentation designed to provide further details of yeast TFIID structure, both alone and complexed with other GTFs, promoter DNA and transactivator proteins are in progress. This work will provide additional insights into how TFIID subserves both its coactivator and promoter recognition functions.
Materials and Methods
TFIID Purification
HA1-Taf1p-tagged TFIID was purified from Saccharomyces cerevisiae strain YSLS18 as described previously (Sanders et al., 2002; Sanders and Weil, 2000); note that this purification scheme utilized ethidium bromide to prevent TFIID-DNA interactions during purification. TAP-Taf1p-tagged TFIID was purified from yeast strain YLSTAF1 (kindly provided by Dr. Ray Jacobson, University of Texas MD Anderson Cancer Center). This strain expresses Taf1p with 4.5 copies of the TAP tag (Protein A4.5X-TEV protease site-Calmodulin Binding Domain; (Tasto et al., 2001)) at the C-terminus. YLSTAF1 cells were grown to mid-log phase, harvested and processed for TFIID purification as for YSLS18. An overview of the three steps used for the subsequent purification of TFIID are as follows: (a) solubilized TAP-Taf1p TFIID was bound to IgG Sepharose and eluted using the TEV protease, (b) the IgG Sepharose eluate was bound to Calmodulin (CaM)-Sepharose and eluted with EGTA, (c) the CaM-Sepharose eluates were immediately loaded onto a MonoS FPLC column, the column washed, and TFIID eluted with a gradient of 1M salt. The TAP-tagged TFIID prepared by this procedure is highly concentrated (1–3 mg/ml); typical yield 3–3.5 mg TFIID/kg cells. Neither preparation generated TFIID with significant amounts of either contaminating DNA or RNA (Figure S5).
Anti-Taf2p Peptide Antibodies
Rabbit antibodies against Taf2p N-terminal amino acid residues 5–19 (SKNATPRAIVSESST) were prepared by Antagene Inc (Mountain View, CA). Peptide immobilized on Sulfolink beads (Pierce, Inc.) with an added C-terminal cysteine residue was used for affinity purification of antibodies specifically recognizing Taf2p N-terminal sequences. These antibodies only recognized the Taf2p subunit of TFIID (Figure S6).
Electron tomography
Single tilt tomography was performed at room temperature using a FEI Tecnai F20 electron microscope operating at 200 kV. Specimens were observed under low-dose conditions (total dose of 40–50 e/Å2) with a tilt range of −65 to +65 degrees. Specimens were sandwiched between two layers of carbon using 2% uranyl-acetate as a stain and 0.1% glutaraldehyde as a cross-linking agent. The tomograms were reconstructed using the IMOD software package (Kremer et al., 1996). To investigate the differences between the 3-D models the maps were first roughly aligned in real space using Chimera’s “fit map in map” tool (Pettersen et al., 2004). This pre-alignment was refined by cross correlation and the aligned volumes were clustered after multivariate statistical analysis using the IMAGIC software package (van Heel et al., 1996).
Single particle cryo electron microscopy
The yTFIID sample was prepared using the GraFix method (Kastner et al., 2008) in a buffer containing 10 mM Tris-HCl (pH 8.0), 300 mM NaCl and according to the cryo-negative stain method (Golas et al., 2005). Images were collected at liquid nitrogen temperature under low-dose condition (15–20 e/Å2), at a magnification of x40,000 on Kodak SO-163 films. The defocus values ranged from 0.137 to 1.96 μm. Micrographs with no visible drift were digitized with a 5μm raster size using a drum scanner (Primescan D7100, Heidelberg) and coarsened twice to obtain a final pixel spacing of 0.254 nm. Boxing and CTF phase flipping of the 44,233 TFIID images were performed in the EMAN software package. The image processing was performed using the IMAGIC (Image Science Software, Berlin, Germany) and Spider (Frank et al., 1996) software packages as described earlier. Controls assessing the stability of the models are shown in supplementary material (Supplemental Figure S6). The resolutions of the final reconstructions were estimated according to the 0.5 cut-off in the Fourier shell correlation curve (0.5 FSC criterion) and the intersection point of the half bit curve with the FSC curve (half bit criterion) (van Heel and Schatz, 2005). The final reconstructions were filtered to the measured resolution.
Immuno-electron microscopy
For immuno-electron microscopy a 3- to 5-fold molar excess of anti-Taf2p IgG was incubated 30 min at 20°C with purified HA-tagged TFIID at a final protein concentration of 30 μg/ml. Images of TFIID molecules putatively labeled by the IgG were collected and aligned against projections of model 4 (see Figure 3B). The aligned images were then analyzed by using multivariate statistical methods and hierarchic ascendant classification. Class average images were selected where the antibody bound to TFIID was clearly recognized and a 3-D map of the complex was determined to position the antibody binding site. The obtained volume along model 4 was normalized and a difference map was created by subtracting model 4.
Supplementary Material
Acknowledgments
This work was supported by grants from the Institut National de la Santé et de la Recherche Médicale, the Centre National pour la Recherche Scientifique, the Association pour la Recherche sur le Cancer (ARC), the Fondation pour la recherche médicale (FRM), the european SPINE program, QLG2-CT-00988 and the European Union grant RTN2-2001-00026 and the National Institutes of Health (GM52461).
Footnotes
Accession Numbers
The density map of the yeast TFIID has been deposited at the Macromolecular Structure Database under accession number EMD-5026.
Publisher's Disclaimer: This is a PDF file of an unedited manuscript that has been accepted for publication. As a service to our customers we are providing this early version of the manuscript. The manuscript will undergo copyediting, typesetting, and review of the resulting proof before it is published in its final citable form. Please note that during the production process errors may be discovered which could affect the content, and all legal disclaimers that apply to the journal pertain.
References
- Andel F, 3rd, Ladurner AG, Inouye C, Tjian R, Nogales E. Three-dimensional structure of the human TFIID-IIA-IIB complex. Science. 1999;286:2153–2156. doi: 10.1126/science.286.5447.2153. [DOI] [PubMed] [Google Scholar]
- Bai Y, Perez GM, Beechem JM, Weil PA. Structure-function analysis of TAF130: identification and characterization of a high-affinity TATA-binding protein interaction domain in the N terminus of yeast TAF(II)130. Mol Cell Biol. 1997;17:3081–3093. doi: 10.1128/mcb.17.6.3081. [DOI] [PMC free article] [PubMed] [Google Scholar]
- Banik U, Beechem JM, Klebanow E, Schroeder S, Weil PA. Fluorescence-based analyses of the effects of full-length recombinant TAF130p on the interaction of TATA box-binding protein with TATA box DNA. J Biol Chem. 2001;276:49100–49109. doi: 10.1074/jbc.M109246200. [DOI] [PubMed] [Google Scholar]
- Brand M, Leurent C, Mallouh V, Tora L, Schultz P. Three-dimensional structures of the TAFII-containing complexes TFIID and TFTC. Science. 1999;286:2151–2153. doi: 10.1126/science.286.5447.2151. [DOI] [PubMed] [Google Scholar]
- Burley SK, Roeder RG. Biochemistry and structural biology of transcription factor IID (TFIID) Annu Rev Biochem. 1996;65:769–799. doi: 10.1146/annurev.bi.65.070196.004005. [DOI] [PubMed] [Google Scholar]
- Callebaut I, Prat K, Meurice E, Mornon JP, Tomavo S. Prediction of the general transcription factors associated with RNA polymerase II in Plasmodium falciparum: conserved features and differences relative to other eukaryotes. BMC Genomics. 2005;6:100. doi: 10.1186/1471-2164-6-100. [DOI] [PMC free article] [PubMed] [Google Scholar]
- Chalkley GE, Verrijzer CP. DNA binding site selection by RNA polymerase II TAFs: a TAF(II)250-TAF(II)150 complex recognizes the initiator. Embo J. 1999;18:4835–4845. doi: 10.1093/emboj/18.17.4835. [DOI] [PMC free article] [PubMed] [Google Scholar]
- Frank J, Radermacher M, Penczek P, Zhu J, Li Y, Ladjadj M, Leith A. SPIDER and WEB: processing and visualization of images in 3D electron microscopy and related fields. J Struct Biol. 1996;116:190–199. doi: 10.1006/jsbi.1996.0030. [DOI] [PubMed] [Google Scholar]
- Garbett KA, Tripathi MK, Cencki B, Layer JH, Weil PA. Yeast TFIID serves as a coactivator for Rap1p by direct protein-protein interaction. Mol Cell Biol. 2007;27:297–311. doi: 10.1128/MCB.01558-06. [DOI] [PMC free article] [PubMed] [Google Scholar]
- Golas MM, Sander B, Will CL, Luhrmann R, Stark H. Major conformational change in the complex SF3b upon integration into the spliceosomal U11/U12 di-snRNP as revealed by electron cryomicroscopy. Mol Cell. 2005;17:869–883. doi: 10.1016/j.molcel.2005.02.016. [DOI] [PubMed] [Google Scholar]
- Grob P, Cruse MJ, Inouye C, Peris M, Penczek PA, Tjian R, Nogales E. Cryo-electron microscopy studies of human TFIID: conformational breathing in the integration of gene regulatory cues. Structure. 2006;14:511–520. doi: 10.1016/j.str.2005.11.020. [DOI] [PubMed] [Google Scholar]
- Hamard PJ, Dalbies-Tran R, Hauss C, Davidson I, Kedinger C, Chatton B. A functional interaction between ATF7 and TAF12 that is modulated by TAF4. Oncogene. 2005;24:3472–3483. doi: 10.1038/sj.onc.1208565. [DOI] [PubMed] [Google Scholar]
- Hampsey M, Reinberg D. RNA polymerase II as a control panel for multiple coactivator complexes. Curr Opin Genet Dev. 1999;9:132–139. doi: 10.1016/S0959-437X(99)80020-3. [DOI] [PubMed] [Google Scholar]
- Hansen SK, Tjian R. TAFs and TFIIA mediate differential utilization of the tandem Adh promoters. Cell. 1995;82:565–575. doi: 10.1016/0092-8674(95)90029-2. [DOI] [PubMed] [Google Scholar]
- Juven-Gershon T, Hsu JY, Theisen JW, Kadonaga JT. The RNA polymerase II core promoter - the gateway to transcription. Curr Opin Cell Biol. 2008;20:253–259. doi: 10.1016/j.ceb.2008.03.003. [DOI] [PMC free article] [PubMed] [Google Scholar]
- Kastner B, Fischer N, Golas MM, Sander B, Dube P, Boehringer D, Hartmuth K, Deckert J, Hauer F, Wolf E, et al. GraFix: sample preparation for single-particle electron cryomicroscopy. Nat Methods. 2008;5:53–55. doi: 10.1038/nmeth1139. [DOI] [PubMed] [Google Scholar]
- Kaufmann J, Verrijzer CP, Shao J, Smale ST. CIF, an essential cofactor for TFIID-dependent initiator function. Genes Dev. 1996;10:873–886. doi: 10.1101/gad.10.7.873. [DOI] [PubMed] [Google Scholar]
- Kim TH, Barrera LO, Zheng M, Qu C, Singer MA, Richmond TA, Wu Y, Green RD, Ren B. A high-resolution map of active promoters in the human genome. Nature. 2005;436:876–880. doi: 10.1038/nature03877. [DOI] [PMC free article] [PubMed] [Google Scholar]
- Kremer JR, Mastronarde DN, McIntosh JR. Computer visualization of three-dimensional image data using IMOD. J Struct Biol. 1996;116:71–76. doi: 10.1006/jsbi.1996.0013. [DOI] [PubMed] [Google Scholar]
- Lee DH, Gershenzon N, Gupta M, Ioshikhes IP, Reinberg D, Lewis BA. Functional characterization of core promoter elements: the downstream core element is recognized by TAF1. Mol Cell Biol. 2005;25:9674–9686. doi: 10.1128/MCB.25.21.9674-9686.2005. [DOI] [PMC free article] [PubMed] [Google Scholar]
- Leschziner AE, Nogales E. Visualizing flexibility at molecular resolution: analysis of heterogeneity in single-particle electron microscopy reconstructions. Annu Rev Biophys Biomol Struct. 2007;36:43–62. doi: 10.1146/annurev.biophys.36.040306.132742. [DOI] [PubMed] [Google Scholar]
- Leurent C, Sanders S, Ruhlmann C, Mallouh V, Weil PA, Kirschner DB, Tora L, Schultz P. Mapping histone fold TAFs within yeast TFIID. Embo J. 2002;21:3424–3433. doi: 10.1093/emboj/cdf342. [DOI] [PMC free article] [PubMed] [Google Scholar]
- Leurent C, Sanders SL, Demeny MA, Garbett KA, Ruhlmann C, Weil PA, Tora L, Schultz P. Mapping key functional sites within yeast TFIID. Embo J. 2004;23:719–727. doi: 10.1038/sj.emboj.7600111. [DOI] [PMC free article] [PubMed] [Google Scholar]
- Liu WL, Coleman RA, Grob P, King DS, Florens L, Washburn MP, Geles KG, Yang JL, Ramey V, Nogales E, Tjian R. Structural changes in TAF4b-TFIID correlate with promoter selectivity. Mol Cell. 2008;29:81–91. doi: 10.1016/j.molcel.2007.11.003. [DOI] [PMC free article] [PubMed] [Google Scholar]
- Martinez E, Chiang CM, Ge H, Roeder RG. TATA-binding protein-associated factor(s) in TFIID function through the initiator to direct basal transcription from a TATA-less class II promoter. Embo J. 1994;13:3115–3126. doi: 10.1002/j.1460-2075.1994.tb06610.x. [DOI] [PMC free article] [PubMed] [Google Scholar]
- Mengus G, May M, Carre L, Chambon P, Davidson I. Human TAF(II)135 potentiates transcriptional activation by the AF-2s of the retinoic acid, vitamin D3, and thyroid hormone receptors in mammalian cells. Genes Dev. 1997;11:1381–1395. doi: 10.1101/gad.11.11.1381. [DOI] [PubMed] [Google Scholar]
- Mizzen CA, Yang XJ, Kokubo T, Brownell JE, Bannister AJ, Owen-Hughes T, Workman J, Wang L, Berger SL, Kouzarides T, et al. The TAF(II)250 subunit of TFIID has histone acetyltransferase activity. Cell. 1996;87:1261–1270. doi: 10.1016/s0092-8674(00)81821-8. [DOI] [PubMed] [Google Scholar]
- Mohan WS, Jr, Scheer E, Wendling O, Metzger D, Tora L. TAF10 (TAF(II)30) is necessary for TFIID stability and early embryogenesis in mice. Mol Cell Biol. 2003;23:4307–4318. doi: 10.1128/MCB.23.12.4307-4318.2003. [DOI] [PMC free article] [PubMed] [Google Scholar]
- Oelgeschlager T, Chiang CM, Roeder RG. Topology and reorganization of a human TFIID-promoter complex. Nature. 1996;382:735–738. doi: 10.1038/382735a0. [DOI] [PubMed] [Google Scholar]
- Pettersen EF, Goddard TD, Huang CC, Couch GS, Greenblatt DM, Meng EC, Ferrin TE. UCSF Chimera--a visualization system for exploratory research and analysis. J Comput Chem. 2004;25:1605–1612. doi: 10.1002/jcc.20084. [DOI] [PubMed] [Google Scholar]
- Purnell BA, Emanuel PA, Gilmour DS. TFIID sequence recognition of the initiator and sequences farther downstream in Drosophila class II genes. Genes Dev. 1994;8:830–842. doi: 10.1101/gad.8.7.830. [DOI] [PubMed] [Google Scholar]
- Rigaut G, Shevchenko A, Rutz B, Wilm M, Mann M, Seraphin B. A generic protein purification method for protein complex characterization and proteome exploration. Nat Biotechnol. 1999;17:1030–1032. doi: 10.1038/13732. [DOI] [PubMed] [Google Scholar]
- Sanders SL, Garbett KA, Weil PA. Molecular characterization of Saccharomyces cerevisiae TFIID. Mol Cell Biol. 2002;22:6000–6013. doi: 10.1128/MCB.22.16.6000-6013.2002. [DOI] [PMC free article] [PubMed] [Google Scholar]
- Sanders SL, Weil PA. Identification of two novel TAF subunits of the yeast Saccharomyces cerevisiae TFIID complex. J Biol Chem. 2000;275:13895–13900. doi: 10.1074/jbc.275.18.13895. [DOI] [PubMed] [Google Scholar]
- Singh MV, Bland CE, Weil PA. Molecular and genetic characterization of a Taf1p domain essential for yeast TFIID assembly. Mol Cell Biol. 2004;24:4929–4942. doi: 10.1128/MCB.24.11.4929-4942.2004. [DOI] [PMC free article] [PubMed] [Google Scholar]
- Sypes MA, Gilmour DS. Protein/DNA crosslinking of a TFIID complex reveals novel interactions downstream of the transcription start. Nucleic Acids Res. 1994;22:807–814. doi: 10.1093/nar/22.5.807. [DOI] [PMC free article] [PubMed] [Google Scholar]
- Taatjes DJ, Marr MT, Tjian R. Regulatory diversity among metazoan co-activator complexes. Nat Rev Mol Cell Biol. 2004;5:403–410. doi: 10.1038/nrm1369. [DOI] [PubMed] [Google Scholar]
- Tasto JJ, Carnahan RH, McDonald WH, Gould KL. Vectors and gene targeting modules for tandem affinity purification in Schizosaccharomyces pombe. Yeast. 2001;18:657–662. doi: 10.1002/yea.713. [DOI] [PubMed] [Google Scholar]
- Thunnissen MM, Nordlund P, Haeggstrom JZ. Crystal structure of human leukotriene A(4) hydrolase, a bifunctional enzyme in inflammation. Nat Struct Biol. 2001;8:131–135. doi: 10.1038/84117. [DOI] [PubMed] [Google Scholar]
- van Heel M, Harauz G, Orlova EV, Schmidt R, Schatz M. A new generation of the IMAGIC image processing system. J Struct Biol. 1996;116:17–24. doi: 10.1006/jsbi.1996.0004. [DOI] [PubMed] [Google Scholar]
- van Heel M, Schatz M. Fourier shell correlation threshold criteria. J Struct Biol. 2005;151:250–262. doi: 10.1016/j.jsb.2005.05.009. [DOI] [PubMed] [Google Scholar]
- Vermeulen M, Mulder KW, Denissov S, Pijnappel WW, van Schaik FM, Varier RA, Baltissen MP, Stunnenberg HG, Mann M, Timmers HT. Selective anchoring of TFIID to nucleosomes by trimethylation of histone H3 lysine 4. Cell. 2007;131:58–69. doi: 10.1016/j.cell.2007.08.016. [DOI] [PubMed] [Google Scholar]
- Verrijzer CP, Chen JL, Yokomori K, Tjian R. Binding of TAFs to core elements directs promoter selectivity by RNA polymerase II. Cell. 1995;81:1115–1125. doi: 10.1016/s0092-8674(05)80016-9. [DOI] [PubMed] [Google Scholar]
- Verrijzer CP, Yokomori K, Chen JL, Tjian R. Drosophila TAFII150: similarity to yeast gene TSM-1 and specific binding to core promoter DNA. Science. 1994;264:933–941. doi: 10.1126/science.8178153. [DOI] [PubMed] [Google Scholar]
- Voulgari A, Voskou S, Tora L, Davidson I, Sasazuki T, Shirasawa S, Pintzas A. TATA Box-Binding Protein-Associated Factor 12 Is Important for RAS-Induced Transformation Properties of Colorectal Cancer Cells. Mol Cancer Res. 2008;6:1071–1083. doi: 10.1158/1541-7786.MCR-07-0375. [DOI] [PubMed] [Google Scholar]
- Wright KJ, Marr MT, 2nd, Tjian R. TAF4 nucleates a core subcomplex of TFIID and mediates activated transcription from a TATA-less promoter. Proc Natl Acad Sci U S A. 2006;103:12347–12352. doi: 10.1073/pnas.0605499103. [DOI] [PMC free article] [PubMed] [Google Scholar]
- Zanton SJ, Pugh BF. Full and partial genome-wide assembly and disassembly of the yeast transcription machinery in response to heat shock. Genes Dev. 2006;20:2250–2265. doi: 10.1101/gad.1437506. [DOI] [PMC free article] [PubMed] [Google Scholar]
Associated Data
This section collects any data citations, data availability statements, or supplementary materials included in this article.