Abstract
Background:
In the midbrain of patients with Parkinson disease (PD), there is a selective loss of dopaminergic neurons in the ventrolateral and caudal substantia nigra (SN). In a mouse model of PD, investigators have administered 1-methyl-4-phenyl-1,2,3,6-tetrahydropyridine (MPTP) and found that measures derived using diffusion tensor imaging (DTI) were correlated with the number of dopamine neurons lost following intoxication.
Methods:
Twenty-eight subjects (14 with early stage, untreated PD and 14 age- and gender-matched controls) were studied with a high-resolution DTI protocol at 3 Tesla using an eight-channel phase array coil and parallel imaging to study specific segments of degeneration in the SN. Regions of interest were drawn in the rostral, middle, and caudal SN by two blinded and independent raters.
Results:
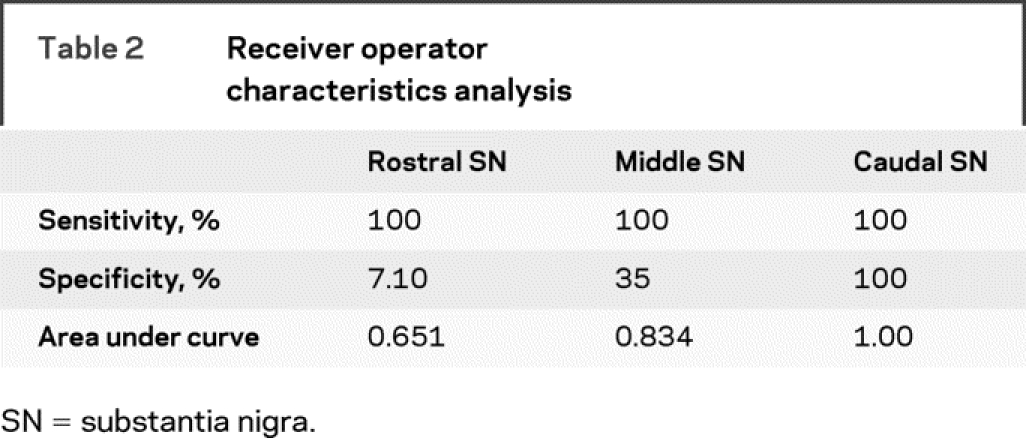
Fractional anisotropy (FA) was reduced in the SN of subjects with PD compared with controls (p < 0.001). Post hoc analysis identified that reduced FA for patients with PD was greater in the caudal compared with the rostral region of interest (p < 0.00001). A receiver operator characteristic analysis in the caudal SN revealed that sensitivity and specificity were 100% for distinguishing patients with PD from healthy subjects. Findings were consistent across both raters.
Conclusions:
These findings provide evidence that high resolution diffusion tensor imaging in the substantia nigra distinguishes early stage, de novo patients with Parkinson disease (PD) from healthy individuals on a patient by patient basis and has the potential to serve as a noninvasive early biomarker for PD.
GLOSSARY
- DTI
= diffusion tensor imaging;
- FA
= fractional anisotropy;
- MPTP
= 1-methyl-4-phenyl-1,2,3,6-tetrahydropyridine;
- PD
= Parkinson disease;
- ROC
= receiver operating characteristic;
- ROI
= region of interest;
- SN
= substantia nigra;
- UPDRS
= Unified Parkinson’s Disease Rating Scale.
In the midbrain of patients with Parkinson disease (PD), there is a selective loss of dopaminergic neurons in the substantia nigra (SN) pars compacta, which results in impaired motor function. At the point of clinical expression of PD, it is estimated that approximately half of the dopaminergic cells in the SN pars compacta are lost.1,2 Moreover, PD-related cell loss occurs mainly in the ventrolateral and caudal segment of the SN pars compacta.3 These studies characterizing cell loss in the SN pars compacta of patients with PD have been limited to ex vivo examination. Recent developments in neuroimaging techniques bring new promise for identifying surrogate markers of the degeneration within the SN in vivo.4–6
Although diffusion tensor imaging (DTI) has typically been used to study white matter tracts,7,8 it also holds promise for studying abnormalities in gray matter areas. As a method, DTI is based upon the diffusivity of water molecules, which exhibit a varying degree of tissue dependent anisotropy. In white matter, water molecules are limited in the directions of diffusion, resulting in a high value of fractional anisotropy (FA).9 However, in gray matter and in CSF, water molecular diffusion exhibits significantly less directional dependence, causing low FA values relative to white matter. The administration of 1-methyl-4-phenyl-1,2,3,6-tetrahydropyridine (MPTP) in a murine model of PD demonstrated that measures derived from DTI were significantly correlated with the number of SN dopaminergic neurons lost following intoxication.10 The authors suggested that DTI can provide an indirect measure of dopaminergic degeneration within the SN, presumably because cell loss in the SN alters the microstructural integrity and diffusivity of water molecules.
This study used high resolution DTI to compare the SN between patients with PD and healthy individuals. Early stage, unmedicated patients with PD were studied because these patients are the most difficult group to differentiate from healthy individuals and because they are medication naive. Each patient with PD was prospectively matched with a corresponding control subject based on age and sex. Since previous studies suggest that the ventrolateral, caudal portion of the SN pars compacta manifests the greatest degeneration in PD,3,5 we tested the hypothesis that the highest sensitivity and specificity for differentiating de novo PD from healthy individuals would be found in this area.
METHODS
Subjects.
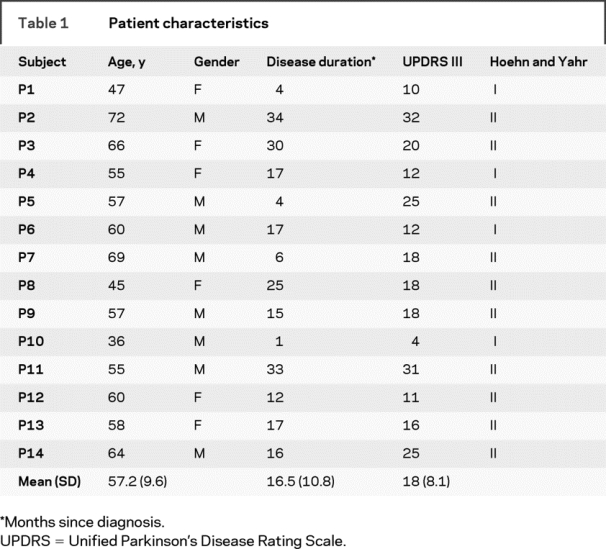
The study was a prospective case-controlled study that included 28 subjects. Fourteen de novo patients with PD and 14 healthy subjects participated in the study (table 1). Patients were recruited from the Movement Disorders Section at Rush University Medical Center. Patients were included if they were not on antiparkinson medications and had never been treated with antiparkinson medications, and did not have clinically significant cognitive impairment. We defined antiparkinsonian medication to include any drug designed to alter symptoms of PD or posited to slow the progression of PD. All patients were diagnosed with PD by a movement disorders neurologist and met the PD Society Brain Bank diagnostic criteria.11,12 Each patient was rated by the same neurologist using the Unified PD Rating Scale (table 1). The ratings were performed blinded to the DTI dataset. The 14 healthy control subjects were recruited from advertisements in the Chicago area, and were matched for age and sex to each patient with PD. The age of the PD group (mean 57.2 years) was not different from the control group (mean 58.0 years) (t = 0.12; p = 0.9). All subjects gave written informed consent consistent with the Declaration of Helsinki, which was approved by the local Institutional Review Boards at Rush University Medical Center and the University of Illinois at Chicago.
Table 1 Patient characteristics
DTI acquisition.
Data were acquired on a General Electric 3.0-Tesla Signa HDx scanner (General Electric Healthcare, Waukesha, WI) using a DTI pulse sequence designed to reduce eddy current induced distortion.13 The pulse sequence was capable of dynamically adjusting the imaging gradients and the receiver frequency, to offset the eddy current effects and limit the maximal image shift and distortion to a subpixel level. All images were acquired using an eight-channel phased-array head coil, together with parallel imaging (acceleration factor = 2) to increase the spatial resolution. The key data acquisition parameters were repetition time = 4,500 msec, echo time = 82 msec, b values = 0, 1,000 s/mm2, diffusion gradient directions = 27, field of view = 20 cm × 20 cm, matrix = 256 × 256, number of excitations = 4, slice thickness = 4 mm, slice skip = 1 mm, slice number = 15. The top slice was placed approximately 4 mm superior to the corpus callosum. The diffusion gradient orientations were designed based on the electrostatic repulsion model.14
DTI analysis.
Fractional anisotropy (FA) is a measure of the degree of diffusion anisotropy and is represented by:
 |
where λ1, λ2, and λ3 are the eigenvalues of the diffusion tensor matrix.15 FA values close to 0 indicate isotropic diffusion, and FA values near 1 represent anisotropic diffusion. Highly organized white matter has high FA because water molecular diffusion is tightly constrained perpendicular to the fiber tract. In the SN, FA values are considerably lower than in white matter. In this study, FA was calculated in DtiStudio16 using singular value decomposition from the diffusion-weighted images acquired with the aforementioned protocol.
Radial diffusivity [λR = (λ2+λ3)/2] and longitudinal diffusivity (λL = λ1) were calculated, where λ1, λ2, and λ3 are in descending order. Radial diffusivity reflects the average diffusivity perpendicular to axonal fibers and longitudinal diffusivity reflects diffusivity parallel to axonal fibers. Average diffusivity was also quantified.9,17 These measures are reported in appendix e-1 and table e-1 on the Neurology® Web site at www.neurology.org. In order to assure the image quality and the reliability of the diffusion measures, head motion of the DTI data set was examined using AFNI and was found to be less than 1 mm for all subjects. There was no significant difference in head motion between groups. We did not implement head motion correction.
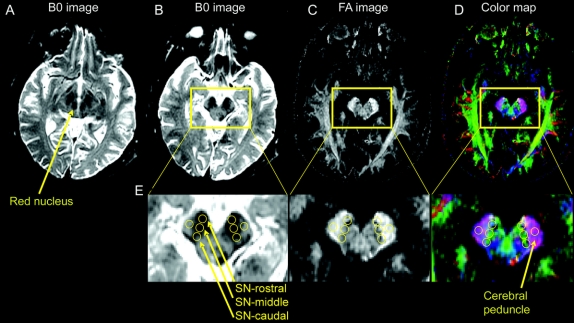
Figure 1 shows the B0 image (which is essentially a T2-weighted image) for the slice with the red nucleus and substantia nigra (A), B0 image one slice inferior (B), FA map (C), and the colormap (D) to illustrate how and where our regions of interest (ROI) were drawn in the SN. Separate ROI were drawn using three circles in the rostral, middle, and caudal segments. The SN pars compacta is difficult to differentiate from SN pars reticulata using T2-weighted imaging in vivo, and therefore the regions are interpreted to be within the SN rather than just in SN pars compacta. Also, previous studies have indicated that the rostral part of the hypointense area of the SN on a T2-weighted image includes both the cerebral peduncle and SN.18 Thus, the differences between groups may be smaller in this region than in the caudal ROI where cell loss in PD is most prominent.3
Figure 1 Procedure used to draw regions of interest in the substantia nigra
(A) B0 image with the red nucleus and substantia nigra. This slice was first identified. (B) B0 slice just inferior to the slice shown in A, and this slice is where we drew the three regions of interest. (C) shows the fractional anisotropy image and (D) shows the colormap of the same slice in B. The region of interest for the cerebral peduncle is also shown. (E) Larger image of the three regions of interest in the rostral, middle, and caudal substantia nigra as well as the region of interest in the cerebral peduncle. All images were generated in DtiStudio.
The following method was used to draw ROI. Each ROI was four voxels in diameter, and each voxel was 0.781 mm. This provides a ROI volume equal to 30.6 mm3. First, on the B0 image we identified the slice where the red nucleus, subthalamic nucleus, and SN were prominent (figure 1A). Second, we moved one slice inferior because much of the SN is below the red nucleus. In this slice, the substantia nigra was always visible, and the red nucleus was either no longer visible or was only faintly visible (figure 1B). This method was used to focus on the ventral SN. Third, we placed the first ROI in the hypointense part of the rostral segment of the SN while making sure to stay within the brainstem. Fourth, the middle ROI was placed lateral and posterior to the first circle such that the two circles did not overlap. Fifth, the caudal ROI was placed lateral and posterior to the middle circle such that the two circles did not overlap (figure 1E). When placing all three ROI, we used the FA map and colormap (figure 1, C and D) to make sure that our ROI were not in the cerebral peduncle laterally.
In the rostral, middle, and caudal ROI the FA, radial diffusivity, longitudinal diffusivity, and average diffusivity were extracted. Next, in each corresponding left and right ROI the mean of the corresponding dependent measure (e.g., FA) was calculated. The mean value across the left and right ROI in the SN was used in the statistical analysis. As a control procedure, a ROI was drawn in the cerebral peduncle, just lateral to the SN (figure 1B) and the findings are reported in table e-1. A standard noise threshold was applied to all images in DtiStudio. Each image was visually inspected after application of this threshold to make certain that signal loss did not occur in the ROI or in surrounding tissue.
The ROI were drawn independently by two of the investigators. Both investigators agreed upon the common method a priori that was described above. All ROI were drawn blinded to the patient or control status.
Statistical analysis.
On each dependent measure separate two-way mixed model analyses of variance were performed. The between subjects factor was group (control and PD) and the repeated factor was ROI (rostral, middle, and caudal). Post hoc unpaired t tests were used to examine interactions. In the cerebral peduncle, separate unpaired t tests between the PD and control group were performed. Inter-rater reliability between raters 1 and 2 was examined using intraclass correlation coefficients in SPSS 15.0.19 Receiver operating characteristic (ROC) curves were used to determine the sensitivity and specificity for the three SN ROI.
RESULTS
The FA value was reduced in the PD group compared with the control group [F(1,26) = 28.7, p < 0.001] and the FA value was reduced across ROI [F(2,52) = 4.9, p < 0.05] (figure 2 and table e-1). There was a group by ROI interaction [F(2,52) = 5.9, p < 0.01]. The FA difference between groups was less in the rostral region than in the caudal region (figure 2A). For instance, while the FA value in the rostral region was not different between groups (t = 1.5; p = 0.12), the FA differences in the middle (t = 3.7; p < 0.001) and caudal (t = 11.9; p < 0.00001) regions were clearly different between groups. It is important to highlight that the caudal t value is 11.9, suggesting that it is extremely unlikely this finding occurred by chance.
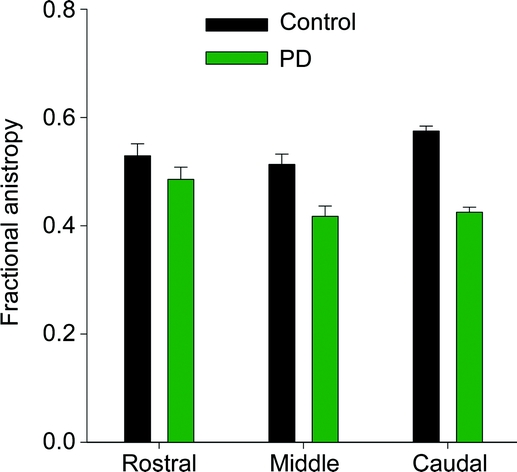
Figure 2 Differences between groups
Mean fractional anisotropy across patients with Parkinson disease (green) and healthy control subjects (black) in the rostral, middle, and caudal region of the substantia nigra. Error bars represent ± 1 SD.
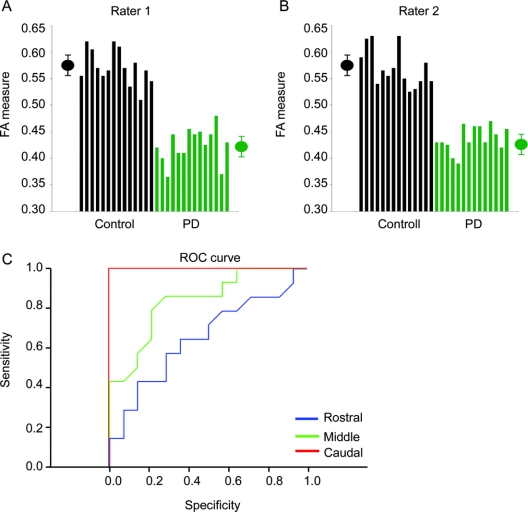
The measurements based on the high resolution DTI technique were sensitive to disease detection in the caudal part of the SN in all patients with PD analyzed independently by both raters (figure 3, A and B). The ROC analysis on the FA value from rater 1 on the rostral, middle, and caudal ROI demonstrated that the area under the ROC curve was greatest for the caudal ROI compared with the middle and rostral ROI (figure 3C and table 2). The sensitivity was 100% and specificity was 100% for the caudal ROI (table 2).
Figure 3 Differences between individual subjects
(A) Fractional anisotropy values from rater 1 for patients with Parkinson disease (PD) (green) and healthy controls (black) from the caudal region of interest. The black symbol represents the average plus/minus 1 SD for control subjects. The green symbol represents the average plus/minus 1 SD for patients with PD. (B) Same as in A but data are from rater 2. (C) Receiver operating characteristic plots from the rostral (blue), middle (green), and caudal (red) region of interest. The caudal region had the greatest sensitivity and specificity.
Table 2 Receiver operator characteristics analysis
In the assessment of inter-rater reliability between raters 1 and 2, there was strong agreement for the three primary areas of interest: intraclass correlation coefficient from the rostral ROI was 0.808, middle ROI was 0.832, and caudal ROI was 0.96. We also performed unpaired t tests between the two raters for FA in each ROI and all three t tests were nonsignificant. Details on the control analysis in the cerebral peduncle, other dependent measures, and relation between FA and the Unified Parkinson’s Disease Rating Scale are presented in the table e-2.
DISCUSSION
There were three novel findings in this study. First, we demonstrated that the FA values were reduced in the SN of early stage, unmedicated patients with PD. Second, the difference between de novo patients with PD and healthy control subjects was greatest in the caudal ROI of the SN compared with the middle and rostral SN ROI. Third, all de novo patients with PD were distinguished from all healthy individuals with 100% sensitivity and specificity. These findings were consistent across two independent, blinded raters. Our DTI assessment therefore detected not only group differences, but also accurate individual assignment.
In humans, two previous studies using DTI showed that FA in the substantia nigra is reduced in patients with PD compared to healthy individuals.4,6 In those studies, patients were more severely impaired than the patients in the current study, and the patients in these two previous studies were examined while on dopaminergic medication. The current study extends the previous literature to show that early stage, de novo patients with PD have reduced FA in the SN. In addition, although group-level differences for FA in the SN were significant in both previous studies between patients with PD and control subjects,4,6 on an individual basis, FA measures could not identify PD patients consistently. For instance, a case-controlled study4 reported an area under the curve that was considered modest (0.653), suggesting that DTI may not be a promising method for identifying PD in individual subjects.
Many factors may influence the ability of DTI to discriminate patients with PD from healthy individuals. These factors include the field strength of the magnet, spatial resolution, signal-to-noise ratio, contrast-to-noise ratio, image artifacts, and zones within the SN where the ROI are drawn. Previous DTI studies have used MRI at 1.5 Tesla.4,6 In contrast, the current study was carried out using a high-resolution DTI sequence at 3 Tesla with state-of-the-art parallel imaging techniques. This technique allows a high spatial resolution to be achieved with adequate signal-to-noise ratio. Three 30.6 mm3 ROI were drawn in targeted segments of the SN. Previous DTI studies have typically drawn one ROI in the SN. One study4 reported using a single ROI volume of 40 mm3. Our choice of using three smaller ROI based on the known degeneration pattern in PD may have strengthened our ability to target specific regions of degeneration in the SN and detect regional changes. The finding that the caudal ROI was more impaired than the middle and rostral ROI is in line with pathologic patterns of nigral degeneration and suggests that DTI-based FA is a measure that anatomically focuses on the main target of PD-related pathology.
There are two likely explanations for the between-group difference in FA in the rostral and caudal ROI, and these are not mutually exclusive. The first explanation is that the rostral region of the hypointense area of a T2-weighted image may include more than just the SN. T2-weighted images with proton density-weighted spin-echo and fast short inversion time inversion-recovery imaging show that the rostral part of the hypointense region on an axial slice of a T2-weighted image contains both the SN and cerebral peduncle. Our rostral ROI may have included the SN and cerebral peduncle, and this may have decreased our ability to separate PD from healthy individuals in the rostral SN. This limitation does not apply to the caudal ROI, where the most robust effects were observed. It is important to note that the control ROI that was placed lateral to the SN in the cerebral peduncle (figure 1 and appendix e-1) did not differ for any measure between groups. Also, the FA value in the cerebral peduncle was considerably higher than the FA value for the rostral ROI of the SN (e-data). The second explanation is that degeneration in the SN of patients with PD occurs more in the ventral and caudal portion compared with the rostral portion of the SN. Indeed, postmortem studies in humans have shown dopaminergic cell loss mostly occurs in the ventrolateral and caudal segment of the SN pars compacta, whereas normal aging affects cells in the dorsomedial SN pars compacta.3 The greatest difference was found in the caudal ROI and this is consistent with the region of the SN where dopaminergic cell loss primarily occurs in PD.1,3 Also, the current finding that the caudal portion of the SN is more impaired than the rostral segment is consistent with recent proton density imaging techniques reflecting higher iron content caudally.5
Other neuroimaging tests such as PET or SPECT distinguish patients with PD from healthy individuals. PET scans assessing [18]F-dopa uptake distinguished 100% of clinically moderate patients with PD from healthy controls,20 with 85% correctly distinguished early in the disease.21 When the tracer [11-C]FE-CIT was used, PET scans correctly distinguished 100% of the individuals with mild PD from healthy controls.22 An overall sensitivity and specificity of 96% was observed in distinguishing individuals with mild to severe PD from healthy controls when using SPECT with the tracer [123I]FP-CIT.23 Our data suggest that high resolution DTI performs as well as PET and SPECT. The current findings are important because PET units are more limited in availability than 3 Tesla MRI units, and the cost of PET is higher than MRI.24 Most importantly, DTI is noninvasive and does not require the use of radioactive tracers, suggesting its potential safe application for longitudinal follow-up and repeated assessments.25
Future studies may investigate whether DTI can detect preclinical degeneration in the SN and serve as a predictive test of PD. In addition, although previous studies show promise in using DTI to differentiate PD from atypical parkinsonism,26–28 large scale studies that use DTI in comparison with the gold standard of diagnosis by a movement disorders neurologist in different patient cohorts are needed. The effects of disease progression and medication intervention on DTI-based measures also need to be delineated.
ACKNOWLEDGMENT
The authors thank Dr. Christopher Goetz for his comments on the manuscript and the patients for their time and commitment to this research.
Supplementary Material
Address correspondence and reprint requests to Dr. David E. Vaillancourt, University of Illinois at Chicago, 1919 West Taylor, 650 AHSB, MC 994, Chicago, IL 60612 court1@uic.edu
Supplemental data at www.neurology.org
Editorial, page 1374
e-Pub ahead of print on January 7, 2009, at www.neurology.org.
Supported by grants from the NIH (R01-NS-52318, R01-NS58487, R01-NS-28127, R01-NS-40902, R21-AG28662).
Disclosure: The authors report no disclosures.
Received July 10, 2008. Accepted in final form October 3, 2008.
REFERENCES
- 1.Hodaie M, Neimat JS, Lozano AM. The dopaminergic nigrostriatal system and Parkinson’s disease: molecular events in development, disease, and cell death, and new therapeutic strategies. Neurosurgery 2007;60:17–28; discussion 28–30. [DOI] [PubMed]
- 2.Braak H, Del Tredici K, Rub U, de Vos RA, Jansen Steur EN, Braak E. Staging of brain pathology related to sporadic Parkinson’s disease. Neurobiol Aging 2003;24:197–211. [DOI] [PubMed] [Google Scholar]
- 3.Fearnley JM, Lees AJ. Ageing and Parkinson’s disease: substantia nigra regional selectivity. Brain 1991;114:2283–2301. [DOI] [PubMed] [Google Scholar]
- 4.Chan LL, Rumpel H, Yap K, et al. Case control study of diffusion tensor imaging in Parkinson’s disease. J Neurol Neurosurg Psychiatry 2007;78:1383–1386. [DOI] [PMC free article] [PubMed] [Google Scholar]
- 5.Martin WR, Wieler M, Gee M. Midbrain iron content in early Parkinson disease: a potential biomarker of disease status. Neurology 2008;70:1411–1417. [DOI] [PubMed] [Google Scholar]
- 6.Yoshikawa K, Nakata Y, Yamada K, Nakagawa M. Early pathological changes in the parkinsonian brain demonstrated by diffusion tensor MRI. J Neurol Neurosurg Psychiatry 2004;75:481–484. [DOI] [PMC free article] [PubMed] [Google Scholar]
- 7.Kraus MF, Susmaras T, Caughlin BP, Walker CJ, Sweeney JA, Little DM. White matter integrity and cognition in chronic traumatic brain injury: a diffusion tensor imaging study. Brain 2007;130:2508–2519. [DOI] [PubMed] [Google Scholar]
- 8.Mori S, Zhang J. Principles of diffusion tensor imaging and its applications to basic neuroscience research. Neuron 2006;51:527–539. [DOI] [PubMed] [Google Scholar]
- 9.Basser PJ, Mattiello J, LeBihan D. MR diffusion tensor spectroscopy and imaging. Biophys J 1994;66:259–267. [DOI] [PMC free article] [PubMed] [Google Scholar]
- 10.Boska MD, Hasan KM, Kibuule D, et al. Quantitative diffusion tensor imaging detects dopaminergic neuronal degeneration in a murine model of Parkinson’s disease. Neurobiol Dis 2007;26:590–596. [DOI] [PMC free article] [PubMed] [Google Scholar]
- 11.Hughes AJ, Daniel SE, Kilford L, Lees AJ. Accuracy of clinical diagnosis of idiopathic Parkinson’s disease: a clinico-pathological study of 100 cases [see comments]. J Neurol Neurosurg Psychiatry 1992;55:181–184. [DOI] [PMC free article] [PubMed] [Google Scholar]
- 12.Hughes AJ, Daniel SE, Lees AJ. Improved accuracy of clinical diagnosis of Lewy body Parkinson’s disease. Neurology 2001;57:1497–1499. [DOI] [PubMed] [Google Scholar]
- 13.Zhou XJ, Maier JK, Reynolds HG. Method to reduce eddy current effects in diffusion-weighted echo planar imaging. United States Patent, 5. 1999;864:233. [Google Scholar]
- 14.Jones DK, Simmons A, Williams SC, Horsfield MA. Non-invasive assessment of axonal fiber connectivity in the human brain via diffusion tensor MRI. Magn Reson Med 1999;42:37–41. [DOI] [PubMed] [Google Scholar]
- 15.Basser PJ, Pierpaoli C. Microstructural and physiological features of tissues elucidated by quantitative-diffusion-tensor MRI. J Magn Reson B 1996;111:209–219. [DOI] [PubMed] [Google Scholar]
- 16.Wakana S, Jiang H, Nagae-Poetscher LM, van Zijl PC, Mori S. Fiber tract-based atlas of human white matter anatomy. Radiology 2004;230:77–87. [DOI] [PubMed] [Google Scholar]
- 17.Hasan KM, Narayana PA. Retrospective measurement of the diffusion tensor eigenvalues from diffusion anisotropy and mean diffusivity in DTI. Magn Reson Med 2006;56:130–137. [DOI] [PubMed] [Google Scholar]
- 18.Oikawa H, Sasaki M, Tamakawa Y, Ehara S, Tohyama K. The substantia nigra in Parkinson disease: proton density-weighted spin-echo and fast short inversion time inversion-recovery MR findings. AJNR Am J Neuroradiol 2002;23:1747–1756. [PMC free article] [PubMed] [Google Scholar]
- 19.Maclennan RN. Interrater reliability with SPSS for Windows 5.0. Am Statistician 1993;47:292–296. [Google Scholar]
- 20.Hu MT, White SJ, Herlihy AH, Chaudhuri KR, Hajnal JV, Brooks DJ. A comparison of (18)F-dopa PET and inversion recovery MRI in the diagnosis of Parkinson’s disease. Neurology 2001;56:1195–1200. [DOI] [PubMed] [Google Scholar]
- 21.Morrish PK, Sawle GV, Brooks DJ. Clinical and [18F] dopa PET findings in early Parkinson’s disease. J Neurol Neurosurg Psychiatry 1995;59:597–600. [DOI] [PMC free article] [PubMed] [Google Scholar]
- 22.Antonini A, Moresco RM, Gobbo C, et al. The status of dopamine nerve terminals in Parkinson’s disease and essential tremor: a PET study with the tracer [11-C]FE-CIT. Neurol Sci 2001;22:47–48. [DOI] [PubMed] [Google Scholar]
- 23.Benamer TS, Patterson J, Grosset DG, et al. Accurate differentiation of parkinsonism and essential tremor using visual assessment of [123I]-FP-CIT SPECT imaging: the [123I]-FP-CIT study group. Mov Disord 2000;15:503–510. [PubMed] [Google Scholar]
- 24.Ravina B, Eidelberg D, Ahlskog JE, et al. The role of radiotracer imaging in Parkinson disease. Neurology 2005;64:208–215. [DOI] [PubMed] [Google Scholar]
- 25.Volkow ND, Rosen B, Farde L. Imaging the living human brain: magnetic resonance imaging and positron emission tomography. Proc Natl Acad Sci USA 1997;94:2787–2788. [DOI] [PMC free article] [PubMed] [Google Scholar]
- 26.Schocke MF, Seppi K, Esterhammer R, et al. Diffusion-weighted MRI differentiates the Parkinson variant of multiple system atrophy from PD. Neurology 2002;58:575–580. [DOI] [PubMed] [Google Scholar]
- 27.Schocke MF, Seppi K, Esterhammer R, et al. Trace of diffusion tensor differentiates the Parkinson variant of multiple system atrophy and Parkinson’s disease. Neuroimage 2004;21:1443–1451. [DOI] [PubMed] [Google Scholar]
- 28.Paviour DC, Price SL, Stevens JM, Lees AJ, Fox NC. Quantitative MRI measurement of superior cerebellar peduncle in progressive supranuclear palsy. Neurology 2005;64:675–679. [DOI] [PubMed] [Google Scholar]
Associated Data
This section collects any data citations, data availability statements, or supplementary materials included in this article.


