Abstract
Objective:
To measure the association of cognition, visual perception, and motor function with driving safety in Alzheimer disease (AD).
Methods:
Forty drivers with probable early AD (mean Mini-Mental State Examination score 26.5) and 115 elderly drivers without neurologic disease underwent a battery of cognitive, visual, and motor tests, and drove a standardized 35-mile route in urban and rural settings in an instrumented vehicle. A composite cognitive score (COGSTAT) was calculated for each subject based on eight neuropsychological tests. Driving safety errors were noted and classified by a driving expert based on video review.
Results:
Drivers with AD committed an average of 42.0 safety errors/drive (SD = 12.8), compared to an average of 33.2 (SD = 12.2) for drivers without AD (p < 0.0001); the most common errors were lane violations. Increased age was predictive of errors, with a mean of 2.3 more errors per drive observed for each 5-year age increment. After adjustment for age and gender, COGSTAT was a significant predictor of safety errors in subjects with AD, with a 4.1 increase in safety errors observed for a 1 SD decrease in cognitive function. Significant increases in safety errors were also found in subjects with AD with poorer scores on Benton Visual Retention Test, Complex Figure Test-Copy, Trail Making Subtest-A, and the Functional Reach Test.
Conclusion:
Drivers with Alzheimer disease (AD) exhibit a range of performance on tests of cognition, vision, and motor skills. Since these tests provide additional predictive value of driving performance beyond diagnosis alone, clinicians may use these tests to help predict whether a patient with AD can safely operate a motor vehicle.
GLOSSARY
AD = Alzheimer disease; AVLT = Auditory Verbal Learning Test; Blocks = Block Design subtest; BVRT = Benton Visual Retention Test; CFT = Complex Figure Test; CI = confidence interval; COWA = Controlled Oral Word Association; CS = contrast sensitivity; FVA = far visual acuity; JLO = Judgment of Line Orientation; MCI = mild cognitive impairment; MMSE = Mini-Mental State Examination; NVA = near visual acuity; SFM = structure from motion; TMT = Trail-Making Test; UFOV = Useful Field of View.
People who develop Alzheimer disease (AD) will generally, at some point in the course of their progressive cognitive decline, become unable to safely drive an automobile. However, as the ability to diagnose AD in early and mild stages continues to improve, many individuals with a diagnosis of probable AD or mild cognitive impairment (MCI) may remain cognitively competent to continue driving for several more years. The obvious goal is to prevent crashes and other dramatic incidents while maximizing patients’ rights and freedom of mobility. Complicating the decision-making process are the biases that patients and families may bring to the situation, e.g., patients may desire to continue driving beyond a point of safety, while family members may either prematurely restrict driving or unwisely encourage driving. Poor awareness of acquired deficits and impaired judgment associated with AD further complicates the decision-making process of patients and their compliance with driving recommendations.1–3
The prevalence of dementia is increasing as the population ages, and automobile-dependent societies such as the United States will face a growing public health problem with elderly and demented drivers.4 One approach to addressing this problem is to identify empirically based predictors of unsafe driving in persons with AD. A standardized road test can classify older drivers with a recent history of at-fault crashes,5 lending itself to be used as an index of driver safety. Performance on tests of cognition, visual perception, and motor function has been shown to be associated with driving safety in older drivers5–9 and drivers with dementia.10–12 The use of neuropsychological tests to predict driver performance on a standardized road test may provide a noninvasive and relatively inexpensive index of cognitive impairments in AD that may decrease driver safety.
Neuropsychological test performance has previously been shown to be associated with driving safety in studies with a combination of AD and nondemented elderly individuals,13–15 but it has not been clear whether such tests provided additional predictive value beyond that of diagnosis alone. AD is known to impair visual, perception, and motor functions,16 which are critical for safe driving. The goal of the present study was to determine if performances on tests of cognition, visual perception, and motor function could predict the level of safety in licensed drivers with probable AD.
METHODS
Subjects.
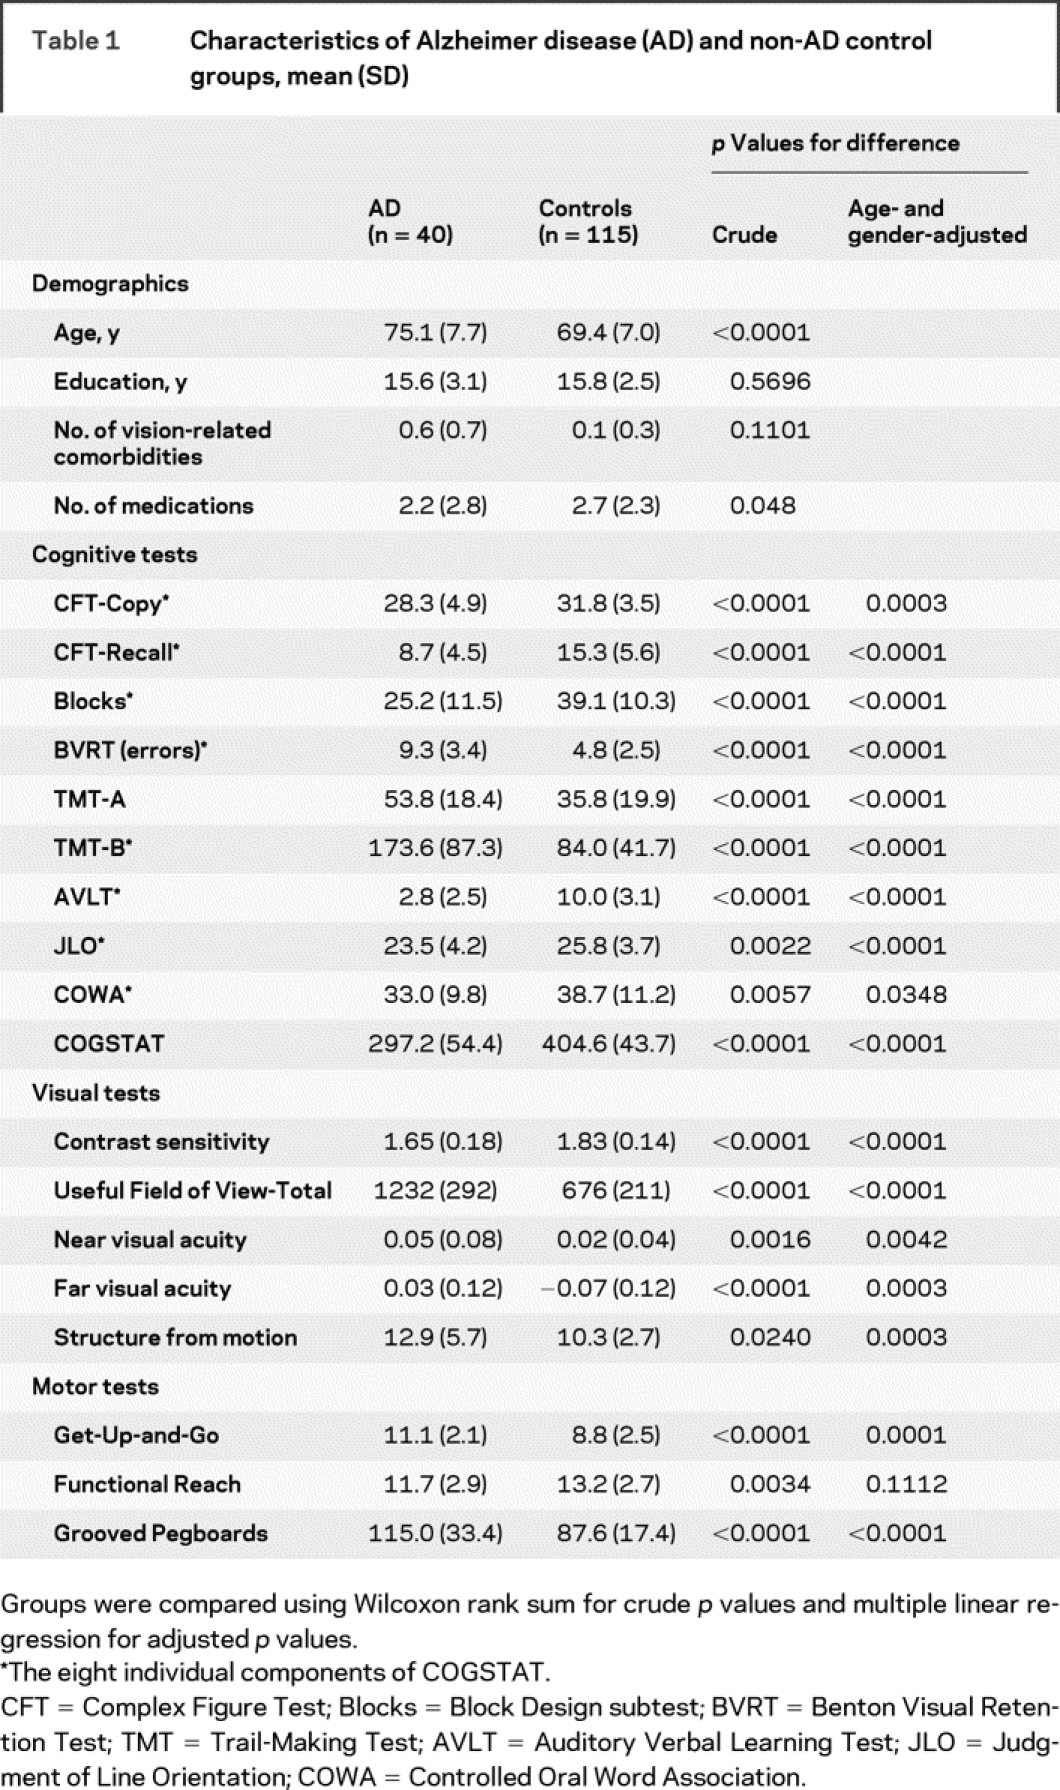
Subjects were 40 participants (33 men and 7 women) with mild AD and 115 elderly drivers without dementia (60 men and 55 women). Participants with AD were recruited from a registry maintained by the Department of Neurology. The diagnosis of probable AD was based on National Institute of Neurological and Communicative Disorders and Stroke–Alzheimer’s Disease and Related Disorders Association criteria.17 Accordingly, all AD participants had symptoms of memory impairment and related cognitive complaints that interfered with their social or occupational life. Mini-Mental State Examination (MMSE) screening reflected mild early cognitive decline in these still licensed drivers (mean MMSE ± SD = 26.5 ± 2.9). Ten Subjects with AD were taking Aricept. Impairments of memory and other cognitive domains on a standardized battery of neuropsychological tests (table 1) were consistent with early AD.18 Control participants were recruited from volunteers in the local community, who had no neurologic diagnosis or complaints, and no personal or family report of abnormal cognitive decline.
Table 1 Characteristics of Alzheimer disease (AD) and non-AD control groups, mean (SD)
All participants held a valid state driver’s license and were still driving, although some had reduced driving activity because of self-imposed or family-imposed restrictions. Exclusion criteria in both groups included non-AD neurologic disease, brain lesions due to cerebrovascular or neoplastic disease, alcoholism, stroke, depression or other psychiatric conditions, vestibular disease, and motion sickness. This study was approved by the Institutional Review Board at the University of Iowa, and informed consent was obtained in accord with institutional and federal guidelines for human subjects’ safety and confidentiality.
Off-road neuropsychological battery.
All participants were tested on a battery of cognitive, visual, and motor tasks (table 1). The Rey-Osterreith Complex Figure Test-Copy version (CFT-Copy) requires participants to copy a complex geometric figure, which provides an index of visuoconstructional ability. In the CFT-Recall version, a measure of visual anterograde memory, the subject is asked to draw the figure from memory 30 minutes after copying the CFT. The Block Design subtest (Blocks) from the WAIS-R provides an additional measure of visuoconstructional ability that correlates with performance IQ. The Benton Visual Retention Test (BVRT) stresses visual working memory. The Trail-Making Test subtest A (TMT-A) assesses visual search and visual motor speed, while subtest B (TMT-B) places demands on executive functions, including working memory and attentional set shifting. Rey Auditory Verbal Learning Test (AVLT) measures anterograde verbal memory. Judgment of Line Orientation (JLO) assesses visuospatial perception, by requiring matching lines of different orientation to target. The Controlled Oral Word Association (COWA) Test requires subjects, within a 1-minute time limit, to generate as many words as possible that begin with a certain letter of the alphabet. All of the above tasks are described in detail elsewhere.19,20 We calculated a composite measure of cognitive impairment (COGSTAT) by assigning and summing standard t scores (mean = 50, SD = 10) to each of the eight tests from the neuropsychological assessment battery (COWA, CFT-Copy, CFT-Recall, AVLT, BVRT, Blocks, JLO, and TMT-B), as in our previous work.21,22
The Useful Field of View (UFOV) task (Visual Attention Analyzer, Visual Resources Inc.) measures speed (in msec) of visual processing, divided attention, and selective attention.23,24 UFOV loss correlates with increased crash risk in simulated driving scenarios and real life crashes.23,24 We used the sum of four subtests of the UFOV task (UFOV-Total) in our analyses. Contrast sensitivity (CS) was assessed using the Pelli-Robson chart.25 The best-corrected visual acuity was measured using the Early Treatment Diabetic Retinopathy Study chart26 for far visual acuity (FVA) and reduced Snellen chart for near visual acuity (NVA), both expressed as logarithm of the minimum angle of resolution (logMAR), with 0 representing 20/20 vision. Perception of three-dimensional structure from motion (SFM) and motion direction were tested using computer-generated animation sequences.22
We also administered tests of motor abilities. Functional Reach is the difference between arm length and maximal forward reach using a fixed base of support. It is portable, inexpensive, precise, reliable, quick to administer, and useful for detecting balance impairment and change of balance performance over time.27,28 The Get-Up-and-Go task requires subjects to stand up from a chair, walk a short distance, turn around, return, and sit down again. It is safe, shows excellent interrater reliability, and appears to predict an elderly individual’s ability to safely go outside alone.28 The Grooved Pegboard task measures the time that it takes for subjects to insert noncylindrical metal pins into a small base stand using one hand per trial; we used the average time of the two trials per subject as a measure of motor dexterity and speed.
Instrumented vehicle.
The experimental drive was conducted aboard an instrumented vehicle known as ARGOS (the Automobile for Research in Ergonomics and Safety), a mid-sized car with an automatic transmission and hidden instrumentation and sensors.14,29–31 Experimental performance data (steering wheel position, accelerator and brake pedal position, lateral and longitudinal acceleration, and vehicle speed) were recorded at 10 Hz. Control of speed32 and lane position33 are critical aspects of driving, and unplanned lane deviations occur with degradation of driving performance.34 Driver’s lane tracking and visual scanning activity of the environment were recorded by videotape at 10 frames per second using four miniature lipstick-size cameras mounted unobtrusively within the vehicle.
Administering the road test.
The road test was generally administered within 2 months of the off-road battery, with a median of 28 days elapsed between the two visits. Each subject was seated in the driver’s seat, with the experimenter in the front passenger seat to give instructions and operate the dual controls, if needed. The experimental drive started after the driver acclimated to the vehicle on a short test drive, and lasted approximately 45 minutes. Road testing was carried out only during the day on specific roads within and surrounding Iowa City. Drivers were not tested in inclement weather that might cause poor visibility or road conditions. The drive incorporated several essential maneuvers such as turns, stopping at a stop sign, and maintaining vehicle control.
Safety errors.
A certified driving instructor reviewed the videotapes to assess the number and type of safety errors committed by the drivers. This instructor used a taxonomy based on the Iowa Department of Transportation’s Drive Test Scoring Standards (September 7, 2005 version), which included 76 error types (e.g., “unsafe passing,” “tailgating”) organized into 15 categories (e.g., “turns,” “lane observance”). Of the 76 error types, 30 were classified by our research team as “more serious,” and the rest were considered “less serious.” For example, if a subject failed to yield the right of way at a stop sign, this was judged as more serious, since this behavior may lead to a near crash or crash. We tabulated the total number of safety errors, the number of safety errors within each category, and the total number of more serious and less serious safety errors.
Statistical analysis.
We compared the groups with respect to demographics, neuropsychological measures, and safety error outcomes using the Wilcoxon rank sum test. Multiple linear regression was used to adjust for age and gender when comparing neuropsychological measures and safety errors. We also used multiple linear regression to test for associations between neuropsychological measures and total safety errors within the AD group, after adjusting for age and gender. For these analyses, we expressed the regression coefficients in terms of the average difference in safety errors per 1 SD difference in each neuropsychological measure, facilitating comparisons of magnitude of effect across predictors. In addition to examining the effect of neuropsychological tests individually, we modeled their simultaneous effects using multiple linear regression. We used standard regression diagnostic methods to assess the appropriateness of our models.
RESULTS
Table 1 presents demographic and neuropsychological descriptions of the two groups. Compared to subjects without AD, the subjects with AD were older and on fewer medications. They also had more vision-related comorbidities, but this was not significant. The AD group performed worse than the control group on almost all neuropsychological tests.
As shown in table 2, drivers with AD committed an average of 42.0 total safety errors/drive, compared to an average of 33.2 for controls without AD. Adjusting for age and gender, the mean (95% confidence interval [CI]) of the between-group difference was 5.9 (1.2, 10.6) for total errors, 2.3 (1.5, 3.0) for more serious errors, 3.7 (0.0, 7.5) for less serious errors, and 5.1 (1.7, 8.5) for lane observance errors. Increased age was predictive of total safety errors, with a mean of 2.3 more errors per drive observed for each 5-year age increment; gender was not significant.
Table 2 Driver safety errors in Alzheimer disease (AD) and normal control groups
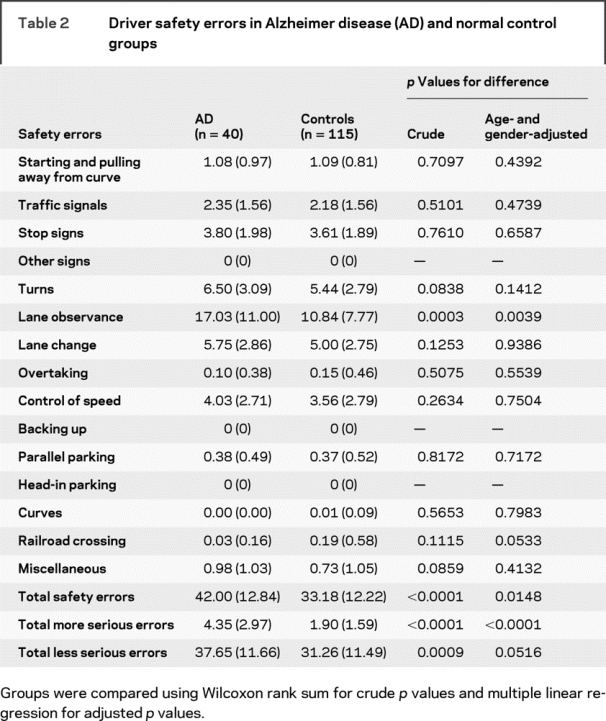
Other than lane observance errors (a.k.a., lane deviations), no other general category of errors was significantly more common in the AD group. Among more serious errors, straddling the center line (one of eight types of errors within the general category of lane observance errors) was the most common type, followed by failing to proceed through intersection even though the light had turned green (a specific type of traffic signal error). Both of these error types were significantly more common in drivers with AD than in drivers without AD. There was a borderline indication that railroad crossing errors may have been higher in the non-AD group (adjusted p = 0.053).
We randomly selected videotapes from 30 participants for a second video review by our driving expert, as well as by a second rater. Among these 30 drivers, we found that the intrarater correlation for total safety errors was 95%, while the interrater correlation was 73%.
Table 3 shows that the drivers with AD with higher overall cognitive function (measured by COGSTAT) tended to make fewer total safety errors. Several individual tests also were significant predictors of safety errors among drivers with AD, including measures of working memory (BVRT), visual search and visual motor speed (TMT-A), visuoconstructional abilities (CFT-Copy), and motor function (Functional Reach). Tests that were nearly significant in subjects with AD included CFT-Recall, TMT-B, and UFOV-Total.
Table 3 Changes in total safety errors for a 1 SD increase in cognitive, visual, and motor predictors
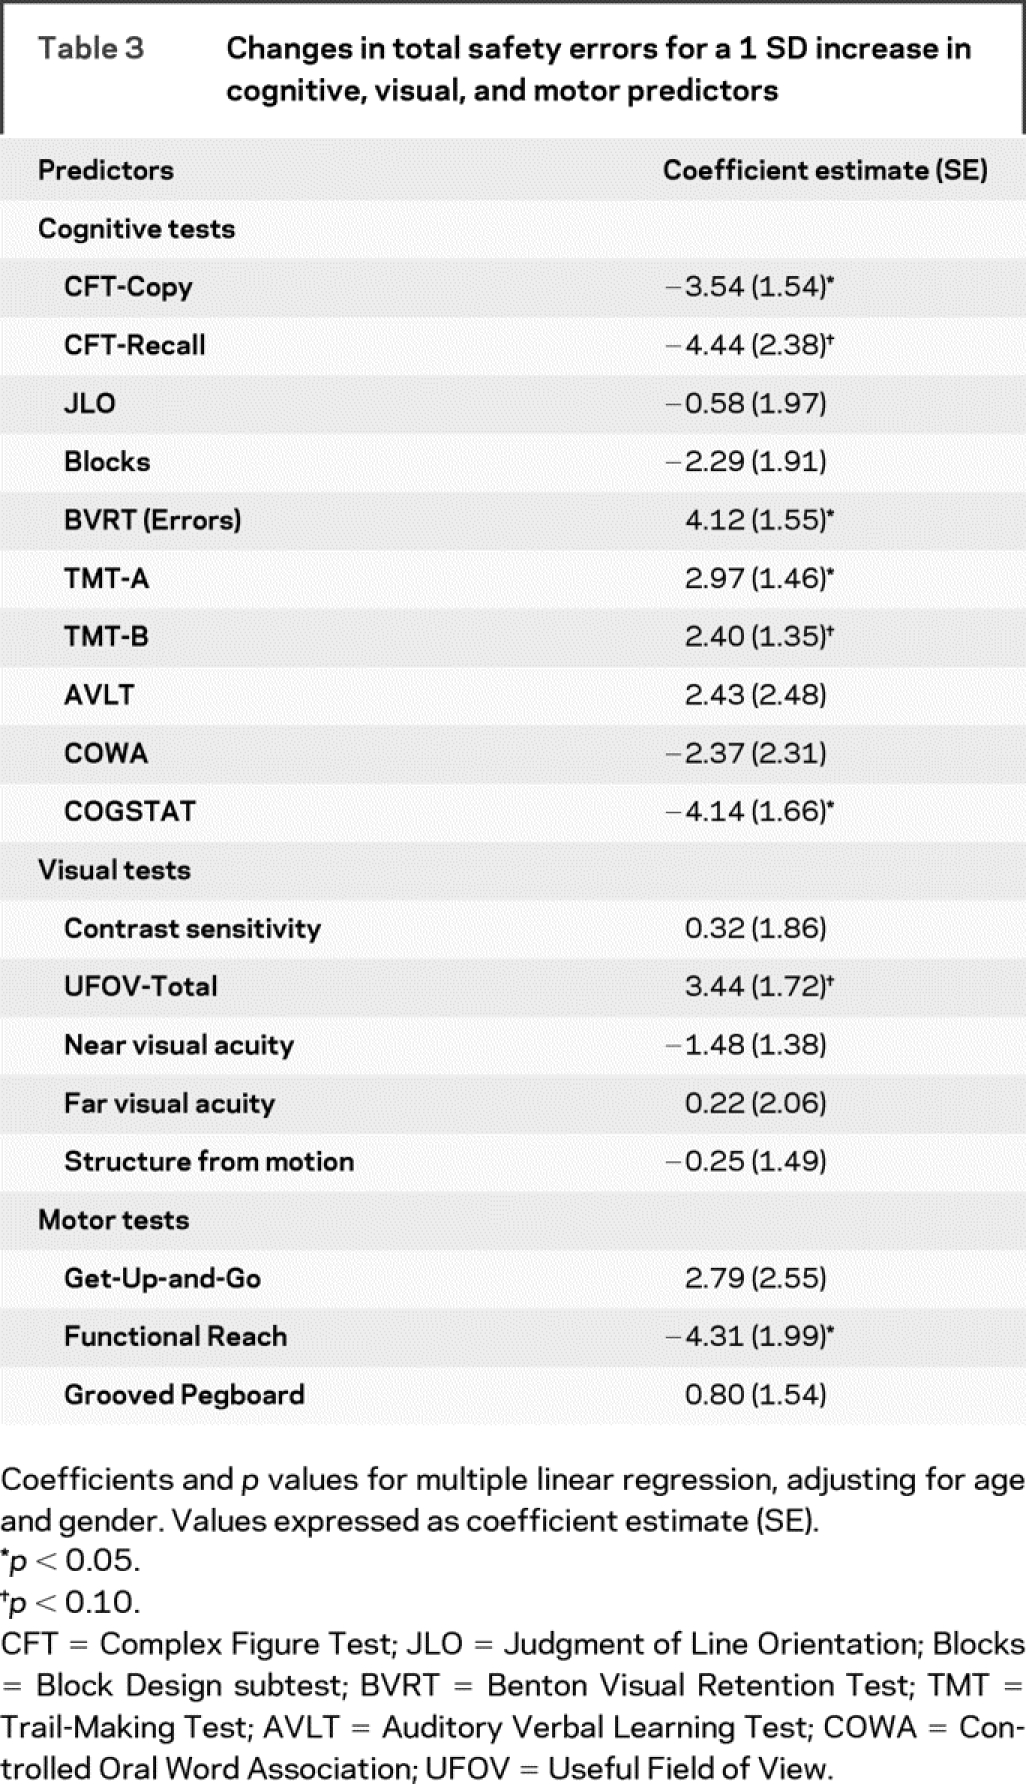
Since lane observance errors were the most common type of safety error, accounting for the majority of the between-group differences, we repeated our analyses using lane observance errors as the outcome. We found that this outcome was significantly predicted by worse scores on CFT-Copy, UFOV-Total, and Functional Reach. COGSTAT, BVRT, and Get-Up-and-Go were nearly significant predictors.
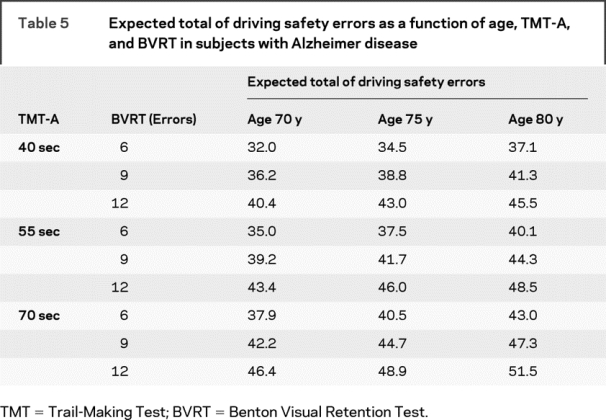
When predicting total errors in subjects with AD, we found that age, BVRT, and TMT-A modeled together resulted in an appropriate balance of model fit (adjusted R2 near the maximum achieved) and parsimony (e.g., only three predictor variables). According to this model (table 4), an increase of 2 years in age corresponded to an increase of 1.0 driving error, an increase of 1 error on BVRT corresponded to an average increase of 1.4 driving errors, and an additional 5 seconds to complete the TMT-A task corresponded to an increase of 1.0 driving error. Table 5 illustrates how these three risk factors predict safety errors. For each of these risk factors, we chose low, medium, and high levels representative of the subjects with AD in our study. Across these ranges of risk factors, table 5 shows that subjects with AD with high-risk profiles tend to commit noticeably more safety errors than those with low-risk profiles, even when keeping age fixed. This model assumed that the factor effects were additive, which was supported by nonsignificant tests of interaction.
Table 4 Multivariable regression model predicting total safety errors in subjects with Alzheimer disease (R2 = 0.29; adjusted R2 = 0.23)
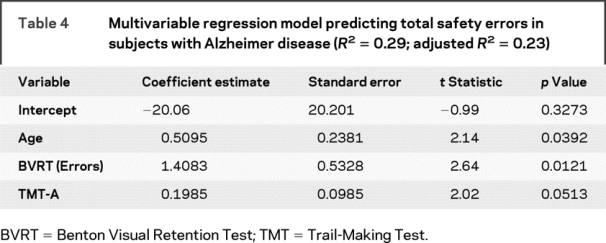
Table 5 Expected total of driving safety errors as a function of age, TMT-A, and BVRT in subjects with Alzheimer disease
DISCUSSION
This study aimed to measure the association of cognition, visual perception, and motor function with driving safety in drivers with AD. We found that drivers with AD make more total safety errors, lane observance errors, and serious safety errors than elderly drivers without AD. For predicting safety errors within the AD group, off-road neuropsychological tests of cognition, vision, and motor abilities gave additional information above and beyond diagnosis alone. Hence, performance on these tests can be helpful when predicting whether a patient with AD can safely drive a vehicle.
Our results showing that drivers with mild AD make more safety errors than older drivers without dementia on a standardized road test are compatible with other studies of driving in dementia.10,35 Previous studies of driving safety often have not adjusted analyses for diagnosis,36 making it difficult to assess the added value of tests beyond the diagnosis of dementia. In AD, it is expected that cognitive abilities will continue to decline after the diagnosis, and there is a great range of cognitive abilities and impairments in individuals with a diagnosis of AD. Our finding that active drivers with AD and poorer cognitive abilities show greater performance impairments leading to safety errors is an important step in defining the hypothetical causal relationships between cognition, driving errors, and car crashes.
We found that a composite score reflecting test performances across multiple cognitive domains was the best predictor of driving safety in persons with AD. This is consistent with both the multifaceted cognitive demands of driving and the range of cognitive impairments resulting from AD. Given that driving puts demands on diverse cognitive functions, it is unlikely that a test of any single cognitive ability will be an accurate predictor of driving safety. It is clear that impairment of anterograde memory, generally considered to be the hallmark of AD, is not a good indicator of driving ability in this population, and we have previously found that even persons with severe amnesia can perform most aspects of automobile operation without substantial difficulty.37 Lane deviations were the most common safety violations committed by the subjects with AD and, consistent with the findings of a recent meta-analysis,36 we found that tests placing demands on both visuospatial abilities and motor responses were among the best predictors of driving safety. It appears likely that these tests are measuring impairments of the requisite visuospatial and visuomotor abilities for maintaining a moving vehicle within lane boundaries. Given that AD results in progressive and widespread dysfunction in posterior association cortices, which are known to provide necessary substrates for visuospatially mediated tasks, this is a plausible key contributor to the unsafe driving of persons with AD.
Of the 15 general categories of errors that we examined (table 2), only lane observance errors were significantly more common in drivers with AD. This suggests that drivers with mild AD have the ability to handle certain aspects of driving. Also, though not quite significant, the drivers with AD made fewer errors at railroad crossings. This may be an example where drivers without AD are likely to be confident when approaching an area of potential hazard, while drivers with AD are likely to be cautious. Being overly confident often leads to safety errors when the potential hazard is a railroad crossing (where drivers without AD may make more errors), whereas in the case of traffic signals, being overly cautious can lead to the safety error of failing to proceed through a green light (committed more often by drivers with AD).
Our study has a number of limitations. Although our driving test was designed to be as unobtrusive as possible, it was still an experimental setting and drivers may have performed differently than they would have in their own vehicles in a more naturalistic setting. Also, driving safety is likely to be affected by a number of other environmental factors that we did not investigate, such as presence of family members in the vehicle, weather and road conditions, distance traveled, and time of day. Also, our sample of patients with AD only included seven women, so our study may have been underpowered to detect gender effects. Additionally, our subject identification numbering system was such that our expert rater may have been aware of a driver’s diagnosis status (though not the specific off-road scores) when reviewing the tapes for errors. Finally, although we had videotaped information based on views from four cameras, our rater may have missed some errors that would have been easier to detect if he had been in the vehicle during the drive.
Our current results underscore the fact that linkages between driving performance and abilities measured by off-road tests of cognitive, visual, and motor abilities can help standardize the assessment of fitness to drive. By understanding patterns of driver errors that may cause crashes, it may be possible to design interventions to reduce these errors and injuries and preserve mobility.
AUTHOR CONTRIBUTIONS
Statistical analysis was conducted by J.D.D. and E.D.
Address correspondence and reprint requests to Dr. Jeffrey D. Dawson, Department of Biostatistics, University of Iowa College of Public Health, 200 Hawkins Dr., C-22 GH, Iowa City, IA 52242 jeffrey-dawson@uiowa.edu
Supported by NIA AG 17717 and NIA AG 15071.
Disclosure: The authors report no disclosures.
Received August 4, 2008. Accepted in final form October 31, 2008.
REFERENCES
- 1.Anderson SW, Tranel D. Awareness of disease states following cerebral infarction, dementia, and head trauma: standardized assessment. Clin Neuropsychol 1989;3:327–339. [Google Scholar]
- 2.Starkstein SE, Mizrahi R, Jorge R, Robert R. A diagnostic formulation for anosognosia in Alzheimer’s disease. J Neurol Neurosurg Psychiatry 2006;77:719–725. [DOI] [PMC free article] [PubMed] [Google Scholar]
- 3.Souchay C. Metamemory in Alzheimer’s disease. Cortex 2007;43:987–1003. [DOI] [PubMed] [Google Scholar]
- 4.Hopkins RW, Kilik L, Day DJ, Rows C, Tseng H. Driving and dementia in Ontario: a quantitative assessment of the problem. Can J Psychiatry 2004;49:434–438. [DOI] [PubMed] [Google Scholar]
- 5.De Raedt R, Ponjaert-Kristoffersen I. Predicting at-fault car accidents of older drivers. Accid Anal Prev 2001;33:809–819. [DOI] [PubMed] [Google Scholar]
- 6.Odenheimer GL, Beaudet M, Jette AM, Albert MS, Grande L, Minaker KL. Performance-based driving evaluation of the elderly driver: safety, reliability, and validity. J Gerontol 1994;49:M153–M159. [DOI] [PubMed] [Google Scholar]
- 7.McGwin G, Jr, Chapman V, Owsley C. Visual risk factors for driving difficulty among older drivers. Accid Anal Prev 2000;32:735–744. [DOI] [PubMed] [Google Scholar]
- 8.Owsley C, Ball K, McGwin G Jr, et al. Visual processing impairment and risk of motor vehicle crash among older adults. JAMA 1998;279:1083–1088. [DOI] [PubMed] [Google Scholar]
- 9.Marottoli RA, Cooney LM Jr, Wagner R, Doucette J, Tinetti ME. Predictors of automobile crashes and moving violations among elderly drivers. Ann Intern Med 1994;121:842–846. [DOI] [PubMed] [Google Scholar]
- 10.Ott BR, Heindel WC, Papandonatos GD, et al. A longitudinal study of drivers with Alzheimer disease. Neurology 2008;70:1171–1178. [DOI] [PMC free article] [PubMed] [Google Scholar]
- 11.Ott BR, Festa EK, Amick MM, Grace J, Davis JD, Heindel WC. Computerized maze navigation and on-road performance by drivers with dementia. J Geriatr Psychiatry Neurol 2008;21:18–25. [DOI] [PMC free article] [PubMed] [Google Scholar]
- 12.Brown LB, Ott BR. Driving and dementia: a review of the literature. J Geriatr Psychiatry Neurol 2004;17:232–240. [DOI] [PMC free article] [PubMed] [Google Scholar]
- 13.Grace J, Amick MM, D’Abreu A, Festa EK, Heindel WC, Ott BR. Neuropsychological deficits associated with driving performance in Parkinson’s and Alzheimer’s disease. JINS 2005;11:766–775. [DOI] [PMC free article] [PubMed] [Google Scholar]
- 14.Rizzo M, McGehee D, Petersen AD, Dingus TA. Development of an unobtrusively instrumented field research vehicle for objective assessments of driving performance. In: Rothengatter T, Carbonnel VE, eds. Traffic and Transport Psychology: Theory and Application. New York: Pergamon; 1997:203–208.
- 15.Uc EY, Rizzo M, Anderson SW, Shi Q, Dawson JD. Driver route-following and safety errors in early Alzheimer disease. Neurology 2004;63:832–837. [DOI] [PubMed] [Google Scholar]
- 16.Rizzo M, Anderson SW, Dawson J, Nawrot M. Vision and cognition in Alzheimer’s disease. Neuropsychologia 2000;38:1157–1169. [DOI] [PubMed] [Google Scholar]
- 17.McKhann G, Drachman D, Folstein M, Katzman R, Price D, Stadlan EM. Clinical diagnosis of Alzheimer’s disease: report of the NINCDS-ADRDA Work Group under the auspices of Department of Health and Human Services Task Force on Alzheimer’s Disease. Neurology 1984;34:939–944. [DOI] [PubMed] [Google Scholar]
- 18.Salmon DP, Thomas RG, Pay MM, et al. Alzheimer’s disease can be accurately diagnosed in very mildly impaired individuals. Neurology 2002;59:1022–1028. [DOI] [PubMed] [Google Scholar]
- 19.Lezak MD. Neuropsychological Assessment. New York: Oxford University Press; 1995. [Google Scholar]
- 20.Spreen O, Strauss E. A Compendium of Neuropsychological Tests. New York: Oxford University Press; 1991. [Google Scholar]
- 21.Rizzo M, McGehee DV, Dawson JD, Anderson SW. Simulated car crashes at intersections in drivers with Alzheimer disease. Alzheimer Dis Assoc Disord 2001;15:10–20. [DOI] [PubMed] [Google Scholar]
- 22.Rizzo M, Nawrot M. Perception of movement and shape in Alzheimer’s disease. Brain 1998;121:2259–2270. [DOI] [PubMed] [Google Scholar]
- 23.Ball K, Owsley C, Sloane ME, Roenker DL, Bruni JR. Visual attention problems as a predictor of vehicle crashes in older drivers. Invest Ophthalmol Vis Sci 1993;34:3110–3123. [PubMed] [Google Scholar]
- 24.Owsley C, Ball K, Sloane ME, Roenker DL, Bruni JR. Visual/cognitive correlates of vehicle accidents in older drivers. Psychol Aging 1991;6:403–415. [DOI] [PubMed] [Google Scholar]
- 25.Pelli DG, Robson JG, Wilkins AJ. The design of a new letter chart for measuring contrast sensitivity. Clin Vis Sci 1988;2:187–199. [Google Scholar]
- 26.Ferris FL, III, Kassoff A, Bresnick GH, Bailey I. New visual acuity charts for clinical research. Am J Ophthalmol 1982;94:91–96. [PubMed] [Google Scholar]
- 27.Duncan PW, Weiner DK, Chandler J, Studenski S. Functional reach: a new clinical measure of balance. J Gerontol 1990;45:M192–M197. [DOI] [PubMed] [Google Scholar]
- 28.Alexander NB. Postural control in older adults. J Am Geriatr Soc 1994;42:93–108. [DOI] [PubMed] [Google Scholar]
- 29.Barry CJ, Smith D, Lennarson P, et al. The effect of wearing a restrictive neck brace on driver performance. Neurosurgery 2003;53:98–102. [DOI] [PubMed] [Google Scholar]
- 30.Uc EY, Rizzo M, Anderson SW, Shi Q, Dawson JD. Driver identification of landmarks and traffic signs after a stroke. Transportation Research Record J Transportation Research Board 2005;1922:9–14. [Google Scholar]
- 31.Rizzo M, Stierman L, Skaar N, Dawson JD, Anderson SW, Vecera SP. Effects of a controlled auditory-verbal distraction task on older driver vehicle control. Transportation Research Record J Transportation Research Board 2004;1865:1–6. [Google Scholar]
- 32.Monty RW. Eye movements and driver performance with automotive displays. Dissertation; Virginia Polytechnic Institute and State University; 1984.
- 33.Godthelp H. Vehicle control during curve driving. Hum Factors 1986;28:211–221. [DOI] [PubMed] [Google Scholar]
- 34.Dingus TA, Antin JF, Hulse MC, Wierwille WW. Attentional demand requirements of an automobile moving-map navigation system. Transportation Research 1989;4:301–315. [Google Scholar]
- 35.Duchek JM, Carr DB, Hunt L, et al. Longitudinal driving performance in early-stage dementia of the Alzheimer type. J Am Geriatr Soc 2003;51:1342–1347. [DOI] [PubMed] [Google Scholar]
- 36.Reger MA, Welsh RK, Watson GS, Cholerton B, Baker LD, Craft S. The relationship between neuropsychological functioning and driving ability in dementia: a meta-analysis. Neuropsychology 2004;18:85–93. [DOI] [PubMed] [Google Scholar]
- 37.Anderson AM, Skoblar BM, White T, et al. Selection of normative reference data influences clinical considerations. Presented at the 35th Annual International Neuropsychological Society meeting; February 8, 2007; Portland.


