

Abstract
Background:
Determination of auditory function is a fundamental part of a complete neurologic examination. Disability from permanent hearing loss is common in the general population. Current bedside auditory tests are unreliable and cumbersome. We evaluated the calibrated finger rub auditory screening test (CALFRAST) as a routine diagnostic tool.
Methods:
The sound spectrum and mean peak intensities of standard finger rub were measured, as well as background noise. CALFRAST overlapped the frequency spectrum of normal speech. Patients and companions were recruited from a neurology clinic. With arms extended, two stimulus intensities were presented: strong finger rub (CALFRAST–Strong 70) and the faintest rub that the examiner could hear (CALFRAST–Faint 70). With subjects’ eyes closed, each ear’s CALFRAST threshold was ascertained and then compared with its audiometric measure. The normal threshold was considered to be 25 dB. Validity, reliability, and discrimination abilities were obtained using standard methods.
Results:
Two hundred twenty-one subjects (442 ears; 58% women) were examined. Ages ranged from 18 to 88 years, with a mean of 46 years. Eighty-five subjects (39%) had some degree of hearing loss. Both specificity and positive predictive value of CALFRAST–Strong 70 were 100%. Both sensitivity and negative predictive value of CALFRAST–Faint 70 were 99%, with a negative likelihood ratio <0.1. Area under the receiver operating characteristic curve was 0.94, consistent with excellent discrimination ability. Both intrarater and interrater reliability were excellent, both κ >0.8. Subjects’ self-assessment of hearing was unreliable.
Conclusion:
The calibrated finger rub auditory screening test (CALFRAST) is simple, accurate, inexpensive, and reliable. As a routine screening tool, CALFRAST may contribute to more efficient identification of auditory impairment.
GLOSSARY
- AHL
= aging-related hearing loss;
- AT
= auditory threshold;
- AUC
= area under the curve;
- CALFRAST
= calibrated finger rub auditory screening test;
- CI
= confidence interval;
- FN
= false negative;
- FP
= false positive;
- LR
= likelihood ratio;
- NIHL
= noise-induced hearing loss;
- NLR
= negative likelihood ratio;
- NPV
= negative predictive value;
- PLR
= positive likelihood ratio;
- PPV
= positive predictive value;
- ROC
= receiver operating characteristic;
- Sens
= sensitivity;
- Spec
= specificity;
- TN
= true negative;
- TP
= true positive.
Fundamental components of the routine neurologic examination comprise practical judgments of perception and performance. Auditory function has unquestionable clinical importance, but its evaluation is most often triggered by a symptomatic complaint or observation of impaired conversation. Hearing impairment should be determined by professional audiometry, but accurately gauging disability for referral requires a convenient and objective standard. Both sensitivity and reliability of conventional near-to-the-ear auditory tests are notoriously poor.1–3 The whispered voice test has limitations of standardization and calibration.4
The neurologic examination arbitrarily segregates many aspects of behavior, spontaneous or elicited, with some degrees of voluntary cooperation. If performance is not normal, how, and how much? Scoring mechanisms are devious. At one extreme is the numerical Snellen test card for visual acuity. Vibration sense is judged by duration of intensity, position sense is judged by joint angle, and plantar reflex is judged by hallux deflection. Arbitrary intensity scales grade tendon jerks and touch and pain sensibility. More complex observations, such as mental status, eye movements, facial expression, speech articulation, and limb coordination, require verbal descriptors.
Unique is the rationale for the conventional test for maximal voluntary limb muscle strength; the examiner’s resistive force is the direct measure of the subject’s strongest effort. This competition/comparison provides an analogy for auditory function, with the examiner acting as a surrogate hearing reference standard. The goal of the calibrated finger rub auditory screening test (CALFRAST) is to determine a degree of auditory dysfunction that would likely impair the comfortable understanding of speech.
METHODS
Recruitment of subjects.
The protocol was approved by the Human Research Protection Office at Washington University in St. Louis. This is a prospective study of a consecutive series of participants who were recruited from July 2007 to September 2008. Patients and their companions at the Movement Disorders Clinic and the General Neurology Clinic were offered the opportunity to participate. Informed consent was obtained.
Test procedure.
With the hand comfortably dry, the CALFRAST sound was produced by briskly rubbing the thumb across the distal fingers. Testing was conducted in an examination room that was quiet but not soundproof. We examined 221 participants for a total of 442 ears. Each individual was asked one question about hearing: “Do you feel you have a hearing loss?”5 After comfortably seating the subject on a bench, the examiner demonstrated the CALFRAST sound-making process and explained that the subject’s task would be to report hearing the sound by raising the hand on the side of the perceived signal. The subject was encouraged to listen carefully so as not to miss the faintest sound. With the subject’s eyes closed, the examiner stood nose to nose, 6 to 10 inches in front of the subject, and extended both arms straight laterally so that the moving fingers would be equidistant from the examiner’s and subject’s ears, a distance of approximately 70 cm (figure 1A). First, a strong finger rub (CALFRAST–Strong 70), as strong as one can perform without snapping the fingers, was presented to each ear separately and was repeated three times. If the subject reported accurately, the next test was the faint finger rub (CALFRAST–Faint 70), the softest rub that the examiner could hear with arms fully extended. If the participant heard CALFRAST–Faint 70 bilaterally, the testing was complete.
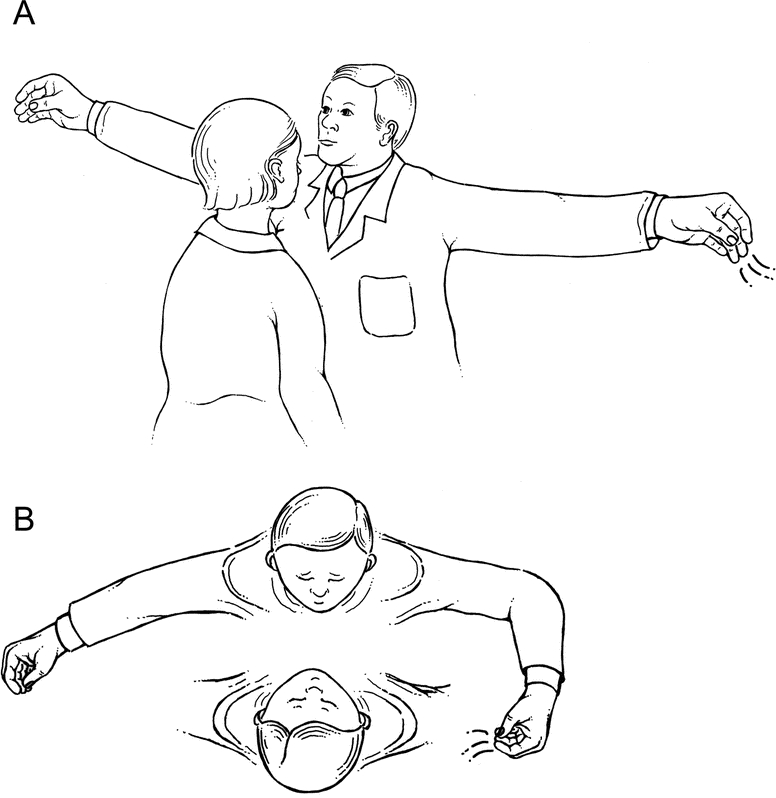
Figure 1 Test procedure
(A) Initial presentation of calibrated finger rub auditory screening test (CALFRAST) stimuli with full arm extension (CALFRAST–Strong 70 and CALFRAST–Faint 70). (B) CALFRAST–Strong 35 produced with the examiner’s forearm flexed to 90 degrees.
If the participant did not hear CALFRAST–Strong 70 with either ear, still louder stimuli were produced by bringing the strong rub closer to the tested ear at standard intervals of approximately 35, 10, and 2 cm. Halving the stimulus distance to approximately 35 cm was conveniently estimated by flexing the elbow to 90 degrees (CALFRAST–Strong 35; figure 1B). One hand breadth was conveniently used to mark the 10-cm distance (CALFRAST–Strong 10). The 2-cm distance stimulation was presented as close to the tragus as possible, without touching the earlobe (CALFRAST–Strong 2). The CALFRAST level for each ear was the weakest stimulus perceived. CALFRAST was always performed and results were annotated before the screening audiometry; the CALFRAST examiners were always blinded to the subjects’ true hearing ability.
Screening audiometry was then performed in the same examination room using a portable audiometer (Earscan3®; Micro Audiometrics, Murphy, NC). The earphones were fitted to the subject, and each ear was tested independently at 1,000, 2,000, and 4,000 Hz. The subject, with eyes closed, indicated perception by raising the hand on the stimulated side after each presentation of the triple-beep test stimulus. Intensity was then decreased in 5-dB steps from 80 to 20 dB, or until the subject did not respond. The last positive response was considered to be auditory threshold (AT). Subjects who did not hear the 80-dB signal were arbitrarily assigned 90 dB for calculation of the mean AT. The threshold standard for normal auditory perception was defined as 25 dB at all three test frequencies.
Testing for intrarater reliability.
Nineteen participants (38 ears) were retested by the same examiner. Raters were blinded to the previous test results, and attempts were made to have a long interval between sessions to avoid bias; the lag between sessions ranged from 2 to 13 months. The test results were classified as normal or abnormal based on the participant’s ability to hear CALFRAST–Faint 70. The dichotomized categorical variable was then analyzed for level of agreement between the two testing sessions.
Testing for interrater reliability.
Thirty-nine participants (78 ears) were retested by a second examiner. The examiners were blinded to each other’s results. The test results were classified as normal or abnormal based on the participant’s ability to hear CALFRAST–Faint 70 and were then analyzed by level of agreement between the two examiners.
Calibration of CALFRAST stimuli.
Several measures of acoustical energy were needed to establish the reference for CALFRAST testing. The range of sound frequencies that a young adult with normal hearing can perceive is approximately 20 to 20,000 Hz,6 a dynamic range of 1,000-fold. Sound intensities that can be heard comfortably extend from 1 × 10⁻¹² W/m2 for the softest up to 100 W/m2, the threshold for pain, a dynamic range of 1 × 10¹⁴. Acousticians deal with this range by converting watts per square meter to decibels: dB = 10 log (I/I0), where I = intensity at the measurement site and I0 = the softest intensity that can be heard. This compresses the intensity scale to a range (0–140 dB) that more closely represents human discrimination ability.
A sound emanating from a point source radiates outward as a spherical shell. The intensity decreases inversely in proportion to the square of the distance from source to measurement site, the “inverse square law.” Conversely, as the source moves closer, halving the distance quadruples the intensity, a 6-dB increase. The widely accepted standard for functionally adequate auditory acuity is the detection of a 25-dB signal across the typical speech frequencies, 400 to 3,000 Hz.6,7
Spectrum of the CALFRAST stimulus.
The spectrum of an acoustic signal is the intensity of the component frequencies at a particular distance from the source. The spectrum of the CALFRAST stimulus was determined in an office setting in the presence of background noise. The stimulus was measured with a microphone (ER10-B+®; Etymotic Research, Elk Grove Village, IL) at a distance of approximately 2 cm from the source and analyzed using Audacity software.8 Figure 2A shows the broad spectrum of background noise, 25–12,000 Hz. In the lower frequencies (25–1,000 Hz), the magnitudes were larger. Figure 2B shows the spectrum of combined background noise and the CALFRAST stimulus. Subtracting the spectrum of background noise from the combination revealed that the CALFRAST spectrum (figure 2C) gradually increased from 25 to 12,000 Hz, overlapping the speech frequencies that hearing impairment most often afflicts.
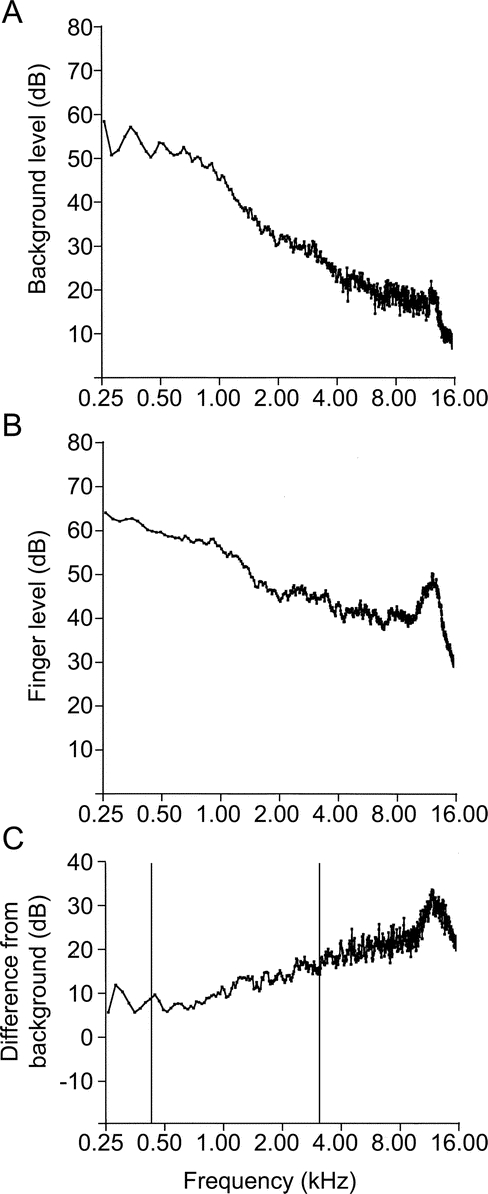
Figure 2 Frequency spectra of background noise, background noise plus CALFRAST, and the difference between them
Frequency spectra of background noise (A), background noise plus calibrated finger rub auditory screening test (CALFRAST) (B), and the difference between A and B (C). These spectra were measured in an office setting. In C, the vertical bars delimit the usual range of frequencies for human speech.
Intensity of the CALFRAST stimuli.
The CALFRAST stimuli were reproduced and the signal measured in a soundproof booth (120A-1®; Industrial Acoustics, Bronx, NY) with a sound level meter (no. 2203®; Brüel and Kjær, Nærum, Denmark) set to obtain the peak intensity within the frequency range of human hearing. The examiners were tested independently, and results of peak intensities were averaged. The mean for CALFRAST–Strong 70 was 31 ± 2 (SD) dBA (range 28–32 dBA) and for CALFRAST–Faint 70 was 25 ± 1 (SD) dBA (range 24–26 dBA). Intraexaminer variability was ±3 dBA over 5 seconds.
Background noise intensity.
The intensities of peak background noise were measured in three typical outpatient clinic examination rooms in various medical center areas. The mean background noise was 42 ± 3 (SD) dBA (range 39–44 dBA). Intraexaminer variability was ±2 dBA over approximately 10 seconds. The background noise had a broad spectrum (0.1 Hz–50 kHz) dominated by low frequencies (0.1–120 Hz).
Testing of examiners’ hearing.
Using the same audiometric routine as was used with the test subjects, our research examiners (D.T.R., K.S., and P.M.S.) were tested with the EarScan3® audiometer in a regular patient examination room. All three had bilateral auditory thresholds of 5 dB for the test frequencies of 1,000, 2,000, and 4,000 Hz.
Finger-to-tragus distance.
While holding the finger rubbing posture, the distance between the fingers and the subject’s tragus was measured in 50 consecutive subjects (100 arms). In men, this distance averaged 74 cm (SD 4.2 cm), and in women, it averaged 69 cm (SD 4.7 cm). Our three examiners’ finger-to-tragus distances fell within 2 SDs of these averages. Because of the inverse square law, the expected change in intensity from the variation in arm length would be negligible (less than 2 dB).
Statistical methods.
The receiver operating characteristic (ROC) curve is plotted with the sensitivity of each test level on the y-axis and the false-positive error rate (1-specificity) on the x-axis. During development of a new diagnostic test, it is essential to inspect the ROC curve to define the cutoff points with the best discrimination ability that should be further studied.9 Predictive values quantify how well the test result predicts true disease10 and are contingent on the prevalence of the tested condition in the population studied.11 Predictive values were calculated using the prevalence of hearing impairment in our sample and in the general population. Statistically, the data for each ear were handled independently. Failure to detect the testing stimulus was classified as a positive test result. Likelihood ratios (LRs) were calculated to quantify the change in the odds of disease conferred by knowledge of the test result, a measurement with obvious practical importance.10 Prevalence-weighted LRs were reported because conventional LRs are misleading when prevalence differs from 50%. LRs above 10 and below 0.1 were considered to be strong evidence for the test’s ability to discriminate reliably between significant hearing impairment and acceptable hearing.12 Also, the 95% confidence intervals (CIs) were determined whenever useful.13 The intrarater and interrater reliability were measured using the κ test.14
RESULTS
Two hundred twenty-one subjects (58% women) participated, for a total of 442 ears. The mean subject age was 46 years (SD 16.6 years), with a range of 18–88 years. Screening audiometry identified impaired hearing in 151 ears (34%), 85 participants (38.5%). The prevalence of hearing impairment in our subjects was similar to that in other neurology clinic populations.1,15 Table 1 shows the mean AT at each CALFRAST level. As the CALFRAST threshold increases, the mean AT increases, with a Spearman correlation coefficient of 0.827 (significance <0.01). Figure 3 shows further that the mean AT at each CALFRAST level parallels the mean peak intensity of the stimulus.
Table 1 Mean, maximum, and minimum auditory thresholds when the CALFRAST stimulus is not heard at various levels
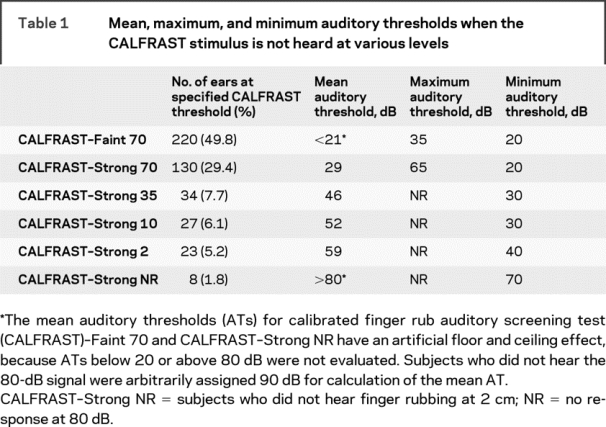
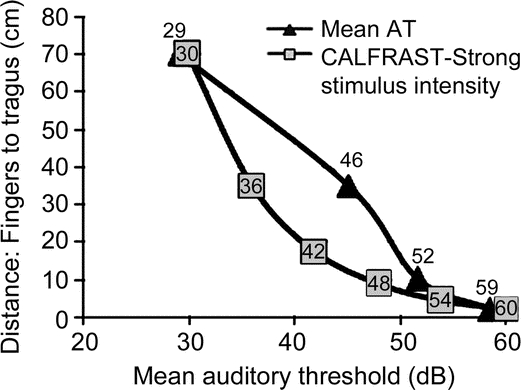
Figure 3 Comparison between the average AT measurements with the sound intensity at each distance from the tested ear
The squares indicate the intensity of the auditory stimulus at each distance of the calibrated finger rub auditory screening test (CALFRAST). The triangles show the mean auditory threshold (AT) of all ears that have that CALFRAST test level.
CALFRAST receiver operating characteristic curve.
The ROC curve was plotted to show the area under the curve (AUC) to be 0.944 (95% CI 0.924–0.965), consistent with excellent discriminatory abilities (1.0 is perfect).9,10 Looking for the best CALFRAST level to screen for hearing loss, the ROC curve was inspected, and CALFRAST–Faint 70 and CALFRAST–Strong 70 were the most promising for screening purposes.
CALFRAST–Strong 70.
Of the ears tested, 29% (130/442) were able to hear CALFRAST–Strong 70 but unable to hear the CALFRAST–Faint 70 stimulus (classified as CALFRAST–Strong 70; table 1). The mean AT for these ears is 29 dB. The sensitivity of CALFRAST–Strong 70 is 61% for hearing loss (CI 53–69; table 2). The negative predictive value (NPV) is 83% (CI 79–87), with a negative likelihood ratio (NLR) of 0.2 (CI 0.16–0.26).
Table 2 Statistical properties of CALFRAST–Strong 70 and CALFRAST–Faint 70 tests and self-diagnosis as compared with reference audiometry
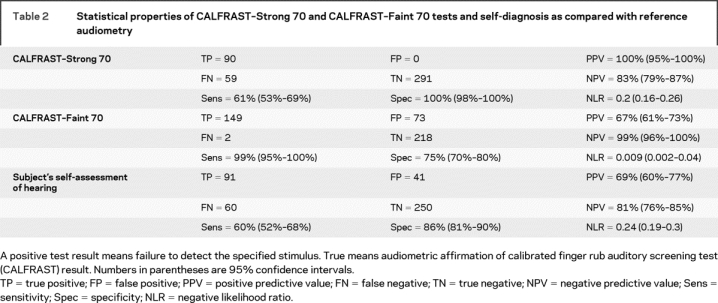
Ninety-two ears (21%) were unable to hear CALFRAST–Strong 70. None of these ears had normal hearing when evaluated by audiometry, providing a specificity of 100% and a positive predictive value (PPV) of 100%, with a positive likelihood ratio (PLR) approaching infinity. All of these subjects who were not able to hear strong finger rub with full arm extension had hearing impairment that ranged from mild to severe (table 1).
CALFRAST–Faint 70.
Of the 220 ears (50%) that were able to hear CALFRAST–Faint 70, only 2 had an AT above 25 dB, with a maximum AT of 35 dB, producing a sensitivity of 99% (CI 95–100; tables 1 and 2). If a participant could hear CALFRAST–Faint 70, hearing impairment was unlikely, as demonstrated by an NPV of 99% (CI 96–100) and an NLR = 0.009 (CI 0.002–0.04). The specificity is 75% (CI 70–80), with a PPV of 67% (CI 61–73). Thus, when CALFRAST–Faint 70 is perceived, the likelihood of clinically significant hearing impairment is negligible.
Discriminatory ability of CALFRAST for screening in the general population.
Because the prevalence of hearing loss increases with age, the usefulness of a hearing screening test in older populations decreases as a function of its NPV.11 The 9% prevalence of hearing loss in the general population is less than a fourth of that in our sample (39%),16 a difference related to the age and disabilities of neurologic patients and their companions. Thus, for the general population prevalence, CALFRAST– Strong 70 has a calculated NPV of 96% (CI 94–98) (NLR 0.04, CI 0.03–0.06) and a PPV of 100% (CI 83–100, PLR tending toward infinity). CALFRAST– Strong 70 can reliably screen for the presence or absence of hearing impairment in the general population.
Intrarater and interrater reliability.
Comparing the results of the two sessions performed by the same examiner, there was disagreement on only 2 of 38 ears. The intrarater reliability is therefore high (κ = 0.802). The results obtained independently by two different examiners were in disagreement in 6 of 78 ears. The interrater reliability is also excellent (κ = 0.831).
Subjects’ self-assessment of hearing loss.
Subjects did not notice their hearing loss in 60 of 442 ears (14%; table 2). Importantly, 48% of these ears had hearing impairment that would have been classified as moderate or severe. Subjects mistakenly thought that their hearing was abnormal in more than 9% of the ears. Thus, participants were wrong in self-evaluation of their hearing ability in 23% of the ears. Eighteen subjects (8% of our sample) did not realize that they had bilateral hearing loss, with a mean AT of approximately 45 dB (ranging from 30 dB to no response at 80 dB). Self-assessment of hearing loss (table 2) had a sensitivity of 60% (CI 52–68), with an NPV of 81% (CI 76–85) and an NLR of 0.24 (CI 0.19–0.3). Self-evaluation of hearing impairment is grossly inaccurate.
DISCUSSION
Aging-related hearing loss (AHL) begins at high and progresses to lower frequencies as the subject ages. Noise-induced hearing loss (NIHL), the next most common cause of permanent impairment, is characterized by an increased threshold at 4,000 Hz. CALFRAST sound spectrum covers the important frequencies for AHL, NIHL, and other etiologies of hearing loss, and overlaps those for normal speech, making it ideal for screening efficacy. Although CALFRAST has not been formally evaluated in children, the testing game has been successfully performed by 3 and 4 year olds.
We do not propose that use of the CALFRAST test be limited to clinicians who ascertain their own auditory capabilities and determine the intensity of their CALFRAST stimuli. Obviously, it is desirable for the examiner to have normal auditory acuity. But even without such determination, the test procedure can be used flexibly and adaptively in the same way that clinicians evaluate tendon jerks, varying the intensity of the hammer blow and even the use of the Jendrassik maneuver to ascertain presence, amplitude, and symmetry of reflex behavior. Indeed, a by-product of this investigation for one of the authors (W.M.L.) was the discovery of his own mild hearing loss. He finds that the practical utility of the CALFRAST test is unimpaired.17
We purposely designed CALFRAST to be useful without the need for any instrumentation or consideration of variations in the examiner’s finger rub skill. We wager that any reader who does not hear a firm self-generated finger rub with fully extended arm will find significant value from a hearing specialist consultation.
AUTHOR CONTRIBUTIONS
Statistical analysis was performed by D. Torres-Russotto and W.M. Landau.
ACKNOWLEDGMENT
The authors thank Catherine M. Roe, PhD, and James Galvin, MD, MPH (Alzheimer’s Disease Research Center, Department of Neurology, Washington University, St. Louis, MO), for their review of the manuscript and statistical recommendations.
Address correspondence and reprint requests to Dr. Diego Torres-Russotto, Department of Neurological Sciences–Movement Disorders Program, University of Nebraska Medical Center, 982045 Nebraska Medical Center, Omaha, NE 68198-2045 drtorres@unmc.edu
Supported in part by NIH grants P30 NS057105 (Washington University Neuroscience Blueprint Translational Neuroscience Grant) and RR024992 (Washington University Institute of Clinical and Translational Sciences–Brain, Behavioral and Performance Unit).
Disclosure: The authors report no disclosures.
Medical Devices: Portable audiometer (Earscan3®; Micro Audiometrics, Murphy, NC); microphone (ER10-B+®; Etymotic Research, Elk Grove Village, IL); soundproof booth (120A-1®; Industrial Acoustics, Bronx, NY); sound level meter (no. 2203®; Brüel and Kjær, Nærum, Denmark).
Received November 5, 2008. Accepted in final form February 9, 2009.
REFERENCES
- 1.Boatman DF, Miglioretti DL, Eberwein C, Alidoost M, Reich SG. How accurate are bedside hearing tests? Neurology 2007;68:1311–1314. [DOI] [PubMed] [Google Scholar]
- 2.Yueh B, Shapiro N, MacLean CH, Skekelle PG. Screening and management of adult hearing loss in primary care. J Am Med Assn 2003;289:1976–1985. [DOI] [PubMed] [Google Scholar]
- 3.Bagai A, Thavendiranathan P, Detsky AS. Does this patient have hearing impairment? J Am Med Assn 2006;295:416–428. [DOI] [PubMed] [Google Scholar]
- 4.Pirozzo S, Papinczak T, Glasziou P. Whispered voice test for screening for hearing impairment in adults and children: a systematic review. BMJ 2003;327:967–972. [DOI] [PMC free article] [PubMed] [Google Scholar]
- 5.Nondahl DM, Cruickshanks KJ, Wiley TL, Tweed TS, Klein R, Klein BE. Accuracy of self-reported hearing loss. Audiology 1998;37:295–301. [DOI] [PubMed] [Google Scholar]
- 6.Davis H, Silverman SR. Hearing and Deafness, 3rd ed. New York: Holt, Rinehart and Winston; 1970:27–28, 116.
- 7.The Expert Hearing Group. Hearing Disability Assessment: Report of the Expert Hearing Group (The Green Book). Department of Health and Children. 1998. Available at: www.defence.ie. Accessed November 9, 2007.
- 8.Audacity Development Team. Audacity Software Version 1.2.6. Available at: http://audacity.sourceforge.net. Downloaded in 2006.
- 9.Jekel J, Elmore JG, Katz DL. Epidemiology, Biostatistics and Preventive Medicine. Philadelphia: WB Saunders; 1996. [Google Scholar]
- 10.Sullivan Pepe M. The Statistical Evaluation of Medical Tests for Classification and Prediction. Oxford, England: Oxford University Press; 2003. [Google Scholar]
- 11.Altman DG, Bland JM. Diagnostic tests: predictive values. BMJ 1994;309:102. [DOI] [PMC free article] [PubMed] [Google Scholar]
- 12.Deeks JJ, Altman DG. Diagnostic tests 4: likelihood ratios. BMJ 2004;329:168–169. [DOI] [PMC free article] [PubMed] [Google Scholar]
- 13.Harper R, Reeves B. Reporting of precision of estimates for diagnostic accuracy: a review. BMJ 1999;318:1322–1323. [DOI] [PMC free article] [PubMed] [Google Scholar]
- 14.Landis JR, Koch GG. The measure of observer agreement for categorical data. Biometrics 1977;3:159–174. [PubMed] [Google Scholar]
- 15.Uhlmann RF, Rees TS, Psaty BM, Duckert LG. Validity and reliability of auditory screening tests in demented and non-demented older adults. J Gen Intern Med 1989;4:90–96. [DOI] [PubMed] [Google Scholar]
- 16.National Institute on Deafness and Other Communication Disorders. Statistics about Hearing Disorders, Ear Infections and Deafness. Available at: http://www.nidcd.nih.gov/. Accessed December 20, 2007.
- 17.Smith GCS, Pell JP. Parachute use to prevent death and major trauma related to gravitational challenge: systematic review of randomised controlled trials. BMJ 2003;327:1459–1461. [DOI] [PMC free article] [PubMed] [Google Scholar]