Abstract
To examine extended control over local choice, the present study investigated preference in transition as food-rate ratio provided by two levers changed across seven components within daily sessions, and food-amount ratio changed across phases. Phase 1 arranged a food-amount ratio of 4∶1 (i.e., the left lever delivered four pellets and the right lever one pellet); Phase 2 reversed the food-amount ratio to 1∶4, and in Phase 3 the food-amount ratio was 3∶2. At a relatively extended time scale, preference was described well by a linear relation between log response ratio and log rate ratio (the generalized matching law). A small amount of carryover occurred from one rate ratio to the next but disappeared after four food deliveries. Estimates of sensitivity to food-amount ratio were around 1.0 and were independent of rate ratio. Analysis across food deliveries within rate-ratio components showed that the effect of a small amount was diminished by the presence of a large amount—that is, when a larger amount was present in the situation (three or four pellets), the value of a small amount (one or two pellets) became paltry. More local analysis of visits to the levers between food deliveries showed that postfood visits following a large amount were disproportionately longer than following a small amount. Continuing food deliveries from the same source tended to make visits less dependent on relative amount, but a discontinuation (i.e., food from the other lever) reinstated dependence on relative amount. Analysis at a still smaller time scale revealed preference pulses following food deliveries that confirmed the tendency toward dependence on absolute amount with continuing deliveries, and toward dependence on relative amount following discontinuations. A mathematical model based on a linear-operator equation accounts for many of the results. The larger and longer preference following a switch to a larger amount is consistent with the idea that local preference depends on relatively extended variables even on short time scales.
Keywords: food rate, food amount, preference pulse, matching law, choice, dynamics, rats
The traditional view of reinforcement (e.g., Skinner, 1935/1961, 1948/1961) is that whatever behavior occurs immediately prior to the delivery of a reinforcer (e.g., food) is strengthened by the reinforcer. The strengthening is manifested in a subsequent increase in the frequency of the behavior. When Herrnstein (1961) discovered that in choice situations relative response rate matched relative reinforcer rate (i.e., the matching law), an alternative view began to emerge, because the matching between choice and relative reinforcer rate seemed to undermine the traditional view—changes in behavior no longer seemed to depend solely on the moment of food delivery, but also on a comparison with other choice alternatives that were necessarily extended in time. Proponents of the traditional view responded by criticizing the study of choice. For example, both Skinner (1986) and Catania (1981) lamented the trend. Herrnstein (1961) himself couched the first presentation of matching in terms of response strength, but others moved away from the metaphor of strength. Baum and Rachlin (1969) proposed that the matching law might be extended to include various relative independent variables in addition to food-rate ratio, such as amount ratio and delay ratio. Like relative food rate, these other relative independent variables were necessarily extended in time, and choice was thus conceived as a relation between choice extended in time and relative independent variables extended in time (Baum, 1973, 1981, 2002).
When Davison and Baum (2000) began studying the dynamics of choice at less extended time scales than whole sessions, they soon found that even local measures of choice depended on relative independent variables. Indeed, the most local measurement, preference immediately following food delivery, depended not only on the just-delivered food but also on earlier deliveries from the other alternative. This control over local choice by extended variables proved to be true not only of relative food rate but also relative amount (Davison & Baum, 2003) and relative delay (Davison & Baum, 2007). Adding to the evidence indicating control by extended variables, Baum and Davison (2004) examined choice measured on three different, relatively local, time scales: (a) choice calculated from one food delivery to the next; (b) bouts of responses, or visits, between food deliveries; and (c) preference pulses immediately following food—i.e., response ratios that rise briefly to extreme levels, often exceeding 100∶1, in favor of the source (key or lever) of the food delivery. Analyses at all three time scales indicated control by food from both alternatives over choice at either alternative—corresponding to control by relative food-rate ratio on a more extended time scale. This finding and the finding that local choice is controlled by relative amount of food (Davison & Baum, 2003), are particularly telling against the traditional view of reinforcement (i.e., Skinner, 1935/1961), leading Davison and Baum (2007) to suggest that changes in behavior reflect not strengthening by immediate reinforcers, but stimulus control or guidance by those “reinforcers.”
Landon, Davison, and Ellife (2003) tried to clarify whether or not changes in food-amount ratio exert less control over preference than changes in food-rate ratio. They arranged a constant overall rate of food delivery for two alternatives and varied food-amount ratio across five levels in conditions lasting for 65 sessions each. They found local effects of food deliveries: the greatest preference pulses were observed following the largest amount of food. These results resembled those obtained when food-rate ratio changed within sessions (Davison & Baum, 2000, 2002; Landon & Davison, 2001), confirming short- and long-term effects of food deliveries on preference (Landon, Davison & Elliffe, 2002). Moreover, Landon et al. (2003) found no evidence that control of preference became more local as food amount varied, suggesting that variations in the amount and frequency of food act in similar ways to control preference.
At an extended time scale, preference in the Landon et al. (2003) study was well described by the generalized matching law (Baum, 1974),
| 1 |
where B1 and B2 are behavior allocations, measured in time or responses, to Alternatives 1 and 2, r1 and r2 may be food rates or food amounts obtained from Alternatives 1 and 2, b is a measure of bias toward one alternative or the other arising from factors other than r1 and r2, and s is sensitivity of the behavior ratio to the food ratio (Aparicio, 2007; Davison & Baum, 2003).
Landon et al. (2003) found that log response ratio was a linear function of log food-amount ratio; the estimates of sensitivity (i.e., the slope s of the fitted lines) to food-amount ratio, however, were lower than those they found to food-rate ratio for the same pigeons (Landon et al., 2002), raising the following questions: Did amount of food act within alternatives or across alternatives to affect preference across food deliveries? How were preference pulses affected by food amount? Did amount and rate of food interact? If so, can the interaction be measured within sessions? Davison and Baum (2003) addressed these questions by training pigeons on concurrent VI schedules in sessions consisting of seven components, each lasting for 10 food deliveries. In their Experiment 1, the amount ratio varied from 1∶7 to 7∶1 across components within sessions, with food-rate ratio equal to 1.0 across components and across sessions, and they set the overall food rate across conditions to three different levels: 6, 2.22, and 1.5 food deliveries per min. They found estimates of sensitivity to food-amount ratio (their Figure 1) consistently smaller (mean of 0.25) than those (mean of 0.75) reported by Landon et al. (2003). In addition, sensitivity to the amount ratio fell short of sensitivity to the rate ratio.
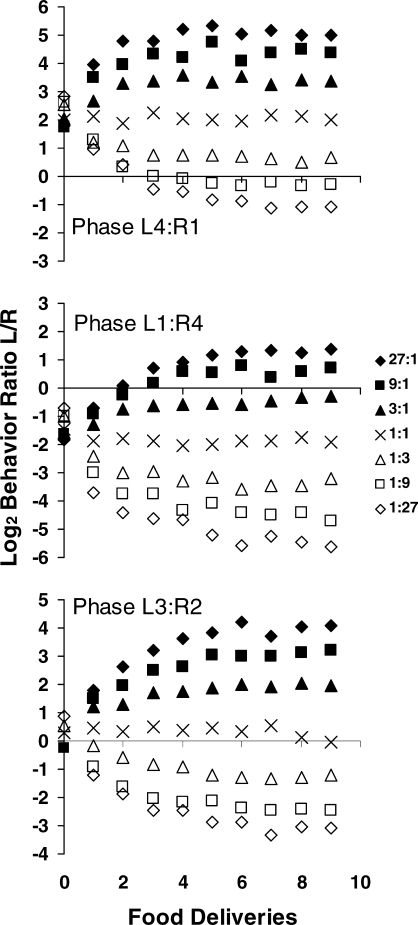
Fig 1.
Log (base 2) behavior ratios (Left/Right) in each of the seven components as a function of successive food deliveries. The data were grouped over the 8 rats. L and R indicate left and right for the amount ratios of 4∶1 (top panel), 1∶4 (middle panel), and 3∶2 (bottom panel).
To explore further the possible interaction between amount and rate of food, Davison and Baum (2003, Experiment 2) kept the food-amount ratio constant across components and across sessions and varied food-rate ratio across components within sessions (Davison & Baum, 2000). The estimates of sensitivity to amount ratio (about 1.0) were considerably higher than those they found in Experiment 1 (mean of 0.25 after nine food deliveries), suggesting that varying food-amount ratio across components within sessions caused lower asymptotic sensitivity. This might mean that sensitivity to amount differentials is enhanced by concomitant food-rate variation. Indeed, in their Experiment 2, the point estimate (i.e., disregarding bias in Equation 1) of amount-ratio sensitivity itself increased as amount ratio became more extreme. In contrast, Landon et al. (2003) found a single sensitivity to amount ratio across conditions. Although Davison and Baum (2003) estimated sensitivity to amount ratio across components within sessions, they did not analyze sensitivity to amount ratio across conditions, leaving doubt as to the interpretation of their point estimates. Landon et al. (2003) found an average sensitivity to amount ratio similar (i.e., 0.7) to that estimated by Davison and Baum (2003, Experiment 2) for log amount ratios close to 0, but Davison and Baum found that for larger amount ratios the point estimate of sensitivity rose to about 1.0 after the ninth food delivery. This difference in sensitivities to food-amount ratio between Landon et al. (2003) and Davison and Baum (2003; Experiment 2) may be caused by the way in which they manipulated the food-rate ratio; whereas Landon et al. kept the rate ratio constant at 1.0 across all conditions, Davison and Baum (Experiment 2) varied it across components within sessions. Was the higher sensitivity found by Davison and Baum (2003) dependent on variation in food-rate ratio, and would the sensitivities obtained by Landon et al. (2003) have been different had they used unequal food rates across alternatives? The present study addressed these questions by testing further local control by relative amount. Besides extending the study to rats instead of pigeons, we also undertook additional analyses at all three time scales suggested by Baum and Davison (2004). To assess the interaction between food-rate ratio and food-amount ratio in governing preference, we kept overall food rate invariant and manipulated food-amount ratio across phases in which food-rate ratio varied across seven components within each session according to concurrent variable-interval (VI) schedules (Davison & Baum, 2000).
METHOD
Subjects
Eight experimentally naive male Wistar rats (Harlan Sprague; Dawley, IN), numbered R130 to R137, were maintained at 85% of their free-feeding body weights. The rats were run sequentially in two groups of 4 rats each, and each group was fed weight-maintaining amounts of Purina chow immediately after the end of the daily session. The rats were approximately 100 days old when the experiment began and were housed individually with free access to water in a temperature-controlled colony room on a 12hr∶12hr light∶dark cycle, light beginning at 0800 hr.
Apparatus
Four modular chambers (Coulbourn E10-18TC) for rats measuring 310 mm long, 260 mm wide, and 320 mm high (inside) were enclosed in sound-attenuating boxes that from outside measured 780 mm wide, 540 mm long, and 520 mm high. A square metal grid constituted the floor of each chamber. A food cup (E14-01), 30 mm wide and 40 mm long, was centered between the left and right walls 20 mm from the floor. Two retractable levers (E23-17), 30 mm wide and 15 mm long, requiring a force of 0.2 N to operate, were mounted on the front wall of each chamber; the centers of the levers were 85 mm to the left or right from the center of the food cup and 100 mm above the floor. Two white 24-V DC light bulbs (E11-03), installed 20 mm above the levers, provided the illumination of the chamber. A food dispenser (E14-24) located behind the front wall delivered 45-mg food pellets (Formula A/1 Research Diets) into the food cup. A speaker (E12-01) 26 mm wide by 40 mm high, which was mounted on the front wall of each chamber 20 mm from the ceiling and connected to a white noise generator (E12-08), provided a constant white noise 20 kHz (+/− 3 dB). A third nonretractable lever (E21- 03), requiring a force of 0.2 N to operate, was centered on the back wall of each chamber 100 mm above the floor. All experimental events were arranged on a HP® PC-compatible computer running Coulbourn-PC® software, located in a room remote from the experimental cages. The computer recorded the time (10-ms resolution) at which every event occurred in experimental sessions.
Procedure
The training to establish lever pressing (i.e., a technique similar to that of Brown and Jenkins, 1968) and the general procedure have been described in detail elsewhere (Aparicio & Baum, 2006). The experimental program arranged seven different food-rate ratios or components (27∶1, 9∶1, 3∶1, 1∶1, 1∶3, 1∶9, and 1∶27) for the session. The sessions were conducted at the same time each day, and lasted until seven components were completed or until 90 min elapsed, whichever occurred first. Each component began with the left and right retractable levers extended into the chamber and the lights above them turned on, which signaled the availability of food pellets for pressing the retractable levers. The first response on either the left or right lever caused the opposite lever to retract. Pressing on the available lever produced food pellets according to the schedule assigned to that lever. At any time, however, the rat could leave this lever and switch to the retracted lever by making one press on the changeover lever (located on the back wall). This changeover response caused the available lever to retract, and the retracted lever to extend into the chamber. This fixed-ratio-1 changeover requirement (FR1 CO) was implemented to separate the food deliveries arranged for each lever (Pliskoff, Cicerone, & Nelson, 1978; Stubbs, Pliskoff, & Reid, 1977) and to simulate travel when switching from one lever to the other lever (Aparicio & Baum, 1997, 2006; Baum & Aparicio, 1999). Each food-rate ratio lasted until 10 food deliveries had been obtained, and food-rate ratios were separated from one another by a 60-s blackout during which the lights were extinguished and the levers retracted from the chamber.
Rate of food delivery
For each retractable lever, the computer used a probability (p) to determine whether or not to set up a food delivery. Seven pairs of probabilities (.27∶.01, .25∶.03, .21∶.07, .14∶.14, .07∶.21, .03∶.25, and .01∶.27) defined the seven unsignaled food-rate ratios. These probabilities were applied every 9 s and programmed an average rate of food delivery for lever presses of about two per min or one delivery about every 31.1 s. For each of the 118 sessions in each phase, the seven food-rate ratios were randomly selected without replacement, and were arranged dependently; that is, food deliveries were probabilistically assigned to one of the two retractable levers, and no further food deliveries were scheduled until that one had been made. Whenever a component arranged a food delivery for a lever that was retracted, obtaining the food required the rat to make a changeover response so as to extend this lever into the chamber. One press on this lever produced the arranged food delivery; further responses on it produced more food deliveries according to the probability assigned to the lever.
Amount of food delivery
Three food-amount ratios (4∶1, 1∶4, and 3∶2), each lasting for 118 sessions, were arranged independently of the seven food-rate ratios. In Phase 1 the food-amount ratio was 4∶1; the left lever delivered four pellets (one after the other, requiring 10 ms each) and the right lever one pellet. Phase 2 reversed the food-amount ratio (i.e., 1∶4); the left lever delivered one pellet and the right lever four pellets. In Phase 3 the food-amount ratio was 3∶2; the left lever delivered three pellets and the right lever two pellets.
Data Analysis
Stability of performance was assessed separately for each block of 118 sessions. With the daily records of total number of presses on the left and right levers across components, the ratios of responses (left / right) were computed and transformed into base-2 logarithms. Also, the number of responses during visits to the left and right levers (presses per visit) was calculated across components. For each rat, the logs of response ratios, presses per visit on the left lever, and presses per visit on the right lever were plotted across the 118 sessions. These plots were used to judge stability by visual inspection. Performance was judged stable when no systematic trend (up or down) in any of these measures was detected for several consecutive days. This stability criterion allowed selecting the final 70 or more (range from 70 to 76) consecutive sessions to represent stable performance for data analysis.
The data from all selected sessions were then pooled across sessions by food delivery within the sequence of 10 obtained food deliveries. Thus, all presses on the left and right levers prior to each of the 10 food deliveries in components might be totaled, allowing calculation of response ratios that might be sorted by component or by prior left–right sequence of food deliveries, beginning with the first food delivery in a component. In addition, the length of each visit to a lever was computed as the series of presses following either a food delivery or a changeover (i.e., presses per visit). These were sorted by prior left–right sequence of food deliveries. Preference pulses were derived by calculating response ratios press by press following different left–right sequences of food deliveries. All logarithms were calculated to the base 2, meaning that a unit change corresponded to a doubling or halving. For group analyses, the raw data were pooled across rats and calculations were done on the pooled data as if from a single rat.
RESULTS
Time Scale #1: Across Food Deliveries within Components
To compare the present results with those from our previous study, in which the food-amount ratio was 1∶1 across the seven food-rate ratios (Aparicio & Baum, 2006), the first analysis investigated how behavior ratios changed as a function of successive food deliveries within each of the seven food-rate ratios or components. For each food-amount ratio across all presentations of the component (at least 70 presentations), responses were pooled from the beginning of the component to the first food delivery, from the first to the second food delivery, from the second to the third, and so on.
The base-2 logarithm of behavior ratio appears in Figure 1 as a function of the successive food deliveries in each food-rate ratio. From top to bottom the graphs show the results obtained with the food-amount ratios of 4∶1, 1∶4, and 3∶2. As would be expected, preference separated across components, and more responses occurred on the high-probability-of-food lever than on the low-probability-of-food lever. Note that the y-axes all cover 9 log units (base 2), so the effects are comparable across graphs. If the food-amount ratio acted simply as an additive bias (Baum, 1974), it would just move all preferences up or down to the same extent. That appears to be approximately true, although the preferences for the larger amounts (three or four pellets) were slightly stronger relative to the 1∶1 food-rate ratio than preferences for the smaller amount (one or two pellets). The asymmetry in the graphs is visibly small, however, and probably negligible. For example, comparing the log behavior ratios for food deliveries 7–9 in the 27∶1 and 1∶27 components with those in the 1∶1 component, the differences in separation from the 1∶1 food-rate ratio were 0.2–0.4 log units, corresponding to a ratio of 1.1–1.3.
Estimates of sensitivity to current food-rate ratio and carryover from the previous component were calculated by using the following equation:
| 2 |
where BC represents the current log behavior ratio, BP represents the previous log behavior ratio, rC represents the current log food-rate ratio, sP represents sensitivity to the previous log behavior ratio (i.e., carryover), sC represents sensitivity to the current food-rate ratio, and log b represents bias, due mainly to the food-amount ratio, but possibly including some position bias.
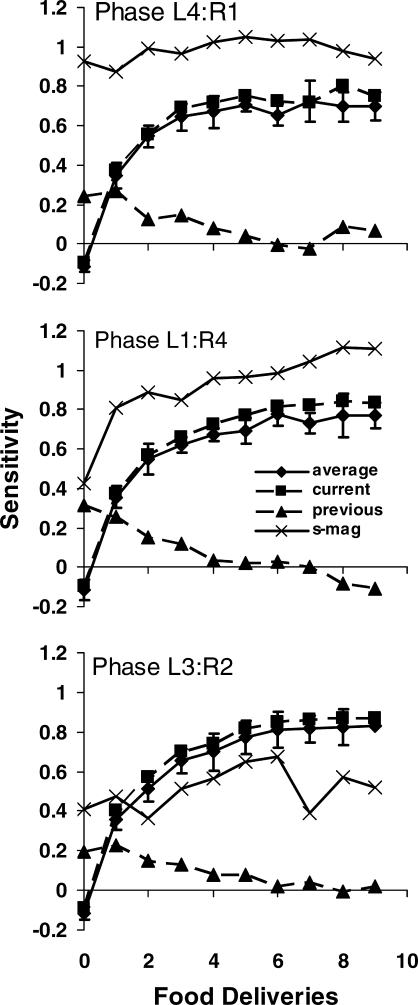
The diamonds in Figure 2 show the mean across 8 rats, calculating sensitivity based on the obtained food-rate ratios for each rat (Equation 1). Sensitivity to the food-rate ratio increased progressively from close to zero (often negative) prior to the first food delivery, to a value of about 0.8. The squares and triangles show the results of multiple regression, applying Equation 2 to the raw data pooled across rats, with obtained food-rate ratio in the current component and final log behavior ratio in the previous component (following the ninth food delivery) as the predictor variables. The error bars for mean sensitivity (diamonds) encompassed sensitivity for the current food-rate ratio from the multiple regression analysis (squares), confirming the reliability of the pooling method. A small amount of carryover occurred (triangles), but disappeared after four food deliveries. Sensitivities were similar across the three food-amount ratios, indicating that sensitivity to food-rate ratio was independent of food-amount ratio, in keeping with some previous research (e.g., McLean & Blampied, 2001).
Fig 2.
Sensitivity to food ratio (s in Equation 1) as a function of food deliveries in a component. The diamonds represent mean sensitivity to obtained food ratio across the 8 rats, and the error bars show one standard deviation above and below the means. The squares and triangles show the slopes from multiple regression using current log food-rate ratio and prior final log behavior ratio (following the ninth food delivery) as the predictor variables. The Xs show point estimates of sensitivity to amount ratio. Points plotted at zero on the x-axis indicate performance before any food was delivered.
The Xs in Figure 2 show point estimates of sensitivity to food-amount ratio derived from the intercepts in the multiple regressions (log b in Equation 2 divided by log food-amount ratio; ignoring any position bias). The estimates are around 1.0 for the food-amount ratios of 4∶1 and 1∶4, although they are lower for the first few food deliveries for 1∶4. If log b included no position bias, amount-ratio sensitivity ought to remain constant, because the amount difference was constant throughout the condition. The increase would be compatible with a position bias favoring the left lever that decreased across food deliveries. The estimates for the food-amount ratio 3∶2 are lower (around 0.5) than the other two food-amount ratios, consistent with a position bias for the left lever. If we assume a position bias toward the left of 0.3 (log base 2), then sensitivity for the food-amount ratio 3∶2 comes out to about 1.0. These bias estimates may be compared with the Xs in Figure 1, showing log response ratio in the 1∶1 component, which offer an estimate based on more data; the Xs were close to 2 and -2 for the 4∶1 and 1∶4 food-amount ratios, and about 0.34 (versus 0.59) for the 3∶2 food-amount ratio (0.21 for the last three points), consistent with the guess of a position bias of about 0.3 to explain the shortfall in amount-ratio sensitivity.
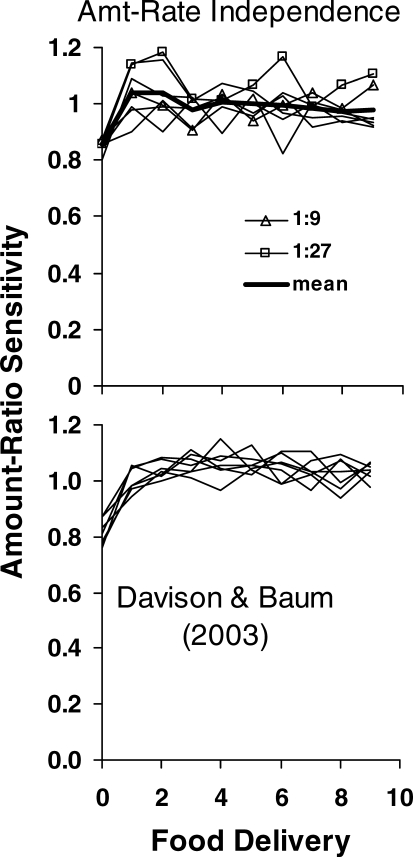
We examined the possibility that the effects of the food-amount ratio on choice were independent of the food-rate ratio's effects—that is, whether the two effects were simply additive as suggested by some previous research (Baum & Rachlin, 1969; McLean & Blampied, 2001). For each food-rate ratio and each food-amount ratio, we calculated the behavior ratio prior to each food delivery, and, for each food-rate ratio, fitted Equation 1 to the three behavior ratios corresponding to the three food-amount ratios (4∶1, 1∶4, and 3∶2), taking r1/r2 as the food-amount ratio. The top graph in Figure 3 shows the slope of each 3-point line, the amount-ratio sensitivity, as a function of successive food deliveries in each food-rate ratio. The seven light lines show amount sensitivity for the seven food-rate ratios. The heavy line shows the mean across food-rate ratios. For every slope, r2 exceeded .92, and most exceeded .98. From the first food delivery onwards, all amount sensitivities approximated 1.0. No effect of food-rate ratio appears, except for small deviations upward for 1∶27 (squares) and 1∶9 (triangles). These were small, however, and reflected no similar deviation for 27∶1 or 9∶1 beyond three food deliveries. The invariance indicates that amount-ratio sensitivity was independent of food-rate ratio.
Fig 3.
Top: Sensitivity to food-amount ratio as a function of successive food deliveries. For each rate-ratio component and each food delivery within a component, Equation 1 was fitted to the three behavior ratios for the three amount ratios, across phases. The amount sensitivity was the slope of the fitted line. Each lighter line shows amount sensitivity for one rate ratio. Squares and triangles indicate the 1∶9 and 1∶27 rate ratios, and the heavy line shows the mean across components. Bottom: a similar analysis, done at our behest by Michael Davison, of the results from a similar experiment with pigeons. Each point represents the slope of Equation 1 fitted to seven behavior ratios for seven amount ratios. Each line represents amount sensitivity across food deliveries for one rate-ratio, within-session component.
We prevailed upon M. Davison (personal communication, May 27, 2007) to do a similar analysis on the data from Experiment 2 of the Davison-Baum (2003) study of food-rate and food-amount in pigeons. Equation 1 was fitted to the seven behavior ratios corresponding to the seven food-amount ratios across conditions, for each (within-session) food-rate ratio and each food delivery within components. The results appear in the bottom graph of Figure 3. Each line represents the results for one rate ratio. After the first food delivery, they all approximate a sensitivity of 1.0 (mean for deliveries 7, 8, and 9 is 1.03). The similarity and overlap of the lines indicates again that sensitivity to amount ratio was independent of rate ratio. Because Davison and Baum (2003) also found rate-ratio sensitivity to be independent of amount ratio (their Figure 7), we conclude that rate and amount had independent effects on choice, as in the present experiment.
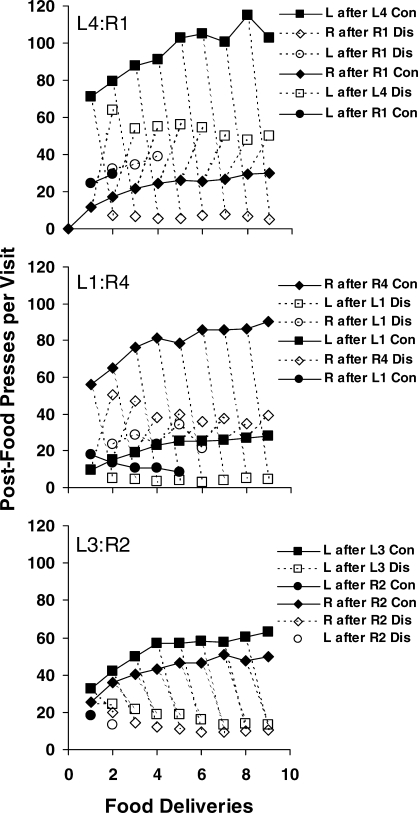
Fig 7.
For the three amount ratios: length (presses per visit) of the first visit following a series of continuing food deliveries or following a series of continuing food deliveries ending with a discontinuation as a function of number of food deliveries. Group data are shown for visits following each of the nine food deliveries. Filled symbols represent visits following continuations, and unfilled symbols visits following a discontinuation. L stands for the left lever, R for the right lever, Con for continuation, and Dis for discontinuation.
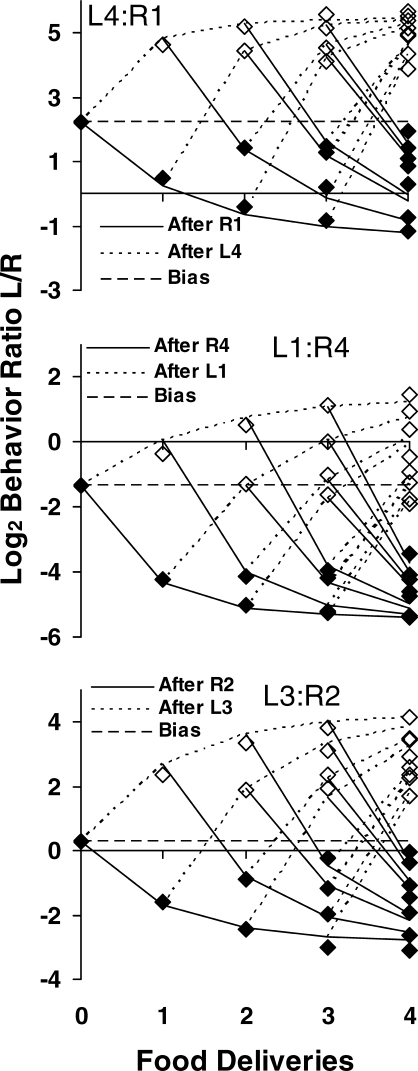
Figure 4 shows response ratios (preference) preceding the first food delivery and following the first four food deliveries in a component, calculated from the responses between food deliveries. All sequences were selected regardless of component, and the data pooled across rats. The data point at zero and the broken horizontal line in each graph represent the behavior ratio up to the first food delivery, other filled symbols indicate choice following a food delivery on the right lever, and unfilled symbols indicate choice following a food delivery on the left lever. Solid and dotted lines show the results of fitting the following mathematical model1.
| 3 |
where Pi and Pi+1 are preference [log (B1/B2)] for the left lever following the previous (ith) food delivery and following the present (i+1st) food delivery, A is amount of food in pellets (positive for the left lever and negative for the right lever), g is a constant of proportionality translating amount to effect on preference, and w is the weight given to the effect of the present food delivery, gA, relative to present preference. We will explain the model further below.
Fig 4.
Log (base 2) interfood behavior ratio (Left/Right) as a function of source sequence of food for the first four food deliveries within components. The broken horizontal line in each graph represents bias due to the amount difference, and the lines show the results of fitting Equation 3. The open symbols indicate choice following a food delivery from the left lever, and filled symbols choice following a food delivery from the right lever.
For the 4∶1 food-amount ratio, the log behavior ratio before the first food delivery was 2.25, indicating bias for the left lever at the beginning of the component close to the 2.0 (log 4) one might expect. This estimate of bias was weaker than expected for the 1∶4 amount ratio (-1.33 versus -2) and for the 3∶2 amount ratio (0.29 versus 0.59). These bias estimates are consistent with those seen in Figure 1.
As found in previous studies (e.g., Aparicio & Baum, 2006; Davison & Baum, 2000), a shift of preference occurred after each successive food delivery toward the lever from which it came. When all food deliveries arrived from the left (LLLL) or right (RRRR) lever, preference shifted progressively in the direction of that lever. Whenever a shift in delivery source occurred (from the left to the right or vice versa), a shift in preference followed. Nevertheless, preference shifts following the large amount (three or four pellets) were always larger than those following the small amount (one or two pellets), producing asymmetry around the (broken) initial-bias line. This asymmetry is most evident after four food deliveries, where the points for the larger amount (unfilled symbols for the top and bottom graphs; filled symbols for the middle graph) cluster more tightly away from the bias line than the points for the smaller amount. So, although the amount difference had the extended effect of shifting preference overall, it also had more local effects that need to be accommodated in any theoretical account.
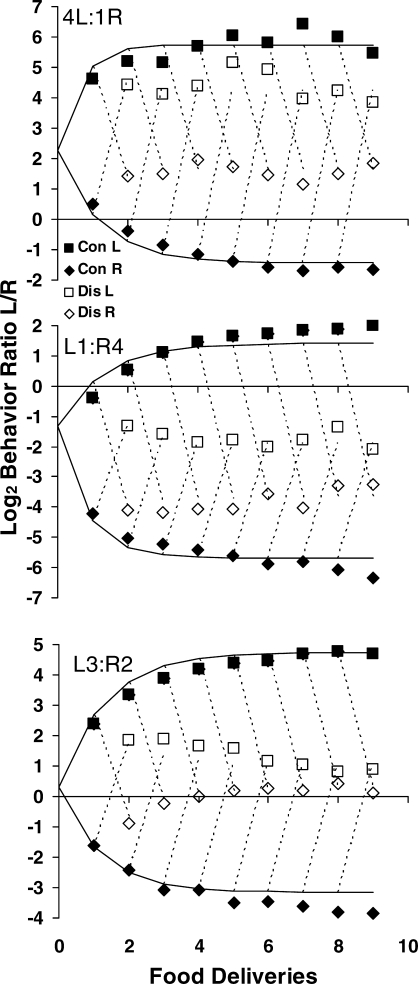
Figure 5 extends the data analyses of Figure 4. The lines are the results of fitting Equation 3 to longer sequences up to nine food deliveries. Calculations began from the beginning of components for all sequences. The filled symbols show the log behavior ratio following continuing food deliveries on the left (squares) and right (diamonds) levers—which, for the sake of brevity, we call “continuations” (Aparicio & Baum, 2006). A continuation is a food delivery from the same lever as the previous food delivery. The unfilled symbols show preference following a switch of food delivery from the right to the left lever (squares) or from the left to the right lever (diamonds), what we call a “discontinuation.” A discontinuation is a food delivery from the lever opposite to the previous food delivery. With increasing continuations on the same left or right lever, preference shifted progressively in the direction of that lever, although each continuing delivery tended to have less of an effect than the one before, suggesting approach toward an asymptote. A discontinuation shifted the behavior ratio toward the lever from which it came. The shift in preference was larger for a larger-amount discontinuation, in accord with the asymmetry visible in the preferences following continuations and the asymmetry in Figure 4. Although not shown in Figure 5, after a discontinuation, preference returned close to its prior level after several continuing food deliveries from the original lever. This trend may be seen in Figure 4; e.g., for LLLL versus RLLL. Any theoretical account of choice—local or extended—needs to take account of the large effects of switches in food source (i.e., discontinuations). One possible interpretation is that the occurrence of two different amounts in sequence produces a contrast effect. Such a view would stem from the proposal that food deliveries function as discriminative stimuli, signaling the occurrence of subsequent food (Davison & Baum, 2007).
Fig 5.
Log (base 2) interfood behavior ratio (Left/Right) within components across nine food deliveries from the same lever (continuations; filled symbols) and following a food delivery from the other lever (a discontinuation; unfilled symbols). The lines are the results of fitting Equation 3.
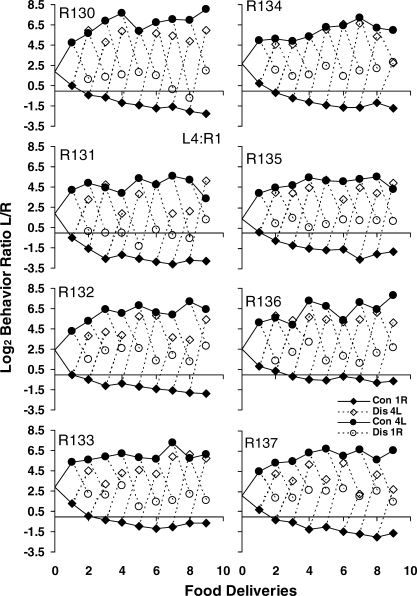
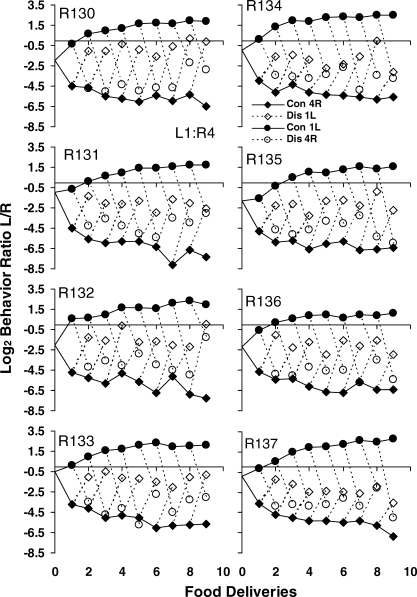
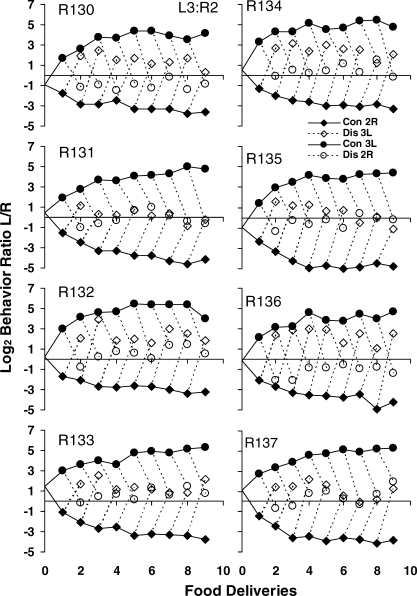
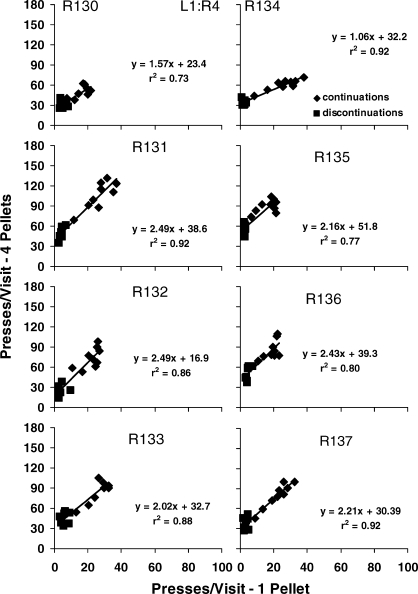
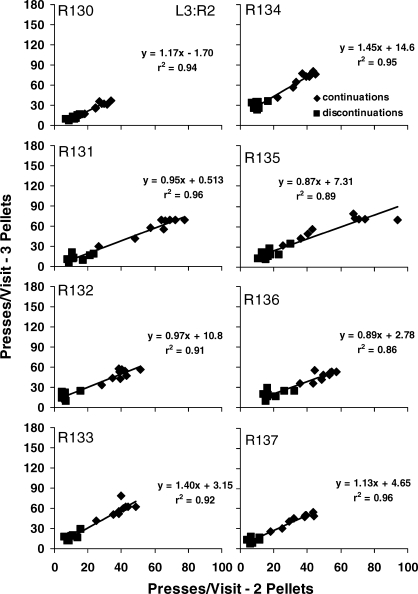
Figures A1–A3 in the appendix show results for individual rats similar to those in Figure 5, for the three phases. The results for the pooled data were representative of the individual rats.
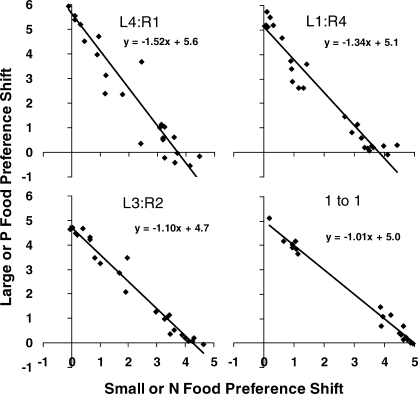
For the data shown in Figures 4 and 5, the next analysis examined the observation that the larger amount shifted preference more than the smaller amount. Figure 6 shows the effect of a large food delivery—that is, the change in preference following the delivery—plotted against the comparable change following a small food delivery. Each point compares the two shifts following a particular sequence of left and right food deliveries. For example, following the sequence 4-1-1 pellets, the shift following a large amount, 4-1-1 to 4-1-1-4 pellets, was plotted against the shift following a small amount, 4-1-1 to 4-1-1-1 pellets. The regression lines for the amount ratios of 4∶1, 1∶4, and 3∶2 (r2 values of .90, .94, and .97) support two conclusions: (a) the intercept on the y-axis was always about 5.0, but (b) the steeper slopes (−1.52 and −1.34) for the larger differences (4∶1 and 1∶4) resulted in an intercept on the x-axis below 4, compared with a higher intercept (close to 5.0) for the smaller difference (3∶2). These intercepts reflect the maximal effects of discontinuations, seen in the right-most points of Figure 5. Apparently the maximal effect of a large amount was always about the same (5.0 on the y-axis), but the maximal effect of a smaller amount was diminished (from 5.0 to 4.0 or less) to an extent directly related to the larger amount (four versus three pellets). We checked this speculation by doing a comparable analysis of our earlier data (Aparicio & Baum, 2006) with one pellet delivered at both alternatives. The lower right graph of Figure 6 shows this analysis, where the alternative (left or right) that first delivered food in a component (labeled P) was treated as “large” and the other component (labeled N) was treated as “small” (see Figures 3 and 4 in Aparicio & Baum, 2006). The slope of the regression line (-1.0) indicates that delivering equal amounts produced equal effects; the intercepts on the y- and x-axes are almost exactly equal to 5.0, showing that when no larger food amounts occur, the one-pellet deliveries have the same maximal effect as the three- and four-pellet deliveries. Overall, Figure 6 indicates that the presence of a larger amount depresses the effect of the smaller amount (the intercepts on the x-axis); that is, when a larger amount is present in the situation (three or four pellets), the value of a small amount (one or two pellets) becomes paltry. This observation indicates that local preference is in large part controlled by relative amount. The local contrasts of amount that occur when one alternative produces a large amount and the other follows with a small amount, or vice versa, apparently produced the asymmetry seen in Figures 4 and 5.
Fig 6.
For the three amount ratios and an earlier experiment (Aparicio & Baum, 2006), the amount by which preference shifted following the larger food delivery versus the shift following the smaller food delivery. Each point represents a comparison following a particular sequence of large and small food deliveries (for example, 4-1-1-4 versus 4-1-1-1). For the earlier experiment, in which the amount ratio was 1:1, P signifies the lever (left or right) that delivered the first pellet in the component, and N represents the other, not-first lever. Lines and equations represent the results of least-squares regression.
Time Scale #2: Visits between Food Deliveries
We conducted a more local analysis to study bouts of activity or “visits.” A visit was defined as a series of consecutive responses beginning with either a food delivery or a changeover and ending with a changeover. Figure 7 shows the first visit to a lever following a food delivery (i.e., a “postfood visit”), which was almost always to the just-productive lever, following continuations and following discontinuations for up to nine continuations. The filled squares and diamonds show that postfood visit lengthened with increasing prior continuations, but according to the amount delivered. It lengthened most for four pellets (from about 60 up to about 100 presses; “L after L4 Con” and “R after R4 Con”), less for three (from about 30 up to about 60 presses; “L after L3 Con”), less for two (from about 25 up to about 50 presses; “R after R2 Con”), and least for one pellet (from about 10 up to about 30 presses; “L after L1 Con” and “R after R1 Con”). Thus, visits following continuations could be ordered according to the absolute amount of food delivered. The numbers above indicate that the ratio of postfood visits (large to small amount) tended to decrease with number of continuing deliveries for the 4∶1 and 1∶4 amount ratios and remained about the same for the 3∶2 amount ratio.
The results differed for visits following a discontinuation. The unfilled squares in the top (“L after L4 Dis”) and bottom graphs (“L after L3 Dis”), and unfilled diamonds in the middle graph (“R after R4 Dis”) show that the effect of a larger-amount discontinuation depended on the amount ratio. When the amount ratio was 4∶1 or 1∶4, a four-pellet discontinuation lengthened the postfood visit relative to a prior one-pellet delivery (compare unfilled squares with filled diamonds in the top graph of Figure 7 and unfilled diamonds with filled squares in the middle graph), but when the amounts were more equal at 3∶2, visits following discontinuations were always shorter than those following continuations (compare unfilled squares with filled diamonds in the bottom graph of Figure 7), regardless of whether the discontinuation was three pellets or two pellets. This difference in postfood visits between the 3∶2 and the 4∶1 and 1∶4 amount ratios suggests control by relative amount rather than absolute amount. Moreover, the visits following discontinuations tended to shorten with increasing number of preceding continuations, suggesting that the prior continuing deliveries tended to drive those visits downward, a further indication of control by relative amount. The smallest discontinuations (one pellet following four pellets) were followed by the shortest visits (10 or fewer postfood presses per visit), a result compatible with control by either relative or absolute amount.
The rare postfood visits in which pressing switched to the lever that did not produce food (filled and unfilled circles) were short or intermediate in length. They usually occurred as a switch to the lever producing four pellets following a one-pellet delivery, indicating control by relative amount. The rarity of these visits precludes any further description.
To specify the relation between visit duration and presses per visit, we computed the response rates within visits by dividing the number of presses by the time from the first to the last press (i.e., omitting changeover time). Examining the response rates within postfood visits and postchangeover visits separately, we found no trends across food amount. We averaged across food amounts and found the response rate within postfood visits equaled 1.0 press/s (standard deviation 0.26) and the response rate within postchangeover visits equaled 1.18 press/s (standard deviation 0.22). Thus, presses per visit was roughly also the measure of visit duration in seconds.
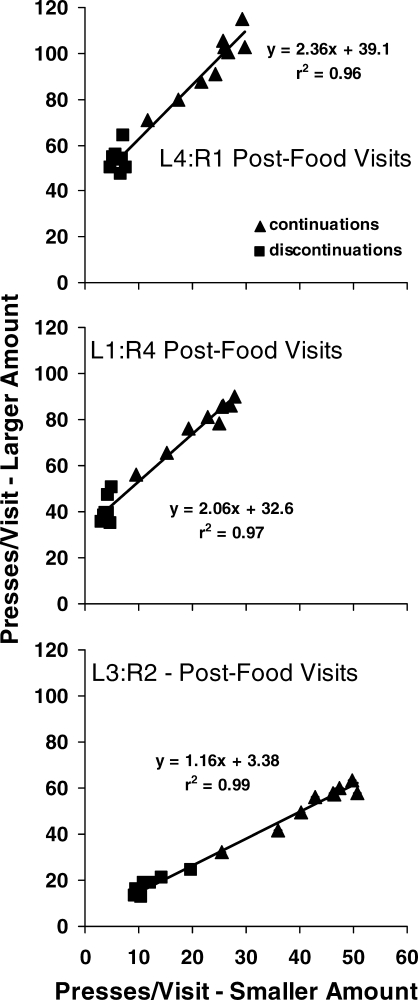
Figure 8 further examines the differences in postfood visits following different sequences of larger and smaller amounts, using the data shown in Figure 7. Visit length following the larger amount is plotted against visit length following the smaller amount. Each point compares sequences of food deliveries that are mirror images—for the food-amount ratio of 4∶1, for example, 4-4-4-4 versus 1-1-1-1 or 1-1-1-4 versus 4-4-4-1 pellets. For the amount ratios of 4∶1, 1∶4, and 3∶2 the regression lines (r2 = .96, .97, and .99) illustrate two effects: (a) the slopes (2.36, 2.06, and 1.16) show that the difference in visit length grew faster depending on the amount ratio; and (b) the intercepts (39.1, 32.6, and 3.38) show that a constant was added to the length of the visit following the larger amount that depended on the amount ratio; more than 30 presses were added by the 4∶1 amount ratio, whereas only about 3 presses were added by the 3∶2 amount ratio. Were the amounts equal, we would expect a slope of 1.0 and an intercept of zero. The difference in intercepts suggests a constant preference for the larger over the smaller amount due to their fixed sources (left and right); it is disproportionate, however, because the difference in intercept was about 10-fold (30 presses versus 3 presses), compared with a factor of 2.67 (4/1.5) difference in amount ratio. Since increasing visit length resulted from increasing continuations (triangles), the difference in slopes suggests growing preference, the speed of which depended on amount ratio. These effects help explain the asymmetry in the preferences seen in Figures 4 and 5, because the disproportionately long postfood visits to the large-amount alternative made up a larger proportion of the response totals that went into calculating interfood preference than did the postfood visits to the small-amount alternative. Thus, Figure 8 indicates extended control over local preference also at this smaller time scale.
Fig 8.
For the three amount ratios: visit length (presses per visit) following the larger amount as a function of the comparable visit length following the smaller amount, replotted from Figure 7. The sequences of food deliveries are mirror images—for example, 4-4-4-4 versus 1-1-1-1 or 1-1-1-4 versus 4-4-4-1. Triangles indicate continuations and squares discontinuations.
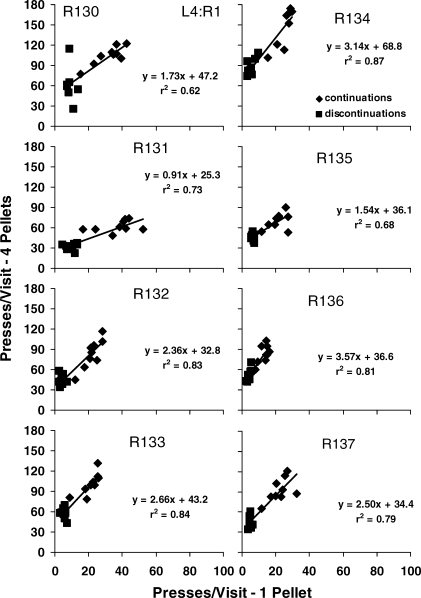
Figures A4–A6 in the Appendix verify that these results were representative of the individual rats' results, with a few exceptions (slopes for Rat 131 in the L4∶R1 phase and Rat 134 in the L1∶R4 phase).
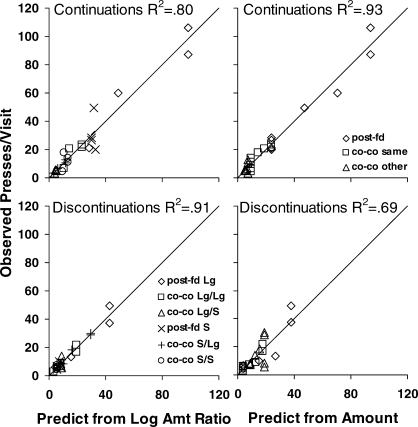
Figure 9 shows the results of a further analysis to determine whether visits depended on relative or absolute amount. This analysis focused on visits following food deliveries 7, 8, and 9, when visit length was relatively stable. We averaged across the three deliveries and included both postfood (“post-fd”) visits, as in Figures 7 and 8, and also postchangeover (“co-co”) visits, those beginning with a changeover (i.e., visits following the postfood visit and neither beginning nor ending with food). We included the data from our earlier experiment (Figure 6 in Aparicio & Baum, 2006) to represent the amount ratio 1∶1 and supply additional data about one-pellet deliveries. For absolute amount, visits fell into three categories for each amount: (a) postfood visits to the just-productive lever; (b) postchangeover visits to the just-productive lever; and (c) postchangeover visits to the not-just-productive lever. For relative amount (log amount ratio), the same categories applied, but distinguished according to whether the visit followed the larger amount (lever P for 1∶1) or the smaller amount (lever N for 1∶1), making six categories. We analyzed two data sets: one for visits following continuations and one for visits following discontinuations. Each data set included 24 mean visits, 8 in each category for absolute amount (2 for four pellets, 1 for three pellets, 1 for two pellets, and 4 for one pellet), and 4 in each category for relative amount (2 for 4∶1, 1 for 3∶2, and 1 for 1∶1). We analyzed these by calculating a least-squares regression line in each category, fitting either eight visit lengths to absolute amount (three lines) or four visit lengths to log amount ratio (six lines). To evaluate whether absolute or relative amount better explained the visits, we calculated overall R2 for each of the four analyses (continuations versus discontinuations and relative versus absolute amount) by pooling the sums of squares across regression lines.
Fig 9.
Postfood (post-fd) and postchangeover (co-co) presses per visit following continuations (top row) and discontinuations (bottom row) plotted against predicted presses per visit. Predictions were derived by regressing visit length against either the log amount ratio (left-hand graphs) or the absolute amount of food (right-hand graphs). In the legend, Lg means larger, S means smaller, Lg/S means a visit to the smaller-amount lever following a larger food delivery, and S/Lg means a visit to the larger-amount lever following a smaller food delivery. Absolute amount predicts visits better (R2) following continuations, whereas relative amount predicts better following a discontinuation. See text for more explanation.
Each graph in Figure 9 shows observed visit length plotted against predicted visit length from the regression analysis. The top row shows the analysis for continuations, predicting visit length from relative amount (log amount ratio; left graph) or absolute amount (right graph). Both visual inspection and the two estimates of R2 (.80 versus .93) indicate that the visits following 7 - 9 continuing deliveries were better predicted by absolute amount. The bottom row shows the comparable analysis for visits following discontinuations. Visual inspection and the estimates of R2 (.91 versus .69) indicate that visits following a discontinuation (after six, seven, or eight prior continuations) were better predicted by relative amount. Thus, the result for discontinuations was opposite to that for continuations. Whereas control by relative amount apparently was diminished by several continuations, it was revived by a switch from one amount to the other. This suggests that local choice, as measured by visits to the alternatives, cannot be explained by strictly immediate events, as the molecular view proposes, but rather depends on extended variables encompassing at least the contrast of amounts.
Time Scale #3: Preference Pulses Following Food Deliveries
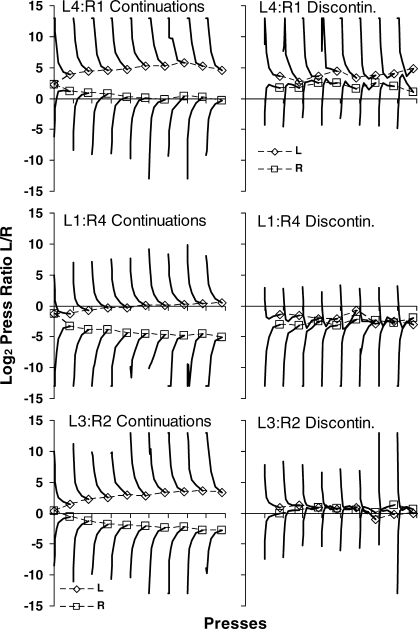
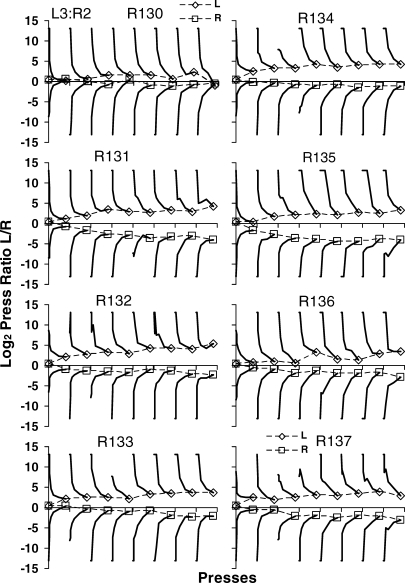
Previous research reported preference pulses following food deliveries—response ratios that rose briefly to extreme levels (often exceeding 100∶1) in favor of the source of the food delivery (e.g., Aparicio & Baum, 2006; Baum & Davison, 2004; Davison & Baum, 2002). Figure 10 shows preference following food deliveries press by press. Each curve was constructed by adding up all first presses on the left and right levers following a food delivery and calculating the log (base 2) press ratio (left/right). Then presses 2 and 3 were added up and the log ratio calculated, then presses 4 - 7, then presses 8 - 15, then presses 16 - 31, then presses 32 - 63, and finally presses 64 - 100. Exclusive preference is represented as either +13 or −13 (for the left or the right lever). The left-hand graphs show preference pulses following one to nine continuing deliveries, and the right-hand graphs show preference pulses following a discontinuation after one to eight prior continuations. The final points of the preference curves are given symbols and connected. They roughly estimate the asymptotic levels to which the pulses fall. Changes in these asymptotes suggest cumulative effects of food deliveries within components. The points with symbols on the vertical axis show preference before any food deliveries, an effect of amount ratio across components. Continuations increased preference for the lever from which they came. In the 4∶1 and 1∶4 amount ratios, the increasing preference following continuing one-pellet deliveries almost exactly canceled the initial preference (squares and diamonds in the top and middle left-hand graphs), producing indifference. Continuing deliveries of two pellets reversed preference and those of three or four pellets increased preference beyond its initial level. As with visits following continuations, these asymptotes were ordered according to absolute food amount. Following discontinuations, the asymptotic preferences were close to the initial preferences, confirming control by relative amount as a result of the contrast between two successive amounts.
Fig 10.
For the three amount ratios: preference pulses between food deliveries; log (Left/Right) response ratio versus presses across nine food deliveries. Curves were constructed by calculating preference for press 1, presses 2 and 3, presses 4-7, presses 8-15, presses 16-31, presses 32-63, and presses 64-100. The final points of the preference curves are given symbols (squares for the left and diamonds for the right lever) and connected. The left-hand graphs show preference pulses following one to nine continuations, and the right-hand graphs show those following discontinuations after one to eight prior continuations. See text for more details.
Close examination of Figure 10 suggests that pulses following continuing deliveries tended to change shape; their curvature decreased as visit length increased. We assessed this by subtracting choice (log behavior ratio) in the final bin from the other six and fitting regression lines to this corrected choice for each of the six bins across the nine continuations (i.e., six lines, nine points each). No change of shape would cause the slopes of these lines across pulses to be close to zero. Indeed, the slopes of these lines tended to be positive for continuing deliveries from the left lever and negative for continuing deliveries from the right lever, particularly for the middle bins. None of these slopes exceeded 0.6 (positive or negative), however, and most were less than 0.3, indicating that the change of shape was relatively small.
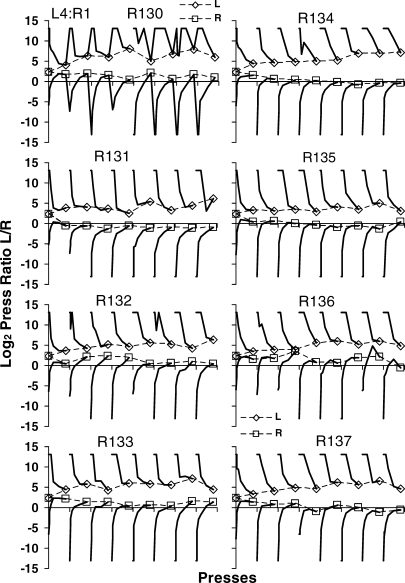
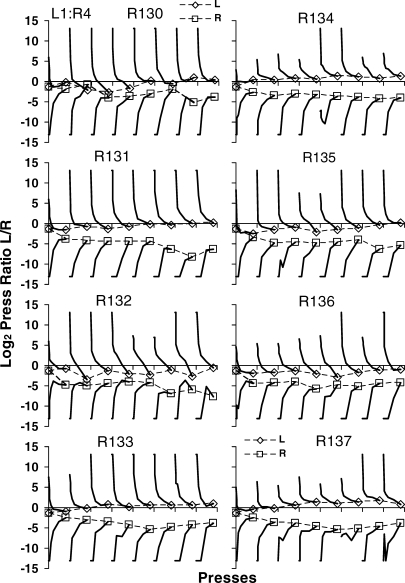
Figures A7–A9 show preference pulses following continuations for the individual rats in the three phases. The graphs extend only to eight deliveries, because no rat by itself produced enough data to estimate the preference pulse following nine deliveries. (The raw data used to produce Figure 10, as in the other figures, were pooled across rats.) The graphs confirm that the results in Figure 10 were representative of the individual rats.
Mathematical Model
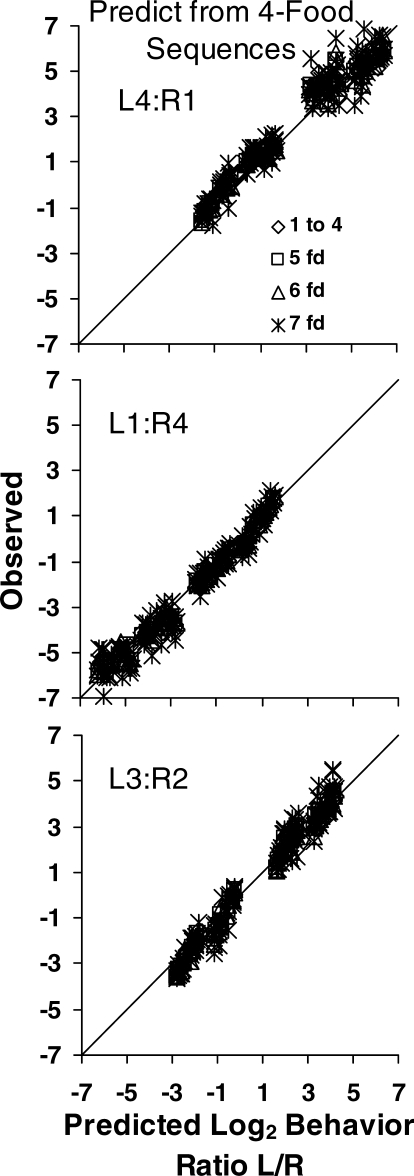
To examine control over local preference further, we fitted Equation 3 to the preferences between food deliveries following all sequences of food sources (left and right) up to sequences of seven food deliveries. Although Equation 3 could have as many as four parameters, if g and w were allowed to differ for the left and right, we only used the two parameters, g and w. To increase sample sizes, for sequences of five deliveries or longer, we pooled data from sequences beginning anywhere in the component, not just from the first food delivery. Analysis of the effects of earlier food deliveries comparable to that reported in the earlier paper (Aparicio & Baum, 2006) indicated that food deliveries more than five back had no discernible effect. The observed 254 log behavior ratios are plotted in Figure 11 against the 254 predicted log behavior ratios. The two free parameters (g and w) were estimated from the 16 sequences of the first four food deliveries and then used to predict preferences following all other sequences, of one to seven food deliveries. The proportion of variance accounted for (r2) across all sequences, lengths 1 to 7, was .95 or more in all three phases. Some unsystematic variation occurred, particularly for sequences of seven food deliveries. The analysis of residuals indicated that all deviant data points were from sequences for which the number of data was scant and that residuals bore no systematic relation to preference.
Fig 11.
For the three amount ratios: observed log (Left/Right) behavior ratio versus predicted log (Left/Right) behavior ratio. Equation 3 was fitted to preferences following the 16 source sequences of four food deliveries, and the parameters of that fit were used to predict preferences following all sequences of food sources (left and right levers) up to sequences of seven food deliveries. See text for more details.
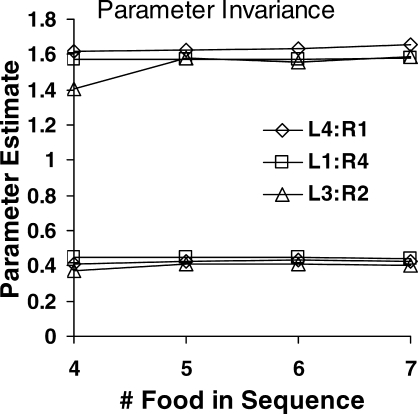
Figure 12 assesses the invariance of the parameters g and w in Equation 3 across estimates based on different subsets of the data. As we did with preferences following sequences of four food deliveries, we used preferences following sequences of five, six, or seven food deliveries (i.e., subsets of 32, 64, or 128 sequences out of 254) to predict all the rest. The estimates for sequences of four were used for Figure 11. Figure 12 shows that regardless of which subset of the data was used, estimates of g were always about 1.6 (range: 1.6 to 1.7; except 1.4 for sequences of four food deliveries in the amount ratio 3∶2) and estimates of w were always about 0.4 (range: 0.37 to 0.45). The proportion of variance accounted for (r2) was always at least .95.
Fig 12.
Invariance of the parameters g and w in Equation 3 across different sequence lengths and the three amount ratios. Each sequence length represents a different subset of the data used to predict the rest. See text for more details.
DISCUSSION
Contrary to the molecular view of behavior, the present results indicate that local choice not only depended on local variables but depended also on extended relative variables. In other words, one could not derive performance at any time scale from strictly local events. We tested this conclusion with analyses at three different time scales, from relatively extended to extremely local. The most extended scale examined choice between food deliveries within the components of sessions (still local compared to studies in which performance is averaged across whole sessions). More local analysis focused on visits between food deliveries, and the most local analysis treated choice press by press following food deliveries. At all three time scales, we found evidence of control by relative amount of food delivered, implying that even the most local choice measures depended on the food amounts from both levers. The local effect of each amount depended on a context that included the other even when it was not the most recently presented amount. This means that local preference depended on extended variables—food-amount ratio here.
Consistent with findings of studies in which only a 1∶1 food-amount ratio was arranged across seven food-rate ratios changing within sessions (Aparicio, 2008; Aparicio & Baum, 2006; Aparicio & Barajas, 2002; Aparicio & Otero, 2004; Baum & Davison, 2004; Davison & Baum, 2000, 2002, 2003, 2007), the present results confirmed that preference separated across components as a function of the rate ratio, favoring the lever with the higher probability of food over the lever with the lower probability of food (Figure 1). Across phases, the effect of relative food-amount was seen to move all choice (log behavior ratios) up or down approximately by a constant. This finding indicates a long-term effect of food-amount ratio on choice consistent with the result of Landon et al. (2003).
As choice developed within components, sensitivity to food-rate ratio calculated across the seven components increased with increasing number of food deliveries within components (Figure 2), resembling the findings of Davison and Baum (2000, 2002). The different food-amount ratios across phases left sensitivity to food-rate ratio unaffected, as it was in Davison and Baum's (2003) study. The level of sensitivity after nine food deliveries in a component, however, was slightly lower (around 0.8) than that obtained at the same point in our previous study (a mean of 0.9 in Aparicio & Baum, 2006); but it was higher than the average level of sensitivity (0.6) to food-rate ratio reported in studies with pigeons (i.e., Baum & Davison, 2004; Davison & Baum, 2000, 2002). As we previously suggested (Aparicio & Baum, 2006), the difference in sensitivity to food-rate ratio between pigeons and rats is probably due to the travel required for changing over (Aparicio & Baum, 1997; 2006; Baum & Aparicio, 1999); in the present study the rats were required to travel from the main panel to the back wall of the chamber, press on the changeover lever located there, and travel back to the main panel. In contrast, a changeover delay or no changeover requirement at all was utilized in those studies with pigeons (i.e., Baum & Davison, 2004; Davison & Baum, 2000, 2002, 2003). When the choice situation requires travel from one alternative to another, sensitivity to food-rate ratio increases because the cost of searching for food increases (e.g., Aparicio, 2001, 2008; Aparicio & Baum, 1997, 2006; Aparicio & Cabrera, 2001; Baum, 1982; Boelens & Kop, 1983; Cabrera & Aparicio, 2006).
Our estimates of sensitivity to food-amount ratio were greater than those found in studies that manipulated food-amount ratio in steady-state concurrent performance (Davison & Hogsden, 1984; Landon et al., 2002; Schneider, 1973; Todorov, 1973). But, were the effects of amount ratio on choice independent of the food-rate ratio's effects? That is, were the effects of these two variables additive as suggested by Baum and Rachlin (1969)? Some prior research with pigeons supported independence of amount and rate (e.g., Davison & Baum, 2003; Landon et al., 2003. The present data (Figure 3) and those of Davison and Baum (2003), show that when food-amount ratio is constant across sessions while food-rate ratio is varied within sessions, sensitivity to food-amount ratio is high and independent of food-rate ratio. In a current study, we assessed the converse proposition: whether when uneven food-rate ratios are maintained across sessions while food-amount ratio is varied within sessions, sensitivity to food-rate ratio would be high and independent of food-amount ratio. Thus, independence of sensitivity to amount ratio led us to ask, were the local effects of food deliveries additive with the overall effects? Consistent with the findings of several studies (e.g., Aparicio & Baum, 2006; Baum & Davison, 2004; Davison & Baum, 2000, 2002; Landon & Davison, 2001; Landon et al., 2002, 2003), the present results (Figures 4 and 5) confirmed substantial local effects of individual food deliveries: Each successive food delivery produced a shift of preference toward the lever from which it came. This finding differed from that of Landon et al. (2003), who examined local and extended effects of different food amounts in a standard concurrent schedule and found comparatively small and roughly symmetrical effects on preference following small or large amounts. Our results resembled theirs in that the long-term bias due to the food-amount ratio added to the local shifts in preference, but we found that the larger amount shifted local preference more than the smaller amount, resulting in asymmetry in the graphs shown in Figures 4 and 5. Further research would be needed to determine whether the differences between those results and ours resulted from procedural differences or the species difference.
Although Equation 3 predicted the asymmetry of preference shifts in Figures 4 and 5, it left open the question of whether the shifts in local preference depended on relative or absolute food amount. To address this we compared preference shifts following large and small food deliveries (Figure 6) with those of our earlier study with one pellet delivered at both alternatives (Aparicio & Baum, 2006). One pellet had the same maximal effect in that experiment as the larger amount (three or four pellets) in the present experiment. Coupled with the smaller effects of the smaller amounts (one or two pellets), this observation indicates that availability of a larger amount depressed the effect of the smaller amount; that is, contrary to what one might expect from the molecular view of behavior, the effects of amount were predominantly relative, rather than absolute.
In a general way, Equation 3 suggests that shifts in choice depended on both the food delivery and the present level of preference. This is perhaps most clear if Equation 3 is expressed as a difference equation:
| 4 |
where ΔPi equals the shift in log behavior ratio—positive or negative—from Pi to Pi+1. If Pi were large and positive, strongly favoring the left lever, and gA were positive, ΔPi would be a small positive number, indicating a small shift toward the left, whereas, if gA were negative, ΔPi would be a large negative number, indicating a large shift toward the right. Equation 4 thus captures the difference in effects of continuations and discontinuations. The model suggests “path independence”—that is, only present preference counts, not the sequence of food deliveries that produced that preference. However, strong preferences only resulted from continuing deliveries, permitting large shifts following discontinuations (Figure 5); mixed sequences resulted in moderate preferences, permitting only moderate shifts (Figure 4). Thus, the “path independence” is overridden by dependencies within the data.
Further evidence of control by relative amount appeared in the more local analyses of visits. Postfood visits increased with continuing food deliveries (Figure 7) in accord with absolute amount, but discontinuations, in contrast, affected postfood visits according to the relative amount. When we compared growth of postfood visits following larger and smaller continuations (Figure 8), we again found signs of control by relative amount.
Preference pulses (Figure 10) following discontinuations supplied further evidence of control by relative amount. Preference returned at the end to levels that reflected the amount ratios. Thus, even at this most local of time scales, we found evidence of control by a more extended variable, food-amount ratio. The special role of discontinuations (Figure 10) further supports the idea that control by relative amount results from the contrast between different successive amounts. If switches of amount have large effects, they would result in control by relative amount on any more extended time scale (Figures 5 and 7).
Because the effects of continuations and discontinuations both contribute in the calculation of preference in more extended choice, as in Figures 4 and 5 and analyses in which choice is calculated across entire sessions, extended preference depends on relative amount, but imperfectly so. Although continuations were always the most frequent individual sequences, sequences that included discontinuations made up more than half (about 60%) of all sequences of five or more food deliveries. Presumably, the larger the proportion of mixed sequences in a sample, the more choice shows control by relative amount. A possible test of this conjecture would be to manipulate the frequencies of different sequences, rather than leaving them up to chance.
Overall, our analyses of postfood visits are consistent with progression toward the fix-and-sample pattern (i.e., Baum, Schwendiman, & Bell, 1999) documented in steady-state experimentation (Baum, 2002; Baum & Aparicio, 1999) and evidenced with choice in transition when more rapid adaptation of behavior was required (i.e., Aparicio & Baum, 2006; Baum & Davison, 2004). In the present study, the lever that provided several continuing deliveries constitutes the high-rate (rich) lever and the lever that occasionally provided a discontinuation constitutes the low-rate (lean) lever. Postfood visits to the low-rate, small-amount lever were minimal or short and decreasing (Figure 7), whereas postfood visits to the low-rate, large-amount lever were longer but also decreasing. Postfood visits to the high-rate, small-amount lever grew, but remained relatively short, meaning that a switch to the low-rate, large-amount lever occurred relatively soon. These effects would be consistent with the possibility (not yet tested) that sampling of the lean lever might depend on the amount of food delivered at its low rate of delivery—both frequency of sampling and length of a sample visit might be affected.
Control by relative amount might or might not be consistent with the proposal by Timberlake and Lucas (1989) that foraging includes two types of search: focal search immediately preceding and following the discovery and ingestion of food; and general search following unsuccessful focal search. In our experiment, postfood visits might represent focal search, and postchangeover visits might correspond to general search. How these concepts would relate to control by relative amount, rate, and delay remains uncertain.
On the whole, the present results contributed to the body of evidence showing that local shifts in preference depend on relative amount, relative delay (Davison & Baum, 2007), and relative rate (Baum & Davison, 2004) of food deliveries. As Davison and Baum (2007) pointed out, even though the overall rate of food delivery remains the same, if food occurs at a lower relative rate, or at a longer relative delay, or in a smaller relative amount, as in the present study, preference pulses and visit lengths are reduced following food delivery. Such control by relative variables contradicts any theoretical account based on local strengthening by immediate consequences. Thus, the present study supports Davison and Baum's (2006, 2007) conclusion that food delivery functions as a discriminative stimulus, guiding behavior rather than strengthening it, by showing that local preference depends particularly on switches of amount from one delivery to the next (i.e., discontinuations), a result that implicates control by comparison of amounts or amount ratio.
Acknowledgments
The national Council of Science and Technology supported this research; Grant 42050H. Portions of this paper were presented at the 33RD Annual Convention of the Association for Behavior Analysis, San Diego 2007. The paper was written during a sabbatical leave of the first author at the University of North Carolina Wilmington. We thank Claudia Oyosa for her help running the study and looking after the experimental animals.
Fig A1.
Interfood behavior ratios for individual rats in the phase in which the left lever delivered four pellets and the right lever one pellet. Filled symbols and solid lines show preference following continuations, and unfilled symbols and broken lines show preference following discontinuations. Con stands for continuation. Dis stands for discontinuation. R stands for right; L stands for left.
Fig A2.
Interfood behavior ratios for individual rats in the phase in which the left lever delivered one pellet and the right lever four pellets. Other details as in Figure A1.
Fig A3.
Interfood behavior ratios for individual rats in the phase in which the left lever delivered three pellets and the right lever two pellets. Other details as in Figure A1.
Fig A4.
For individual rats in the phase in which the left lever delivered four pellets and the right lever one pellet: visit length (presses per visit) following the larger amount as a function of the comparable visit length following the smaller amount, as in Figure 8. The sequences of food deliveries are mirror images—for example, 4-4-4-4 versus 1-1-1-1 or 1-1-1-4 versus 4-4-4-1. Triangles indicate continuations and squares discontinuations.
Fig A5.
For individual rats in the phase in which the left lever delivered one pellet and the right lever four pellets. Other details as in Figure A4.
Fig A6.
For individual rats in the phase in which the left lever delivered three pellets and the right lever two pellets. Other details as in Figure A4.
Fig A7.
Preference pulses following continuing food deliveries up to the eighth food delivery in components in the phase in which the left lever delivered four pellets and the right lever one pellet. Curves were constructed by calculating preference for press 1, presses 2 and 3, presses 4-7, presses 8-15, presses 16-31, presses 32-63, and presses 64-100. The symbols and lines show the final points of the curves. See text for more explanation.
Fig A8.
Preference pulses following continuing food deliveries up to the eighth food delivery in components in the phase in which the left lever delivered one pellet and the right lever four pellets. Other details as in Figure A7.
Fig A9.
Preference pulses following continuing food deliveries up to the eighth food delivery in components in the phase in which the left lever delivered three pellets and the right lever two pellets. Other details as in Figure A7.
Footnotes
It was first presented in a poster by M. Davison and W. M. Baum (2007) at the Thirtieth Annual Conference of the Society for the Quantitative Analyses of Behavior, San Diego.
REFERENCES
- Aparicio C.F. Overmatching in rats: The barrier choice paradigm. Journal of the Experimental Analysis of Behavior. 2001;75:93–106. doi: 10.1901/jeab.2001.75-93. [DOI] [PMC free article] [PubMed] [Google Scholar]
- Aparicio C.F. Haloperidol, dynamics of choice, and the parameters of the matching law. Behavioural Processes. 2007;75(2):206–212. doi: 10.1016/j.beproc.2007.02.024. [DOI] [PubMed] [Google Scholar]
- Aparicio C.F. Dynamics of choice and frequency of environment change. Behavioural Processes. 2008;78(2):165–172. doi: 10.1016/j.beproc.2008.03.001. [DOI] [PubMed] [Google Scholar]
- Aparicio C.F, Barajas A. Dynamic changes in reinforcement contingencies of a choice situation: Steady state concurrent performance is required. Mexican Journal of Behavior Analysis. 2002;28:67–90. [Google Scholar]
- Aparicio C.F, Baum W.M. Comparing locomotion with lever-press travel in an operant simulation of foraging. Journal of the Experimental Analysis of Behavior. 1997;68:177–192. doi: 10.1901/jeab.1997.68-177. [DOI] [PMC free article] [PubMed] [Google Scholar]
- Aparicio C.F, Baum W.M. Fix and sample with rats in the dynamics of choice. Journal of the Experimental Analysis of Behavior. 2006;86:43–63. doi: 10.1901/jeab.2006.57-05. [DOI] [PMC free article] [PubMed] [Google Scholar]
- Aparicio C.F, Cabrera F. Choice with multiple alternatives: The barrier choice paradigm. Mexican Journal of Behavior Analysis. 2001;27:97–118. [Google Scholar]
- Aparicio C.F, Otero E. Sensitivity to reinforcement and changeover requirements in dynamic and quasi-stable environments. Mexican Journal of Behavior Analysis. 2004;30:23–78. [Google Scholar]
- Baum W.M. The correlation-based law of effect. Journal of the Experimental Analysis of Behavior. 1973;20:137–153. doi: 10.1901/jeab.1973.20-137. [DOI] [PMC free article] [PubMed] [Google Scholar]
- Baum W.M. On two types of deviation from the matching law: Bias and undermatching. Journal of the Experimental Analysis of Behavior. 1974;22:231–242. doi: 10.1901/jeab.1974.22-231. [DOI] [PMC free article] [PubMed] [Google Scholar]
- Baum W.M. Optimization and the matching law as accounts of instrumental behavior. Journal of the Experimental Analysis of Behavior. 1981;36:387–403. doi: 10.1901/jeab.1981.36-387. [DOI] [PMC free article] [PubMed] [Google Scholar]
- Baum W.M. Choice, changeover, and travel. Journal of the Experimental Analysis of Behavior. 1982;38:35–49. doi: 10.1901/jeab.1982.38-35. [DOI] [PMC free article] [PubMed] [Google Scholar]
- Baum W.M. From molecular to molar: A paradigm shift in behavior analysis. Journal of the Experimental Analysis of Behavior. 2002;78:95–116. doi: 10.1901/jeab.2002.78-95. [DOI] [PMC free article] [PubMed] [Google Scholar]
- Baum W.M, Aparicio C.F. Optimality and concurrent variable-interval variable-ratio schedules. Journal of the Experimental Analysis of Behavior. 1999;71:75–89. doi: 10.1901/jeab.1999.71-75. [DOI] [PMC free article] [PubMed] [Google Scholar]
- Baum W.M, Davison M. Choice in a variable environment: Visit patterns in the dynamics of choice. Journal of the Experimental Analysis of Behavior. 2004;81:85–127. doi: 10.1901/jeab.2004.81-85. [DOI] [PMC free article] [PubMed] [Google Scholar]
- Baum W.M, Rachlin H.C. Choice as time allocation. Journal of the Experimental Analysis of Behavior. 1969;12:861–874. doi: 10.1901/jeab.1969.12-861. [DOI] [PMC free article] [PubMed] [Google Scholar]
- Baum W.M, Schwendiman J.W, Bell K.E. Choice, contingency discrimination, and foraging theory. Journal of the Experimental Analysis of Behavior. 1999;71:355–373. doi: 10.1901/jeab.1999.71-355. [DOI] [PMC free article] [PubMed] [Google Scholar]
- Boelens H, Kop P.F.M. Concurrent schedules: Spatial separation of response alternatives. Journal of the Experimental Analysis of Behavior. 1983;40:35–45. doi: 10.1901/jeab.1983.40-35. [DOI] [PMC free article] [PubMed] [Google Scholar]
- Brown P.L, Jenkins H.M. Auto-shaping of the pigeon's keypeck. Journal of the Experimental Analysis of Behavior. 1968;11:1–8. doi: 10.1901/jeab.1968.11-1. [DOI] [PMC free article] [PubMed] [Google Scholar]
- Cabrera F, Aparicio C.F. Travel, sensitivity to reinforcement, and multiple alternatives. Brazilian Journal of Behavior Analysis. 2006;2:219–232. [Google Scholar]
- Catania A.C. The flight from experimental analysis. In: Bradshaw C.M, Szabadi E, Lowe C.F, editors. Quantification of steady-state operant behaviour. Amsterdam: Elsevier/North-Holland; 1981. (pp. 49-64). [Google Scholar]
- Davison M, Baum W.M. Choice in a variable environment: Every reinforcer counts. Journal of the Experimental Analysis of Behavior. 2000;74:1–24. doi: 10.1901/jeab.2000.74-1. [DOI] [PMC free article] [PubMed] [Google Scholar]
- Davison M, Baum W.M. Choice in a variable environment: Effects of blackout duration and extinction between components. Journal of the Experimental Analysis of Behavior. 2002;77:65–89. doi: 10.1901/jeab.2002.77-65. [DOI] [PMC free article] [PubMed] [Google Scholar]
- Davison M, Baum W.M. Every reinforcer counts: Reinforcer magnitude and local preference. Journal of the Experimental Analysis of Behavior. 2003;80:95–129. doi: 10.1901/jeab.2003.80-95. [DOI] [PMC free article] [PubMed] [Google Scholar]
- Davison M, Baum W.M. Local effects of delayed food. Journal of the Experimental Analysis of Behavior. 2006;87:241–260. doi: 10.1901/jeab.2007.13-06. [DOI] [PMC free article] [PubMed] [Google Scholar]
- Davison M, Baum W.M. Do conditional reinforcers count. Journal of the Experimental Analysis of Behavior. 2007;86:269–283. doi: 10.1901/jeab.2006.56-05. [DOI] [PMC free article] [PubMed] [Google Scholar]
- Davison M, Hogsden I. Concurrent variable-interval schedule performance: Fixed versus mixed reinforcer durations. Journal of the Experimental Analysis of Behavior. 1984;41:169–182. doi: 10.1901/jeab.1984.41-169. [DOI] [PMC free article] [PubMed] [Google Scholar]
- Herrnstein R.J. Relative and absolute strength of response as a function of frequency of reinforcement. Journal of the Experimental Analysis of Behavior. 1961;4:267–272. doi: 10.1901/jeab.1961.4-267. [DOI] [PMC free article] [PubMed] [Google Scholar]
- Landon J, Davison M. Reinforcer-ratio variation and its effects on rate of adaptation. Journal of the Experimental Analysis of Behavior. 2001;75:207–234. doi: 10.1901/jeab.2001.75-207. [DOI] [PMC free article] [PubMed] [Google Scholar]
- Landon J, Davison M, Elliffe D. Concurrent schedules: Short-and long-term effects of reinforcers. Journal of the Experimental Analysis of Behavior. 2002;77:257–271. doi: 10.1901/jeab.2002.77-257. [DOI] [PMC free article] [PubMed] [Google Scholar]
- Landon J, Davison M, Elliffe D. Concurrent schedules: Reinforcer magnitude effects. Journal of the Experimental Analysis of Behavior. 2003;79:351–365. doi: 10.1901/jeab.2003.79-351. [DOI] [PMC free article] [PubMed] [Google Scholar]
- McLean A.P, Blampied N.M. Sensitivity to relative reinforcer rate in concurrent schedules: Independence from relative and absolute reinforcer duration. Journal of the Experimental Analysis of Behavior. 2001;75:25–42. doi: 10.1901/jeab.2001.75-25. [DOI] [PMC free article] [PubMed] [Google Scholar]
- Pliskoff S.S, Cicerone R, Nelson T.D. Local response-rate constancy on concurrent variable-interval schedules of reinforcement. Journal of the Experimental Analysis of Behavior. 1978;29:431–446. doi: 10.1901/jeab.1978.29-431. [DOI] [PMC free article] [PubMed] [Google Scholar]
- Schneider J.W. Reinforcer effectiveness as a function of reinforcer rate and magnitude: a comparison of concurrent performances. Journal of the Experimental Analysis of Behavior. 1973;20:461–472. doi: 10.1901/jeab.1973.20-461. [DOI] [PMC free article] [PubMed] [Google Scholar]
- Skinner B.F. Cumulative record. New York: Appleton-Century-Crofts; 1961. The generic nature of the concepts of stimulus and response. (Enlarged ed., pp. 347–366). (Original work published 1935). [Google Scholar]
- Skinner B.F. Cumulative record. New York: Appleton-Century-Crofts; 1961. “Superstition” in the Pigeon. (Enlarged ed., pp. 404–409). (Original work published 1948). [Google Scholar]
- Skinner B.F. Some thoughts about the future. Journal of the Experimental Analysis of Behavior. 1986;45:229–235. doi: 10.1901/jeab.1986.45-229. [DOI] [PMC free article] [PubMed] [Google Scholar]
- Stubbs D.A, Pliskoff S.S, Reid H.M. Concurrent schedules: a quantitative relation between changeover behavior and its consequences. Journal of the Experimental Analysis of Behavior. 1977;27:85–96. doi: 10.1901/jeab.1977.27-85. [DOI] [PMC free article] [PubMed] [Google Scholar]
- Timberlake W, Lucas G.A. Behavior systems and learning: From misbehavior to general principles. In: Klein S.B, Mowrer R.R, editors. Contemporary learning theories: Instrumental conditioning theory and the impact of biological constraints on learning. Hillsdale, NJ: Erlbaum; 1989. (pp. 237-275). [Google Scholar]
- Todorov J.C. Interaction of frequency and magnitude of reinforcement on concurrent performance. Journal of the Experimental Analysis of Behavior. 1973;19:451–458. doi: 10.1901/jeab.1973.19-451. [DOI] [PMC free article] [PubMed] [Google Scholar]


