

Abstract
EEG and EEG source-estimation are susceptible to electromyographic artifacts (EMG) generated by the cranial muscles. EMG can mask genuine effects or masquerade as a legitimate effect - even in low frequencies, such as alpha (8–13Hz). Although regression-based correction has been used previously, only cursory attempts at validation exist and the utility for source-localized data is unknown. To address this, EEG was recorded from 17 participants while neurogenic and myogenic activity were factorially varied. We assessed the sensitivity and specificity of four regression-based techniques: between-subjects, between-subjects using difference-scores, within-subjects condition-wise, and within-subject epoch-wise on the scalp and in data modeled using the LORETA algorithm. Although within-subject epoch-wise showed superior performance on the scalp, no technique succeeded in the source-space. Aside from validating the novel epoch-wise methods on the scalp, we highlight methods requiring further development.
A perpetual worry in electroencephalography (EEG) research is contamination by non-neural artifacts, as such artifacts can obscure genuine effects and generate artificial effects when confounded with experimental manipulations. Although a substantial body of work describing methods for removing ocular artifacts (i.e. blinks and saccadic movements) exists, methods for addressing electromyographic artifact (EMG) have received comparatively scant attention. This is troubling because EMG possesses a broad spatial and spectral distribution and a propensity for being confounded with experimental manipulations (Borden, Peterson, & Jackson, 1991; Cohen, Davidson, Senulis & Saron, 1992; Waterink & van Boxtel, 1994; Ohrbach et al., 1998; Dimberg, Thunberg & Elmehed, 2000; Bradley, Codispoti, Cuthbert & Lang, 2001; Coan & Allen, 2003). These attributes make it difficult to draw unambiguous conclusions about the substantive scientific question of interest in cases where EMG contamination is probable.
EMG possesses a broad spatial distribution because muscle groups exist across the head, face and neck which are capable of independently generating EMG (Figure 1). Anterior electrodes are sensitive to facial muscles (Corrugator supercilii and Frontalis), temporal and central electrodes are sensitive to masticatory muscles (primarily Masseter and Temporalis), and posterior electrodes show sensitivity to muscles throughout the neck and shoulders (Van Boxtel, 2001; Goncharova, McFarland, Vaughan & Wolpaw, 2003; Whitham et al., 2007, 2008). The definition of EMG is further complicated by the fact that the signal arising from each muscle group shows a characteristic power spectra; Frontalis power peaks in 20–30 Hz, and Temporalis has a multimodal spectra with a low peak around 20 Hz and broad plateau at 40–80 Hz (Goncharova et al., 2003). However, myogenic effects also descend the frequency spectrum to frequencies as low as 2 Hz (Goncharova et al., 2003) making even the widely used alpha band (8–13Hz) susceptible to muscle artifacts (Lee & Buchsbaum, 1987; Willis, Nelson, Rice, & Black, 1993; Van Boxtel, 2001). The presence of myogenic activity throughout the EEG spectrum was convincingly demonstrated by Whitham et al. (2007), who recorded EEG during a simple cognitive task before and after the administration of a neuromuscular blockade that paralyzed the scalp musculature. Following administration, EEG power in the 25–30 Hz (i.e., high beta / low gamma) band was reduced 84%.
Figure 1. Illustration of the cranial musculature.
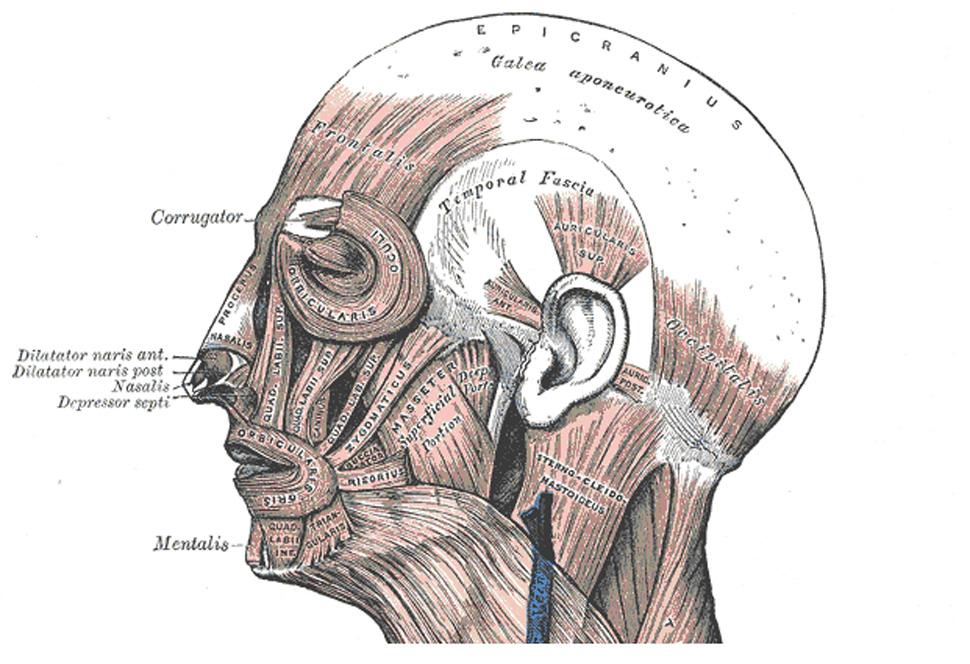
The cranial musculature as depicted in Gray’s Anatomy (Gray, 1918; http://www.bartleby.com/). Nearly all cephalic electrodes lie on top of or adjacent to muscle, making EMG contamination a concern for the entire head – not just anterior electrodes.
Given the prevalence of EMG contamination and its ability to distort inferences about neurogenic EEG signals, it is essential that researchers understand how to properly address the presence of this artifact in their data. Looking to the literature on ocular artifacts for inspiration, one sees that artifact can be addressed using either rejection-based methods that simply discard corrupted epochs of data, or correction-based methods that exploit highly stereotyped spatial and/or temporal distributions of artifact to and remove their contributions to the data (Gratton, 1998; Jung et al., 2000; Onton, Westerfield, Townsend, & Makeig, 2006; Fitzgibbon, Powers, Pope, & Clark, 2007). Rejection-based methods are most appropriate for transient artifacts, such as blinks and saccadic eye movements, that influence a small portion of the data record. The protracted time-course of low-intensity EMG makes such a rejection-based solution impractical, because the data rejection rate would be unacceptably high and erode the signal-to-noise ratio. Furthermore, EMG covaries with a number of psychological processes of interest, such as induced emotional states (Borden et al., 1991; Coan & Allen, 2003; Bradley et al., 2001), facial expressions (including facial mimicry during the perception of emotional faces; Dimberg et al., 2000), cognitive load (Cohen et al., 1992; Waterink & van Boxtel, 1994; Ohrbach et al., 1998; Whitham et al., 2007/2008), and likely covaries with key demographic variables, such as age and psychiatric status. These observations indicate that rejecting data laden with EMG artifact would entail discarding the most interesting, psychologically discriminative periods of neural activity (Davidson, Ekman, Saron, Senulis & Friesen, 1990). For these reasons, EMG requires the use of an artifact correction method.
Unfortunately, the development of EMG-correction of methods has been impeded by the absence of well-stereotyped spatial or temporal EMG distributions to serve as templates for filtering artifactual signal. Early commentators advocated the use of low-pass filters for EMG correction (Gotman, 1981; Barlow, 1984; Sadasivan & Dutt, 1995), however this strategy does not ameliorate EMG contamination in the pass-band. More recently, power-residualization methods that require no a priori assumptions about the spatial distribution of EMG have been used to remove EMG contributions from frequencies of interest. A number of regression-based techniques for correcting EMG artifact have been described in the literature (for reviews, see Allen, Coan & Nazarian, 2004; Davidson, Jackson and Larson, 2000). In each case, a pre-defined frequency band (e.g., 70–80Hz) serves as an index of EMG activity and a variant of the general linear model (GLM; e.g., multiple regression, ANCOVA) is used to statistically partition variance from the neurogenic band-of-interest (e.g., alpha, gamma). Variations on this method have included performing regression between-subjects (Gasser, Schuller, & Gasser, 2005; Coan & Allen, 2003; Schellberg, Besthorn, Klos & Gasser, 1990) or within-subjects (Davidson, Marshall, Tomarken, & Henriques, 2000; Pivik, Broughton, Coppola, Davidson, Fox & Nuwer, 1993). Furthermore, a variety of EMG indices have been reported: 25–100 Hz (Schellberg et al., 1990), 51–69Hz (Gasser et al., 2005), 70–80 Hz (Davidson et al., 2000), 70–90 Hz (Coan, Allen, & Harmon-Jones, 2001), and 80–120 Hz (Lutz, Greischar, Rawlings, Ricard & Davidson, 2004).
Although the power-residualization method has established itself as the most prevalent means of correcting EMG contamination, only cursory attempts have been made to validate its performance. Gasser et al. (2005) report the only attempt to validate the residualization-based approach to EMG correction. They employed a 51–69Hz EMG index to remove artifact from naturalistically collected resting EEG in both control and Alzheimer patients. Myogenic activity was not experimentally manipulated. Instead, epochs of data were visually inspected and subjectively categorized as “EMG-corrupted” or “Clean” by the investigators. Change in beta-band (17.5 – 25.0Hz) spectral power between the corrupted and clean conditions was compared before and after between-subjects residualization. A strong Corrupted-Clean effect was present before, but not after, correction. However, this result does not fully validate the method. The spontaneous (i.e. non-instructed) expression of EMG in a baseline period likely covaries with some psychological variable (e.g. anxiety) that would manifest itself in the EEG as well, so one does not know what the true underlying EEG signal should be after residualization. This concern about an unknown effect in the EEG signal coinciding with the EMG artifact is exacerbated by the use of Alzheimer patients that demonstrated a relationship between the amount of EMG present in their data and the status of their disease. Ad-hoc experimental designs, such as Gasser et al (2005), cannot fully validate the correction method because the artifact is confounded with additional variables whose effects are unknown.
The primary aim of this paper was to rigorously validate EMG-residualization methods using a dataset where participants perform scripted facial movements and alpha blocking in a factorial design. This dataset enabled an evaluation of different EMG-bands and regression techniques to provide definitive validation by quantitatively evaluating the sensitivity (ability to remove artifactual myogenic signals) and specificity (ability to preserve non-artifactual neurogenic signal) of each technique on a variety of experimental contrasts. This analysis exclusively used alpha-band power because it is a popular band that is strongly linked to cerebral activation (Allen, Coan & Nazarian, 2004; Oakes et al., 2004) and its manipulation via eyes open/closed alpha blocking (i.e., the so-called “Berger maneuver”) is a simple and well understood EEG effect. Blocking of sensory-modality specific actions has been shown to alter alpha-band power originating from the corresponding sensory cortex, such that the gross increase in cortical activation induced by these actions is reflected in decreased alpha-band power. The eyes open/closed manipulation performed here is a well-documented technique for manipulating activity within the occipital cortex, and by extension, alpha-band power at posterior electrodes (Berger, 1932, as cited in Allen, Coan & Nazarian, 2004).
A secondary aim was to examine whether regression-based techniques can be fruitfully extended to correct artifacts in intracerebral source-models models of scalp-recorded spectral power. Source modeling is an increasingly popular technique for maximizing the anatomical information yielded by scalp-recorded EEG (Pizzagalli, 2007) and the dissemination of freely available software for performing source localization, such as LORETA-KEY (Pascual-Marqui, 1999; http://www.unizh.ch/keyinst/), SPM5 (Phillips, Rugg & Friston, 2002; http://www.fil.ion.ucl.ac.uk/spm/), and Cartool (http://brainmapping.unige.ch/Cartool.htm), is likely to accelerate this trend. It is important that researchers understand how muscle artifact is manifest in intracerebral solutions, and that the appropriate tools for correcting it are available. To these ends, we extended electrode-wise regression techniques to operate on a voxel-wise basis and assessed their sensitivity and specificity on distributed source solutions estimated using the low-resolution electromagnetic tomography (LORETA) algorithm for source localization.
Method
Participants
Seventeen individuals (16 female; M = 24.1 years, SD = 7.1) were recruited from the University of Wisconsin – Madison community in accord with the guidelines prescribed by the local Institutional Review Board. They received US$20 for their participation.
Design
The experimental protocol took the form of a 2 (Alpha-blocking: Eyes Open, Eyes Closed) × 2 (EMG: Tense, Relaxed) repeated-measures design. We anticipated that participants would generate greater EMG power during the tense compared to relaxed conditions, and greater alpha power, indicative of lessened activation (Allen, Coan & Nazarian, 2004; Oakes et al., 2004), during the eyes-closed condition (Berger, 1932, as cited in Allen, Coan & Nazarian, 2004). For the remainder of this report we refer to the experimental conditions using the following acronyms: Open-Relaxed (OR), Open-Tense (OT), Closed-Relaxed (CR), and Closed-Tense (CT).
Procedure
After obtaining consent, participants were instructed how to properly tense facial muscles during the experiment. Protocols from previous studies of facial EMG were adapted to achieve contraction of specific muscle groups (Goncharova et al., 2003; Van Boxtel, 2001; Chung, Kim, & McCall, 2002). Lifting and squeezing the eyebrows together contracted the frontalis and corrugator muscles, and lightly clenching the jaw engaged the masseter and temporalis. Participants were instructed that the intensity of contraction should create a visible facial expression, but remain light enough that they barely perceived the tension. A hand-held mirror was provided to help practice performing the movements.
EEG data were recorded in sixteen 32-second blocks (order counterbalanced across subjects). During each block, the intensity of muscle contraction was monitored via video monitor and real-time EEG. On the rare occasion that there were concerns about performance, participants received verbal feedback and the data for that block were re-recorded.
Scalp EEG Data Reduction and Analysis
EEG data were collected using a 128-channel Geodesic Sensor Net (GSN128; Electrical Geodesics Inc., Eugene, OR) referenced to vertex (Cz) and sampled at 500-Hz (analog anti-aliasing: 0.1 – 250 Hz)1. Data reduction used a combination of EEGLAB 4.5 (Delorme & Makeig, 2004; http://www.sccn.ucsd.edu/eeglab/) and in-house code written for MATLAB (The MathWorks Inc., Natick, MA) in broad accord with previous reports by our group (e.g., Greischar et al., 2004). A zero-phase 60-Hz notch filter removed line noise from calibrated (µV) data. Epochs (1.024-s) contaminated by gross artifacts (i.e., deviations exceeding ±200 µV for more than half an epoch or variance exceeding 1000 µV2) or flat channel(s) (epoch variance less than 0.25 µV2) were automatically marked for rejection (Delorme, Sejnowski & Makeig, 2007). These gross myographic artifacts were rejected from the data to better approximate the subtle contamination of signal that can occur when EMG covaries with an experimental treatment. In our experience, removal of gross artifact also facilitates the correction of ocular artifact.
An independent component analysis (ICA)-based approach identified and removed ocular artifacts (Jung et al., 2000; Delorme et al., 2007). Five independent components were extracted from the OR data for each subject after rejecting gross artifacts. Components indicative of ocular artifact were identified manually and removed from all experimental conditions. The use of ICA for the correction of EMG artifact is beyond the scope of the present report, but as discussed below is an important on-going area of methodological research in our laboratory and others (De Clercq, Vergult, Vanrumste, Paesschen & Van Huffel, 2006; Mammone & Morabito, 2007). After ocular artifact removal, unusable channels were interpolated using a spherical spline in cases where at least one neighboring electrode was usable (Greischar et al., 2004). EEG data were re-referenced to an average montage (Davidson, Jackson & Larson, 2000; Dien, 1998) and spectral power density (µV2/Hz) was estimated for the alpha EEG (8–13Hz) and EMG bands (see EMG Indices) using Welch’s (1967) method on sliding Hanning-windowed epochs (with 50% overlap). These estimates were log10 transformed to normalize the distribution (Allen, Coan & Nazarian, 2004; Gasser, Bacher & Mocks, 1982). Because alpha represents an inverse measure of cerebral activity (Davidson et al., 2000; Allen et al., 2004; Oakes et al., 2004; Romei, Brodbeck, Michel, Amedi, Pascual-Leone & Thut, 2007; Laufs, in press), we interpreted reductions in power as indicative of greater cerebral activation.
LORETA Distributed Source Estimation
The modeling of distributed sources from scalp-recorded electrical activity was performed in general accord with previously described procedures (e.g., Pizzagalli, Oakes & Davidson, 2003; Putnam, Pizzagalli, Gooding, Kalin & Davidson, in press). In brief, in-house MATLAB code implementing the LORETA algorithm (Pascual-Marqui, Michel & Lehmann, 1994) estimated cerebral activation. LORETA has undergone extensive cross-modal validation2 and is often preferred to over-determined dipole-based source modeling methods (e.g., BESA)3.
Three-dimensional intracerebral current density estimates (A/m2) were generated by applying an inverse operator distributed with the LORETA-Key software suite (Pascual-Marqui, 1999; http://www.unizh.ch/keyinst/; regularization parameter for lead-field smoothing of 10−5) to EMG- and Alpha-band cross-spectral matrices that were calculated with the artifact-free Hanning-windowed epochs from the scalp analyses. The forward-model is a 3-shell spherical head model using 125 cephalic EEG electrodes. The source-space is normalized to the Montreal Neurologic Institute’s probabilistic MRI anatomical template (i.e., MNI305; Evans et al, 1993; Collins, Neelin, Peters & Evans, 1994), restricted to the cerebral gray matter, hippocampi, and amygdalae on a 7-mm3 isotropic lattice. LORETA source-estimates were log10-transformed prior to analysis (Thatcher, North & Biver, 2005). Results are displayed on the rendered canonical brain provided with LORETA-Key.
Regression-Based EMG Correction Techniques
This study examined four different regression-based techniques for removing EMG artifact: within-subjects epoch-wise, within-subjects condition-wise, between-subjects condition-wise, and between-subjects with condition difference scores. Henceforth, these methods are respectively referred to as the “epoch-wise”, “condition-wise”, “between-subjects” and “difference-scores” techniques. In each case, regressions used log-transformed spectral power density from the alpha-band EEG as the dependent measure and an EMG index as the predictor in a regression model. The index of EMG activation was calculated separately from each EEG electrode as the log-transformed spectral-power within a specified frequency range at that given electrode. The regression was performed using a linear model with ordinary least-squares parameter estimation (i.e. EEGalpha power = b1*EEGEMG power + b0 + e). Residualized EEG power was calculated as the sum of the nonstandardized residuals plus the constant-term from this regression model (b0 + e). In all cases, separate regression models were computed for each channel or voxel. Inferential statistics were computed on the residualized (“EMG-filtered”) EEG-power values.
Both the epoch-wise and condition-wise techniques made use of regressions computed separately for each participant. Epoch-wise correction made use of power estimates (i.e., EMG and Alpha EEG) from each 1.024-second window (“epoch”) of data as points in the regression. When epoch-wise correction was applied to LORETA solutions, separate cross-spectral matrices and source-estimates were created for each 1.024 second Hanning-windowed epoch of data. To the best of our knowledge, this technique is a novel extension of the regression-based family of EMG-correction methods. Condition-wise correction (Davidson, 1988; Pivik et al, 1993; Davidson, Marshall, Tomarken, & Henriques, 2000; Lutz, Greischar, Rawlings, Ricard & Davidson, 2004) is very similar to the epoch-wise method, however mean power estimates from each of the four conditions (i.e., averaged across epochs) are used as points in the regression.
Both the between-subjects and difference-score techniques made use of inter-individual regressions, so each regression model uses data from all subjects. Between-subjects correction (Gasser, Schuller, & Gasser, 2005; Coan & Allen, 2003; Schellberg, Besthorn, Klos & Gasser, 1990) uses the mean power estimate for each condition from each subject for the regression. The difference-score correction was performed using differences in spectral power between a “treatment” and “control” condition (e.g., OT minus OR) instead of mean power estimates from each condition. For the difference-score method, separate regression models were computed for each contrast of interest.
EMG Indices
For each of the four correction techniques, we examined three different indices of EMG power: 45–200 Hz, 70–80 Hz, and 51–69 Hz. The 45–200 Hz index is a broad-band definition for EMG power, commonly employed in psychophysiological work where facial EMG is a variable of substantive interest (e.g., Sutton, Davidson, Donzella, Irwin & Dottl, 1997; Shackman, Sarinopoulos, Maxwell, Pizzagalli, Lavric & Davidson, 2006), whereas the latter two narrow-band indices have been previously employed for the purpose of correcting scalp EEG for EMG contamination (Davidson et al, 2000; Gasser et al, 2005).4 Although not exhaustive of all possible EMG band definitions, these bands provide sufficient diversity to represent those used in previous studies and ultimately gauge the influence that the definition of EMG-band has upon the residualization technique. Power in an EMG frequency-band was calculated at each EEG channel and used as the EMG predictor in the regression model at that channel. By estimating EMG separately at each channel, we can compensate for the fact that EMG arises from several muscle groups each possessing unique frequencies and spatial distributions (Van Boxtel, 2001; Goncharova, McFarland, Vaughan & Wolpaw, 2003) that will result in variations in myogenic artifact at different electrodes. An additional benefit is that this approach does not require dedicated EMG electrodes, so experimenters that do not collect data from these sites may perform this correction as well.
Evaluation Strategy
Each combination of correction technique and EMG index was evaluated in terms of its sensitivity, defined as the attenuation of myogenic artifact in the alpha band, and specificity, defined as the preservation and/or recovery of neurogenic effects in the alpha band.
Quantification of sensitivity
In order to assess sensitivity, we created a myogenic region of interest (ROI) by thresholding the alpha-band OR-OT contrast at a two-tailed p < 0.01 for scalp data and two-tailed p < 0.005 for LORETA solutions. We then examined the degree to which data corrected with each of the regression-based techniques attenuated alpha-band myogenic effects with a double difference score that measured the difference between a contrast of interest (see below) after residualizing and the ‘ideal’ results. The median t-score in the myogenic ROI from this double-difference contrast quantified the amount of artifact surviving correction and/or data corruption due to residualization. This procedure evaluated four contrasts of interest: (i) the purely EMG effect (residualized OR-OT), (ii) purely EEG effect ([residualized (OR-CR)] – [OR-CR]), (iii) EMG and EEG positively covaried ([residualized OR-CT] – [OR-CR]), and (iv) EMG and EEG negatively covaried ([residualized OT-CR] – [OR-CR]). The final contrast is analogous to experiments in which an emotionally neutral condition is compared to an emotionally provocative condition (i.e., amplified EMG and attenuated alpha power, indicative of greater neural activation).
A significant t-test for any of these contrasts (p < 0.05, uncorrected) indicates the presence of significant activity in the myogenic ROI after residualization, a sign of poor sensitivity. However, failure to reject the null hypothesis does not indicate the absence of residual myogenic activity. In order to more rigorously test whether such EMG-corrected contrasts were significantly equivalent to artifact-free data, the Westlake-Schuirmann test (Seaman & Serlin, 1998) was employed. Commonly known as the two one-sided tests (TOST) method, a number of fields (most notably the pharmaceutical industry where it is the US Food and Drug Agency's mandated procedure for evaluating bioequivalence; U.S. Department of Health and Human Services, 2001) consider TOST the gold standard for statistically testing equivalence. The null hypothesis for TOST is that the mean difference lies outside of the range [−ε, ε], where ε is an a priori error tolerance. To reject the null (i.e., demonstrate significant equivalence) for α = .05, one must demonstrate that the 90th-percentile confidence interval of the mean difference between the artifact-free and EMG-corrected data lies completely within the interval [−ε, ε]. For this study, we set ε equal to 0.5 standard deviations of the artifact-free data. The decision not to use a more conservative criterion was dictated by inherent uncertainties about the stability of activity from block to block.
Quantification of specificity
Specificity was assessed in a manner analogous to the sensitivity. A neurogenic ROI was defined based on the OR-CR contrast. Because this effect was statistically significant at every electrode (see Results), the ROI was constructed by selecting electrodes with t-scores in the top 6th-percentile across the scalp. We then examined the degree to which each of the four correction techniques preserved alpha-band neurogenic effects using the median value in the neurogenic ROI from a double-difference t-test using contrasts with (i) purely EEG effects ([residualized OR-CR] – [OR-CR]), (ii) EMG and EEG positively covaried ([residualized OR-CT] – [OR-CR]), and (iii) EMG and EEG negatively covaried ([residualized OT-CR] – [OR-CR]). Significance in these tests indicates that EMG correction significantly altered neurogenic activity, a sign of poor sensitivity. If these results were not significant, the TOST would determine if the EMG-corrected data were significantly equivalent to artifact-free data.
As an additional means of assessing specificity, we tested whether any of the correction techniques artificially produced significant effects outside of the myogenic ROI for the pure EMG contrast (OR-OT). In the absence of any correction this contrast was associated with significantly greater alpha power in the myogenic ROI and nowhere else, therefore the presence of significant effects outside of the myogenic ROI following correction would indicate a lack of specificity. To formally test this hypothesis, Pearson’s χ2 test was used to determine if the frequency of suprathreshold (p < 0.01, uncorrected) effects outside the myogenic ROI was greater than chance, indicating poor specificity.
Results
Scalp Effects Prior to EMG-Correction
EMG effects in the alpha band
As seen in Figure 2a, the OR-OT contrast shows that the scripted muscle tensing protocol significantly increased alpha power near facial muscles at midline-frontal and right-frontal electrodes. Based on this contrast, the myogenic ROIs for sensitivity analyses (Figure 3a) were defined as frontal and right-frontal electrodes (AF7/8, AF3/4, FP2, Nz, F10), median t(16) = −3.40, p = 0.0018, η2 = 0.419. It is important to emphasize that this robust frontal EMG effect was obtained after the rejection of gross artifacts (see Method), and reflects contributions from a sustained, subtle EMG artifact that more closely resembles that which covaries with experimental manipulations of psychological variables (e.g., cognitive load, emotion).
Figure 2. Uncorrected effects in the alpha-band.

Thresholded (p < .01) effects in the alpha-band (8–13 Hz) prior to EMG-correction. A) The purely myogenic effect (OR-OT). Note the significant myogenic activation near the mastoids. B) The alpha-blocking neurogenic effect (OR-CR). Note the roughly two-fold larger effect-size compared to the purely myogenic effect. C) The effect of positively covaried EMG and alpha-blocking (OR-CT). Note the shift in the peak from the posterior midline to the left anterior region. D) The effect of negatively covaried EMG and alpha-blocking (OT-CR). Abbreviations are described in the Method section.
Figure 3. Regions of interest used for analyses of sensitivity and specificity.

Regions of interest (ROIs) used to quantify the sensitivity and specificity of EMG correction on the scalp. a) the Myogenic/EMG ROI (OR-OT contrast) used to assess sensitivity of EMG correction and b) the Neurogenic/EEG ROI (OR-CR contrast) used to assess specificity of EMG correction.
EEG effects in the alpha band
The eyes open-closed manipulation significantly attenuated alpha power at all electrodes, with peak change in power at midline parietal sites (see Figure 2b). The neurogenic ROI for specificity analyses (Figure 3b) was defined as the region of peak significance and contained midline parietal electrodes (P1/2, P3/4, PO3, CPz, Pz, and POz), median t(16) = −8.93, p < .0001, η2 = 0.833. This effect is markedly larger than the myogenic effect at frontal sites, as evinced by the two-fold larger effect size.
Covarying effects
Furthermore, in the absence of any correction, EMG notably distorted the magnitude and topography of EEG effects in the alpha band. When EEG and EMG positively covaried (OR-CT), the EEG contrast remained significant at all channels, but the peak shifted from midline parietal channels to a more central and left-frontal focus (AF7, F7 and F9; Figure 2c). In the case where EEG and EMG negatively covary (OT-CR), the effect size at the midline parietal ROI showed a non-significant reduction from t(16) = −8.93 to t(16) = −8.07 (p < .0001 for both; the significance of the reduction was t(16) = 0.55, p = 0.30). However, activation at anterior sites diminished to the point where several electrodes no longer reached conventional statistical significance, reflected by a decrease in the median ts of the myogenic ROI. Although the effect remained significant at the myogenic-ROI in the OT-CR contrast (median t drops from t(16) = −6.99, p < .0001 to t(16) = −4.61, p = .0001), the attenuation of effect size was significant t(16) = 3.30, p = 0.0023 (see Figure 2d). Such an effect would be of concern for experiments in which the EEG effect of interest lay more anterior to the regions associated with the alpha-blocking protocol used here.
Sensitivity of EMG correction on the scalp
Pure EMG effects (OR - OT contrast)
Visual inspection of the t-maps (Figure 4) indicated that the condition-wise correction technique exhibited poor sensitivity, failing to adequately remove myogenic activation. Significant median ts in the myogenic ROI after correction for each of the three EMG indices confirmed this impression (ts(16) < −2.34, ps < .04). By contrast, the epoch-wise, between-subjects and difference-score techniques did not significantly deviate from the expected values (epoch-wise |t|s(16) < 1.65, p > 0.12; between-subjects |t|s(16) < 0.41, p > 0.69; difference-score |t|s(16) < 1.74, p > 0.10). The TOST equivalence test revealed that the epoch-wise methods, between-subjects methods and difference-score methods (except when paired with the 51–69 Hz EMG band) achieved results sufficiently near the target data to be considered effective correction techniques (see Table 1, hashed-out cells denote correction schemes resulting in significant deviations from the ideal results and cells shaded red denote failure to satisfy the TOST).
Figure 4. The eyes open relaxed-tense contrast after EMG-residualization.

Thresholded (p < .01) t-scores for the eyes open relaxed-tense (OR-OT) contrast after EMG-residualization. Note the relatively poor performance of the condition-wise method.
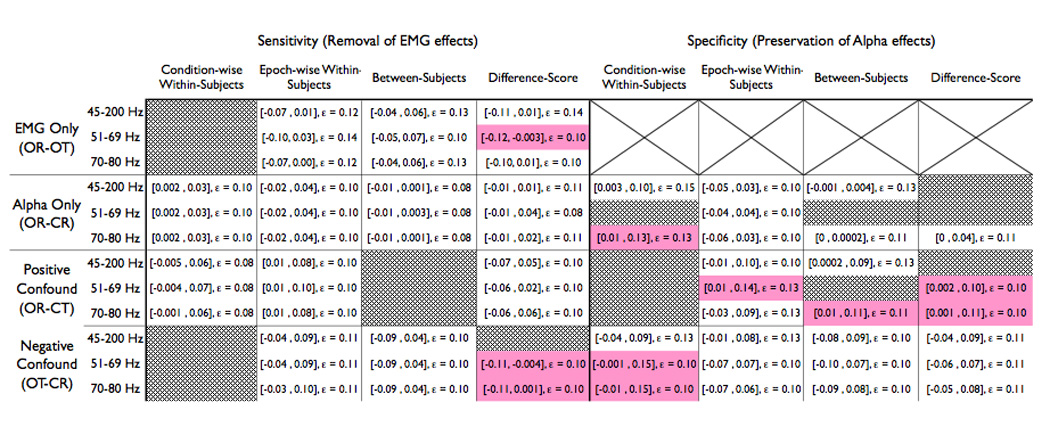
Table 1. Results from the TOST equivalency tests.
This table summarizes the results of the TOST equivalence tests for each combination of EMG-band, regression method and contrast of interest on the scalp. Each cell contains the 90th percentile confidence interval for the observed mean difference between the residualized solution and the ‘ideal’ solution (displayed in square-brackets) and the a priori error tolerance, ε. If the confidence interval is contained within the interval ±ε, one can assert that the residualized data are statistically equivalent to the ‘ideal’ clean results, indicating good specificity. If the TOST criteria is not met, indicating poor specificity, the cell is shaded red. Conditions with significant mean differences between the EMG-residualized data and the ideal data were not subjected to the TOST follow-up test, so their cells have been hashed out with gray.
 |
Pure EEG effects (OR - CR contrast)
All of the EMG-correction techniques behaved appropriately in the absence of EMG artifact, meaning that they did not generate significant deviation from the expected eyes open-closed effect (|t|s(16) < 1.87, ps > 0.09). The TOST equivalency test revealed negligible dissimilarity compared to the original OR-CR contrast (Table 1, Figure 5).
Figure 5. The relaxed eyes open-closed contrast after EMG-residualization.

Thresholded (p < .01) t-scores for eyes open-closed, relaxed (OR-CR) contrast after EMG-residualization.
Positively covarying effects (OR-CT contrast)
In this case, the between-subjects technique (Figure 6) tended to overcorrect EMG artifact, as evinced by the significant positive alpha-band deviations in the myogenic ROI following correction, ts(16) > 2.12, ps < .05. By contrast, the epoch-wise, condition-wise and difference-score methods did not exhibit significant deviations from the expected OR-CR effect within the myogenic ROI (epoch-wise ts(16) < 1.98, ps > .07; within-subjects ts(16) < 1.81, ps > .09; difference-score ts(16) < 0.09, ps > .38) and were deemed successful by the TOST equivalency test (Table 1).
Figure 6. The eyes open, relaxed minus eyes closed, tense contrast after EMG-residualization.

Thresholded (p < .01) t-scores for the positively confounded eyes open, relaxed – closed, tense (OR–CT) contrast after EMG-residualization. At a qualitative level, only the epoch-wise method recovered the topography of the neurogenic effect (cf. Figure 2b).
Negatively covarying effects (OT-CR contrast)
In this case, the condition-wise technique exhibited poor sensitivity across EMG indices (Figure 7, condition-wise ts(16) > 2.57, ps < .02), and the difference-score technique showed poor sensitivity when paired with the broad-band 45–200Hz EMG index (t(16) = −2.15, p = 0.05). However, the deviations from the expected value were non-significant for the difference-score technique when paired with either of the narrow-band EMG indices (|t|s(16) < 1.77, p > .095), the between-subjects paired with any of the EMG-regressors (|t|s(16) < 0.71, ps > 0.49), or the epoch-wise method with any of the regressor bands (|t|s(16) < 0.78, ps > 0.45). Furthermore, all of the between-subjects and epoch-wise methods achieved significance for the TOST equivalency test (Table 1).
Figure 7. The eyes open, tense minus eyes closed, relaxed contrast after EMG-residualization.

Thresholded (p < .01) t-scores for the negatively confounded eyes open, tense – closed, relaxed (OT–CR) contrast after EMG-residualization. Note the poor sensitivity of the condition-wise technique.
Specificity of EMG correction on the scalp
Pure EMG effects (OR – OT contrast)
We use a one-tailed χ2 distribution to test the frequency of spurious effects outside the myogenic ROI. The condition-wise technique exhibited poor specificity for all frequency bands, with 29 or more channels reaching significance outside of the myogenic ROI for each EMG-band, χ2 (1, n = 122) > 90.49, p < 0.0001. Similarly, the difference-score method had a substantial number of spurious effects for all EMG-bands (χ2 (1, n = 122) > 13.67, p < 0.001), as did the between-subjects technique with the 45–200Hz regressor (χ2 (1, n = 122) = 4.14, p = 0.042). However the between-subjects technique was successful with either of the narrow-bands (51–69 Hz, χ2 (1, n = 122) = 0.21, p = 0.65; 70–80 Hz, χ2 (1, n = 122) = 0.62, p = 0.43), and the epoch-wise technique succeeded with all frequency bands (45–200 Hz, χ2 (1, n = 122) = 4.49, p = 0.97; 51–69 Hz, χ2 (1, n = 122) = 6.42, p = 0.99; 70–80 Hz, χ2 (1, n = 122) = 6.42, p = 0.99).
Pure EEG effects (OR - CR contrast)
Visual inspection of the t-maps suggests that all techniques preserved the ubiquitous eyes open-closed alpha-band effect on the scalp (Figure 5). However, the median t-score from the neurogenic ROI indicated that corrections made with the narrow-band 51–69Hz EMG index for condition-wise, difference-score and between-subject methods were associated with poor specificity, as evinced by significant deviations from the expected value (ts(16) > 2.45, ps < .021). The difference-score technique paired with the broad-band EMG index showed deviation from the expected value as well (45–200 Hz, t(16) = 2.14, p = 0.05). The eight remaining techniques did not significantly deviate from the expected EEG effect at parietal sites (t(16) < 1.92, p > 0.07) and, with the exception of the condition-wise 70–80Hz method, all demonstrated significant equivalence with the artifact-free neurogenic effect (Table 1).
Positively covarying effects (OR-CT contrast)
The alpha-band neurogenic effect in the neurogenic ROI (Figure 6) was reduced for all condition-wise corrections (t(16) > 2.37, p < 0.03), the between-subjects correction paired with the 51–69 Hz EMG index, and the difference-score correction paired with the 45–200 Hz index (t(16) = 2.87, p = 0.01; t(16) = 2.21, p = 0.04, respectively). The between-subjects 45–200Hz method and epoch-wise corrections with 45–200Hz and 70–80 Hz reached significance for the TOST equivalence (Table 1). Visual inspection also revealed that several of the methods could not correct the troubling shift in topography from neurogenic foci overlying midline parietal sites to right frontal electrodes. At a qualitative level, only the epoch-wise correction properly recovered the original scalp topography of the neurogenic effect.
Negatively covarying effects (OT-CR contrast)
In this case, every combination of correction technique and EMG index preserved appropriate alpha-band activation in the neurogenic ROI (ts(16) < 1.52, ps > 0.15). The condition-wise 45–200Hz method and all epoch-wise, between-subjects, and difference-score methods demonstrated equivalence with the TOST (Table 1).
Intracerebral Effects Prior to EMG-Correction
The OR-OT contrast resulted in 87 frontal voxels reaching significance (|t|(16) > 3.250, p < 0.005 two-tailed, uncorrected; Figure 8). The OR-CR contrast resulted in widespread significance for the LORETA solutions: 2289 voxels (95.6% of the cortical gray-matter) surpassed the p < 0.005 two-tailed significance threshold. The effects of the confounded contrasts in LORETA largely mirrored those seen on the scalp. The positive confound (OR-CT) had 2341 significant voxels (97.8%) with only small patches on the right temporal pole and right orbitofrontal cortex failing to reach significance. The negatively confounded contrast (OT-CR) greatly attenuated the breadth of the effect (1617 significant voxels, 67.5% of cortex) but preserved significance in the same direction as the original OR-CR contrast bilaterally on the dorsal surface of the frontal lobe and the right-hemisphere of the parietal lobe.
Figure 8. The eyes open relaxed-tense (i.e., purely myogenic) contrast after EMG-residualization on LORETA data.
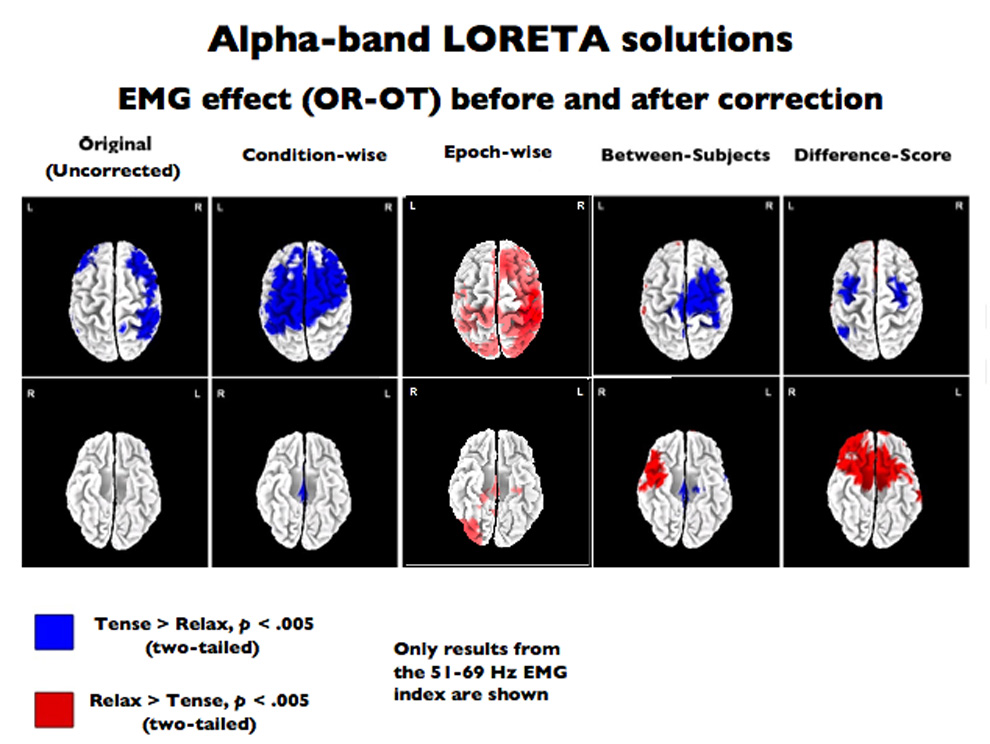
LORETA results. Thresholded (p < .005, uncorrected) eyes open relaxed-tense (OR-OT) contrast in the LORETA source-space rendered on the dorsal (top) and ventral (bottom) surfaces of a canonical brain. The left-most image depicts the uncorrected contrast (i.e., prior to EMG-correction), followed by depictions (from left to right) of the effect after residualizing with the condition-wise, epoch-wise, between- and difference-score methods using the 51–69Hz EMG-band. Results (not shown) were similar for the other EMG-bands.
Sensitivity and specificity of EMG correction on LORETA source estimates
Visual inspection of the OR-OT t-maps (Figure 8) suggested that the regression-based techniques performed poorly at voxelwise EMG correction. The between-subjects, difference-score and epoch-wise techniques appeared somewhat successful at attenuating the bilateral frontal and right parietal foci of alpha-band myogenic activation (displayed in blue), however, severe over-correction (displayed in red) was also prominent. A significant number of voxels outside of the myogenic ROI erroneously became significant after correction was performed. Between-subjects had 226–279 erroneously significant non-myogenic voxels (χ2 (1, N = 2307) > 4007.49, p < 0.0001), the difference-score technique had 384–428 significant voxels (χ2 (1, N = 2307) > 12087.33, p < 0.0001), epoch-wise had 174–555 voxels (χ2 (1, N = 2307) > 2299.75, p < 0.0001), and condition-wise technique had 353–412 voxels, (χ2 (1, N = 2307) > 10159.02, p < 0.0001). Because all of these correction techniques resulted in large errors on the simple EMG-only OR-OT contrasts, further tests of sensitivity and specificity were not performed because the magnitude of failure during this basic contrast was sufficient to preclude any endorsement of these methods.
Discussion
Correcting EMG Artifact on the Scalp: Summary and Recommendations
Even after rejecting epochs contaminated by gross EMG artifacts, low-intensity clenching of the facial musculature significantly increased spectral power in the alpha band at frontal electrodes on the scalp. When this comparatively subtle myogenic artifact covaried with alpha blocking, manipulated by opening and closing the eyes, we found that it altered the magnitude and topography of the alpha-blocking effect despite the two-fold larger effect size for the neurogenic effect. Taken together, these observations underscore the hazards of making inferences, even in lower bands of the EEG, in the presence of EMG. Although we did not formally examine the influence of EMG on individual differences in EEG, one should assume that myogenic artifact could have serious consequences for such analyses as well.
Additional concern stems from the asymmetrical distribution of myogenic artifact observed in this study. Although the asymmetry of the facial musculature’s action is well established (Davidson, Shackman & Maxwell, 2004; Zhou & Hu, 2004; Borod, Haywood, & Koff, 1997; Ekman, Hager, & Friesen, 1981), this study emphasizes the danger of computing EEG asymmetry or laterality metrics without giving consideration to the effects of myogenic artifact. Given the prevalence of studies employing alpha-band asymmetry scores at anterior electrodes to study the neural substrates of emotional processing, it is essential that further study explore the extent to which asymmetry scores are susceptible to EMG and which residualization methods are appropriate for removing contamination.
As shown by the summary in Table 2, every technique except the novel epoch-wise method failed at least one test of specificity or sensitivity. The condition-wise residualization routinely shows poor sensitivity for the EMG-only (OR-OT) and negatively confounded (OT-CR) contrasts and poor specificity for the EMG-only (OR-OT) and positively confounded (OR-CT) contrasts. Between-subjects residualization evinced poor sensitivity in the positively confounded (OR-CT) contrast and poor specificity in the EMG-only contrast (OR-OT). The difference-score method had insufficient sensitivity in the negatively confounded contrast (OT-CR) and inadequate specificity for all other conditions (OR-OT, OR-CT, and OR-CR)5.
Table 2. Summary of specificity and sensitivity.
Summary of conclusions: sensitivity and specificity. A ‘good’ rating (+) denotes that the EMG-residualized data in the ROI of interest are equivalent to the expected “ideal” results (i.e., high sensitivity for removing EMG artifact from the myogenic ROI, high specificity for preserving alpha-band activity in the neurogenic ROI), whereas a ‘poor’ rating (−) is achieved if the residualized data in the ROI significantly deviate from the expected results. If the method does not satisfy either of these criteria, it is marked as ‘indeterminate’ (o). The OR-OT contrast (eyes open, relaxed minus tense) used a different method for addressing specificity that employed a chi-squared test to determine whether a non-trivial number of channels reach significance outside of the EMG-ROI after EMG-correction, so this region is shaded to signal this difference.
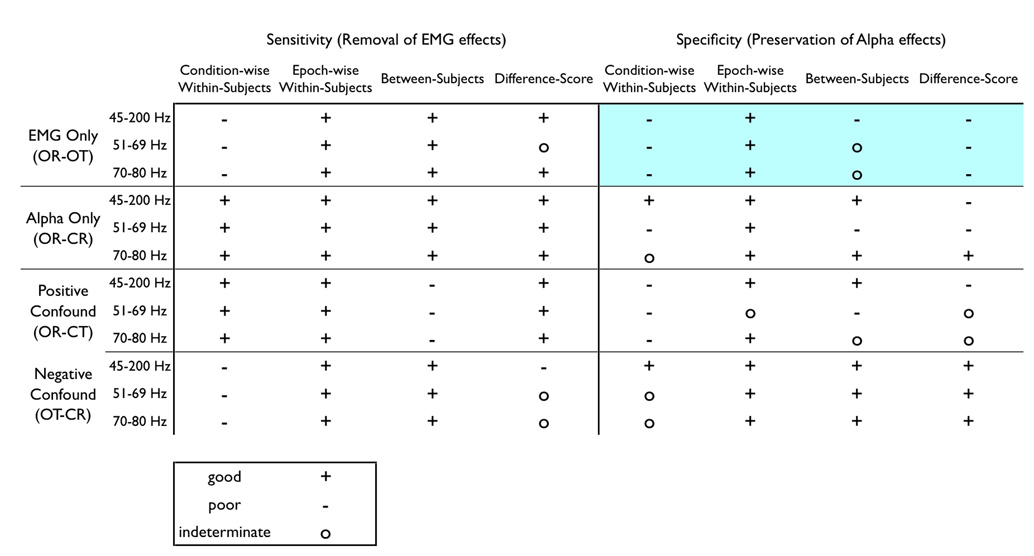 |
Although the choice of correction technique has a profound influence on one's results, the impact of EMG index is less easily summarized. The choice of EMG index had minimal influence in the sensitivity of the correction techniques, with the exception of the difference-score method. The choice of EMG index had a more substantial impact on specificity of the correction, but the pattern defies any concise summary (Table 2). If one constrains choices of EMG index to the epoch-wise method because of its general success, the 51–69 Hz band cannot be recommended due to an indeterminate level of specificity in the case of positively confounded neurogenic and myogenic effects. Therefore, we recommend using the epoch-wise method paired with the 45–200Hz broad-band or 70–80Hz narrow-band EMG indices for correction of alpha-band EEG6; The utility of this method for removing EMG contamination from higher-frequency EEG bands (e.g. gamma) requires further examination.
Correcting EMG artifact in LORETA solutions: Summary and recommendations
Somewhat unexpectedly, the results of residualization on LORETA solutions differed greatly from the results on the scalp. The condition-wise, between-subjects and difference-score residualization methods each displayed an extreme lack of sensitivity and propensity for inflating artifact throughout the solution space, thereby precluding any endorsement. Even the epoch-wise method that performed admirably on the scalp was subject to errors, namely widespread over-correction of artifact. However, these poor performances do not necessarily condemn the use of residualization techniques on source-localized data altogether – rather the problem may reflect an inability of the source estimation algorithm to properly localize data in the presence of artifact. EMG-contaminated data is a mixture of intra-cranial (neurogenic) and extra-cranial (myogenic) sources. Because the skull is positioned differently relative to these sources the relationships mapping intra-cranial dipoles to scalp electrodes would show marked differences from the mapping of extra-cranial dipoles to electrodes. Therefore, forcing purely intra-cranial dipole-models to account for a mixture of intra- and extra-cranial sources could severely warp the solution and render the true neurogenic solution unrecoverable by regression. Removing extra-cranial sources from the data prior to source-estimation or explicitly building extra-cranial dipoles into the solution space may attenuate this form of corruption during source localization.
Future Challenges
Correcting artifact on the scalp
EMG artifacts extend sufficiently low in the frequency domain to contaminate alpha-band activity, so any study that explicitly (i.e. directed facial actions or verbal responses) or implicitly (i.e. changes in emotion or increased cognitive effort) induces muscle activity must be wary of artifact throughout the entire EEG spectrum. Moreover, even when emotion is not explicitly manipulated, individual differences in affective style may well be associated with variations in patterns of dispositional facial muscle activity. Historically, a wide variety of residualization techniques have been used to correct these artifacts, but our findings demonstrate that the previously unused within-subjects epoch-wise residualization is far superior to more traditional methods in terms of sensitivity and specificity. Additionally, we find that variation in the choice of EMG index in the extant literature should not be of great concern.
The results also suggest that the more traditional between-subjects methods are acceptable when EMG is negatively confounded with neurogenic experimental effects. This indicates that the inferences drawn by studies that used this method to correct what was likely negatively covarying myogenic and neurogenic activity (e.g., Gasser et al., 2005; Coan & Allen, 2003) are likely to be sound. Although future researchers may have strong a priori hypotheses about the relationship between myogenic signal and other experimental effects that would allow the use of the simpler between subjects method, the epoch-wise method should still be used to ensure proper correction. An additional benefit of using a within-subjects technique is that it allows the topography of EMG to be tailored to each subject, allowing individual difference in the distribution of the artifact to be properly modeled and removed. Conversely, our results underscore the danger in using the condition-wise or difference-score methods. Although these techniques appear to be reasonable and offer tempting computational simplifications, they do not perform at an acceptable level.
There are potential improvements that could render all of the residualization methods described in this paper more useful. First, a single parameter cannot completely characterize EMG; the spectral-composition of EMG power has been shown to vary as a function of muscle group, contraction intensity (Goncharova et al, 2003), and fatigue (Chung et al., 2002). Using a single value to parameterize EMG power is an over-simplification that could be overcome by using a multivariate regression model. Defining EMG with several frequency-bands would permit the use of hierarchical-, multiple-, or non-linear regression methods that may better represent these nuanced relations between changes in muscle activity and spectral power in EEG bands of interest. Secondly, studies have shown that meaningful phase relationships exist between non-facial EMG and EEG signals originating in motor cortex (McKeown & Ratdke, 2001), suggesting that the inclusion of phase or coherence information into the residualization methods could potentially improve the seperability of EEG and EMG signals.
Intracerebral modeling
Our results also indicate that not only can EMG artifact have disastrous consequences for the source-estimation of spectral EEG, but also that none of the residualization methods assessed adequately corrects for this influence. Although it is tempting to simply extend the electrode-wise residualization technique to operate on a voxel-wise level, the technique did not prove effective. Future research needs to develop source-estimation algorithms that are robust to EMG contamination and/or methods to remove EMG prior to localization. Such problems are likely to be limited to investigations that rely upon estimates of spectral power. Studies that localize event-related potentials (ERPs) and time-domain data should be relatively robust to the pernicious consequences of EMG artifact, however it would be beneficial for future studies to quantify the effects of myogenic artifact on source-estimates of time-domain data.
One potential approach for creating source-estimates that are robust to EMG contamination would be expanding the source-space to include extra-cranial dipoles. Using a suitably high resolution structural magnetic resonance image (MRI), one could generate a finite element model (FEM) or boundary element model (BEM) of the cranium that explicitly defined muscle compartments. Using this model, source solutions would be permitted to localize to both the usual brain compartments (e.g., gray matter) and the added muscle compartment, potentially allowing myogenic activity to properly localize to its myogenic generators7. Conceptually similar methods have proven feasible and effective for correcting ocular artifacts (Berg & Scherg, 1991).
As an alternative to developing an EMG-robust source estimation method, techniques to remove EMG from the time-series data or cross-spectral matrices prior to the creation of a source-estimate could be developed. The regression techniques described in this study are incapable of cleaning data prior to source-localization because they discard phase information and rely upon estimates of spectral power, preventing the calculation of cross-spectral matrices used to create source-estimates of spectral data. However, independent component analysis (ICA) has proven successful for removing ocular artifacts from time-series data and has shown potential for removing EMG (Jung et al., 2000; Delrome, Sejnowski & Makeig, 2007; Fitzgibbon et al., 2007). This method operates by defining scalp-distributions (i.e. ‘components’) with statistically independent time-series that the experimenter classifies as artifactual or authentic and then uses to regress artifact out of the time-series data. However, investigations of the validity of this technique used small sample sizes (ns < 4: Fitzgibbon et al., 2007; Jung et al., 2000) or simulated data that synthesized and ‘injected’ myogenic signals (Fitzgibbon et al, 2007; Delorme et al., 2007). Such simulations enforce a degree of stereotypy across the scalp and individuals simply not present in real data. Moreover, simulations necessitate strong assumptions of linearity and additivity that bias such experiments to favor correction methods that make similar assumptions.
We firmly believe that ICA-based methods have great potential for EMG correction; however there is a non-trivial amount of work that needs to be done before ICA can be readily applied to the correction of EMG with an adequate degree of confidence in its sensitivity and specificity. In particular, EMG does not necessarily manifest itself in easily discernable components when applied to high-density (128-channel) EEG recordings (Mammone & Morabito, in press). Moreover, preliminary observations Greischar, Shackman, McMenamin & Davidson, unpublished) in our laboratory suggest that some algorithms may work well for low- but not high-density montages (e.g. De Clercq, Vergult, Vanrumste, Van Paesschen & Van Huffel, 2006).
Conclusions
Researchers must remain vigilant for myographic contamination of data and know which correction techniques are appropriate. Even subtle EMG artifact can systematically alter the topography of genuine neurogenic effects, attenuate the magnitude of real effects, and generate spurious ones. Inappropriate correction schemes can exacerbate errors while providing a false sense of confidence in the solution. The present study has demonstrated that the novel within-subjects epoch-wise residualization outperforms traditional power-residualization methods on the scalp, however none of the methods we tested succeeded when applied to LORETA intracerebral source-estimates of spectral power. Our ‘scaling-up’ of scalp-based regression to perform voxel-wise correction is an example of a superficially sound method that fails when rigorously investigated. Although our demonstration of a method’s failure does not advance the development of artifact correction methods per se, it serves to simultaneously motivate the development of advanced artifact-correction methodology and illustrate the consequences of careless source-estimation. Independent components analysis (ICA) is a promising technique that may allow artifacts to be corrected prior to source localization, however it’s utility for removing EMG has yet to be rigorously validated and a straightforward reliable protocol for it’s implementation has not been published. Given the rising popularity of EEG source-localization (e.g., http://www.fil.ion.ucl.ac.uk/spm/software/spm5/) and the power of EMG artifacts to corrupt data and source-estimates, the development of a method for removing myogenic artifact from source-estimated data is a crucial challenge for future research.
Acknowledgements
We gratefully thank Andrew Fox for his feedback on early drafts of the paper. This project was supported by National Institutes of Health grant R01-MH43454 to R.J.D.
Footnotes
Admittedly, this sampling rate and anti-aliasing filter is not ideal for the recording of high-frequency EMG effects. The particular parameters used for our anti-aliasing filter allow the possibility of aliasing effects from high-frequency EMG effects. We would recommend that future studies of myogenic artifact employ a high sampling rate (i.e. 1000+ Hz) and employ the “Engineer’s Nyquist” for the anti-aliasing filter to compensate for non-zero roll-off in the filter.
LORETA has been validated using simulations (Grova et al., 2006; Pascual-Marqui, Esslen, Kochi, & Lehmann, 2002; Phillips, Rugg, & Friston, 2002; Trujillo-Barreto, Aubert-Vazquez, & Penny, 2008; Yao & Dewald, 2005), verified epileptic foci (Lantz et al., 1997; Worrell et al., 2000; Zumsteg, Friedman, Wennberg, & Wieser, 2005; Zumsteg, Wennberg, Treyer, Buck, & Wieser, 2005), intra-cerebral recordings _(Bai, Towle, He, & He, 2007; Seeck et al., 1998; Zumsteg, Friedman et al., 2005), positron emission tomography _(Pizzagalli et al., 2004; Zumsteg, Wennberg et al., 2005), and functional magnetic resonance imaging (Bai et al., 2007; Duru et al., 2007; Eryilmaz, Duru, Parlak, Ademoglu, & Demiralp, 2007; Meltzer, Negishi, Mayes, & Constable, 2007; Mulert et al., 2004; Vitacco, Brandeis, Pascual-Marqui, & Martin, 2002).
LORETA requires no subjective a priori assumptions about the number or orientation of sources (cf.Miltner, Braun, Johnson, Simpson & Ruchkin, 1994; Kobayashi, Yoshinaga, Ohtsuka & Gotman, 2005) and provides a more accurate localization of intracerebral sources than dipolar methods under at least some conditions (Fuchs, Wagner, Kohler & Wischmann, 1999; Yao & Dewald, 2005). Unlike dipole methods, the proportion of variance in the scalp distribution predicted by a LORETA solution always approximates unity.
Three other potential EMG indices (20–80 Hz, 40–100 Hz, 100–160 Hz) were assessed. The results did not differ substantively from those of the three indices reported here and so are omitted from this report.
It is unlikely that the significant effects seen here after correction reflect a modulation of motor-cortex activity due to the tensing of facial musculature. An extensive examination of the regions involved in the generation of facial expressions by Morecraft, Stilwell-Morecraft and Rossing (2004) implicates the mesial aspects of motor cortex (area 6), and the topography of the OR-OT alpha-band effect (Figure 2a) is not consistent with such a generator. Furthermore, the direction of the effects seen after correction of EMG is in the opposite direction than would be predicted (i.e., the contrast reveals relatively more alpha, indicative of reduced activation, for the muscle tensed conditions which would correspond to a decrease in neural activation).
The interaction between the 60Hz alternating current noise and optimal index for EMG is unknown; it is likely that locales with 50Hz alternating current could find an alternate index of EMG activity that performs optimally.
Additional problems might arise if this method applied the LORETA algorithm because the minimum-Laplacian constraint is no longer an appropriate, theoretically motivated constraint. While this assumption is appropriate for cortical solutions, it is unjustified for source spaces that contain a mixture of cortical and muscular generators. Luckily, there are alternative source-estimation techniques that do not employ the minimum-Laplacian constraint, such as the sLORETA algorithm (Pascual-Marqui, 2002).
Contributor Information
Brenton W. McMenamin, University of Minnesota - Twin Cities
Alexander J. Shackman, Laboratory for Affective Neuroscience, Waisman Laboratory for Brain Imaging and Behavior, HealthEmotions Research Institute, University of Wisconsin – Madison
Jeffrey S. Maxwell, Laboratory for Affective Neuroscience, Waisman Laboratory for Brain Imaging and Behavior, HealthEmotions Research Institute, University of Wisconsin – Madison.
Lawrence L. Greischar, Laboratory for Affective Neuroscience, Waisman Laboratory for Brain Imaging and Behavior, HealthEmotions Research Institute, University of Wisconsin – Madison
Richard J. Davidson, Laboratory for Affective Neuroscience, Waisman Laboratory for Brain Imaging and Behavior, HealthEmotions Research Institute, University of Wisconsin – Madison
References
- Allen JJ, Coan JA, Nazarian M. Issues and assumptions on the road from raw signals to metrics of frontal EEG asymmetry in emotion. Biological psychology. 2004;67(1–2):183–218. doi: 10.1016/j.biopsycho.2004.03.007. [DOI] [PubMed] [Google Scholar]
- Bai X, Towle VL, He EJ, He B. Evaluation of cortical current density imaging methods using intracranial electrocorticograms and functional MRI. Neuroimage. 2007;35(2):598–608. doi: 10.1016/j.neuroimage.2006.12.026. [DOI] [PMC free article] [PubMed] [Google Scholar]
- Barlow JS. EMG artifact minimization during clinical EEG recordings by special analog filtering. Electroencephalography and clinical neurophysiology. 1984;58(2):161–174. doi: 10.1016/0013-4694(84)90030-0. [DOI] [PubMed] [Google Scholar]
- Berg P, Scherg M. Dipole models of eye movements and blinks. Electroencephalography and clinical neurophysiology. 1991;79(1):36–44. doi: 10.1016/0013-4694(91)90154-v. [DOI] [PubMed] [Google Scholar]
- Berger H. Uber das elektroenkephalogramm des Menschen IV. Archiv fur Psychiatrie und Nervenkrankheiten. 1932;97:6–26. [Google Scholar]
- Borden JW, Peterson DR, Jackson EA. The beck anxiety inventory in nonclinical samples: Initial psychometric properties. Journal of Psychopathology and Behavioral Assessment. 1991;13(4):345–356. [Google Scholar]
- Borod JC, Haywood CS, Koff E. Neuropsychological aspects of facial asymmetry during emotional expression: A review of the normal adult literature. Neuropsychology review. 1997;7(1):41–60. doi: 10.1007/BF02876972. [DOI] [PubMed] [Google Scholar]
- Bradley MM, Codispoti M, Cuthbert BN, Lang PJ. Emotion and motivation I: Defensive and appetitive reactions in picture processing. Emotion. 2001;1(3):276–298. [PubMed] [Google Scholar]
- Bullmore ET, Brammer MJ, Rabe-Hesketh S, Curtis VA, Morris RG, Williams SC, et al. Methods for diagnosis and treatment of stimulus-correlated motion in generic brain activation studies using fMRI. Human brain mapping. 1999;7(1):38–48. doi: 10.1002/(SICI)1097-0193(1999)7:1<38::AID-HBM4>3.0.CO;2-Q. [DOI] [PMC free article] [PubMed] [Google Scholar]
- Chung JW, Kim C, McCall WD., Jr Effect of sustained contraction on motor unit action potentials and EMG power spectrum of human masticatory muscles. Journal of dental research. 2002;81(9):646–649. doi: 10.1177/154405910208100914. [DOI] [PubMed] [Google Scholar]
- Coan JA, Allen JJB. Varieties of emotional experience during voluntary emotional facial expressions. Annals of the New York Academy of Sciences. 2003;1000(1):375. doi: 10.1196/annals.1280.034. [DOI] [PubMed] [Google Scholar]
- Coan JA, Allen JJ, Harmon-Jones E. Voluntary facial expression and hemispheric asymmetry over the frontal cortex. Psychophysiology. 2001;38(6):912–925. doi: 10.1111/1469-8986.3860912. [DOI] [PubMed] [Google Scholar]
- Cohen BH, Davidson RJ, Senulis JA, Saron CD, Weisman DR. Muscle tension patterns during auditory attention. Biological psychology. 1992;33(2–3):133–156. doi: 10.1016/0301-0511(92)90028-s. [DOI] [PubMed] [Google Scholar]
- Collins DL, Neelin P, Peters TM, Evans AC. Automatic 3D intersubject registration of MR volumetric data in standardized talairach space. Journal of computer assisted tomography. 1994;18(2):192–205. [PubMed] [Google Scholar]
- Davidson RJ. EEG measures of cerebral asymmetry: Conceptual and methodological issues. The International journal of neuroscience. 1988;39(1–2):71–89. doi: 10.3109/00207458808985694. [DOI] [PubMed] [Google Scholar]
- Davidson RJ, Ekman P, Saron CD, Senulis JA, Friesen WV. Approach-withdrawal and cerebral asymmetry: Emotional expression and brain physiology I. Journal of personality and social psychology. 1990;58(2):330–341. [PubMed] [Google Scholar]
- Davidson RJ, Jackson DC, Larson CL. Handbook of psychophysiology. 2nd ed. Cambridge University Press; 2000. Human electroencephalography; pp. 27–52. [Google Scholar]
- Davidson RJ, Marshall JR, Tomarken AJ, Henriques JB. While a phobic waits: Regional brain electrical and autonomic activity in social phobics during anticipation of public speaking. Biological psychiatry. 2000;47(2):85–95. doi: 10.1016/s0006-3223(99)00222-x. [DOI] [PubMed] [Google Scholar]
- Davidson RJ, Shackman AJ, Maxwell JS. Asymmetries in face and brain related to emotion. Trends in cognitive sciences. 2004;8(9):389–391. doi: 10.1016/j.tics.2004.07.006. [DOI] [PubMed] [Google Scholar]
- De Clercq W, Vergult A, Vanrumste B, Van Paesschen W, Van Huffel S. Cannonical correlation analysis applied to remove muscle artifacts from the electroenchephalogram. IEEE transactions on biomedical engineering. 2006;53(121):2583–2587. doi: 10.1109/TBME.2006.879459. [DOI] [PubMed] [Google Scholar]
- Delorme A, Makeig S. EEGLAB: An open source toolbox for analysis of single-trial EEG dynamics including independent component analysis. Journal of neuroscience methods. 2004;134(1):9–21. doi: 10.1016/j.jneumeth.2003.10.009. [DOI] [PubMed] [Google Scholar]
- Dien J. Issues in the application of the average reference: Review, critiques, and recommendations. Behavior Research Methods, Instruments, & Computers. 1998;30(1):34–43. [Google Scholar]
- Dimberg U, Thunberg M, Elmehed K. Unconscious facial reactions to emotional facial expressions. Psychological science : a journal of the American Psychological Society / APS. 2000;11(1):86–89. doi: 10.1111/1467-9280.00221. [DOI] [PubMed] [Google Scholar]
- Duru AD, Eryilmaz H, Emir U, Bayraktaroglu Z, Demiralp T, Ademoglu A. Implementation of low resolution electro-magnetic tomography with FMRI statistical maps on realistic head models. Conf Proc IEEE Eng Med Biol Soc. 2007:5239–5242. doi: 10.1109/IEMBS.2007.4353523. [DOI] [PubMed] [Google Scholar]
- Ekman P, Hager JC, Friesen WV. The symmetry of emotional and deliberate facial actions. Psychophysiology. 1981;18(2):101–106. doi: 10.1111/j.1469-8986.1981.tb02919.x. [DOI] [PubMed] [Google Scholar]
- Eryilmaz HH, Duru AD, Parlak B, Ademoglu A, Demiralp T. Neuroimaging of event related brain potentials (ERP) using fMRI and dipole source reconstruction. Conf Proc IEEE Eng Med Biol Soc. 2007:3384–3387. doi: 10.1109/IEMBS.2007.4353057. [DOI] [PubMed] [Google Scholar]
- Evans AC, Collins DL, Mills SR, Brown ED, Kelly RL, Peters TM. 3D statistical neuroanatomical models from 305 MRI volumes; Nuclear Science Symposium and Medical Imaging Conference; 1993. pp. 1813–1817. 1993 IEEE Conference Record. [Google Scholar]
- Fitzgibbon SP, Powers DM, Pope KJ, Clark CR. Removal of EEG noise and artifact using blind source separation. Journal of clinical neurophysiology : official publication of the American Electroencephalographic Society. 2007;24(3):232–243. doi: 10.1097/WNP.0b013e3180556926. [DOI] [PubMed] [Google Scholar]
- Frei E, Gamma A, Pascual-Marqui R, Lehmann D, Hell D, Vollenweider FX. Localization of MDMA-induced brain activity in healthy volunteers using low resolution brain electromagnetic tomography (LORETA) Human brain mapping. 2001;14(3):152–165. doi: 10.1002/hbm.1049. [DOI] [PMC free article] [PubMed] [Google Scholar]
- Fuchs M, Wagner M, Kohler T, Wischmann HA. Linear and nonlinear current density reconstructions. Journal of clinical neurophysiology : official publication of the American Electroencephalographic Society. 1999;16(3):267–295. doi: 10.1097/00004691-199905000-00006. [DOI] [PubMed] [Google Scholar]
- Gasser T, Bacher P, Mocks J. Transformations towards the normal distribution of broad band spectral parameters of the EEG. Electroencephalography and clinical neurophysiology. 1982;53(1):119–124. doi: 10.1016/0013-4694(82)90112-2. [DOI] [PubMed] [Google Scholar]
- Gasser T, Schuller JC, Gasser US. Correction of muscle artefacts in the EEG power spectrum. Clinical neurophysiology : official journal of the International Federation of Clinical Neurophysiology. 2005;116(9):2044–2050. doi: 10.1016/j.clinph.2005.06.002. [DOI] [PubMed] [Google Scholar]
- Goncharova II, McFarland DJ, Vaughan TM, Wolpaw JR. EMG contamination of EEG: Spectral and topographical characteristics. Clinical neurophysiology : official journal of the International Federation of Clinical Neurophysiology. 2003;114(9):1580–1593. doi: 10.1016/s1388-2457(03)00093-2. [DOI] [PubMed] [Google Scholar]
- Gotman J, Ives JR, Gloor P. Frequency content of EEG and EMG at seizure onset: Possibility of removal of EMG artefact by digital filtering. Electroencephalography and clinical neurophysiology. 1981;52(6):626–639. doi: 10.1016/0013-4694(81)91437-1. [DOI] [PubMed] [Google Scholar]
- Gratton G. Ealing with artifacts: The EOG contamination of the event-related brain. Behavior research methods, instruments & computers. 1998;30(1):44–53. [Google Scholar]
- Greischar LL, Burghy CA, van Reekum CM, Jackson DC, Pizzagalli DA, Mueller C, et al. Effects of electrode density and electrolyte spreading in dense array electroencephalographic recording. Clinical Neurophysiology. 2004;115(3):710–720. doi: 10.1016/j.clinph.2003.10.028. [DOI] [PubMed] [Google Scholar]
- Gray H. In: Anatomy of the human body. 20th ed. Lewis WH, editor. Philadelphia: Lea & Febiger; 1918. [Google Scholar]
- Grova C, Daunizeau J, Lina JM, Benar CG, Benali H, Gotman J. Evaluation of EEG localization methods using realistic simulations of interictal spikes. Neuroimage. 2006;29(3):734–753. doi: 10.1016/j.neuroimage.2005.08.053. [DOI] [PubMed] [Google Scholar]
- Jung TP, Makeig S, Humphries C, Lee TW, McKeown MJ, Iragui V, et al. Removing electroencephalographic artifacts by blind source separation. Psychophysiology. 2000;37(2):163–178. [PubMed] [Google Scholar]
- Kobayashi K, Yoshinaga H, Ohtsuka Y, Gotman J. Dipole modeling of epileptic spikes can be accurate or misleading. Epilepsia. 2005;46(3):397–408. doi: 10.1111/j.0013-9580.2005.31404.x. [DOI] [PubMed] [Google Scholar]
- Lantz G, Michel CM, Pascual-Marqui RD, Spinelli L, Seeck M, Seri S, et al. Extracranial localization of intracranial interictal epileptiform activity using LORETA (Low Resolution Electromagnetic Tomography) Electroenceph. Clin. Neurophysiol. 1997;102:414–442. doi: 10.1016/s0921-884x(96)96551-0. [DOI] [PubMed] [Google Scholar]
- Laufs H. Endogenous brain oscillations and related networks detected by surface EEG-combined fMRI. Human Brain Mapping. doi: 10.1002/hbm.20600. (in press) [DOI] [PMC free article] [PubMed] [Google Scholar]
- Lee S, Buchsbaum MS. Topographic mapping of EEG artifacts. Clinical EEG (electroencephalography) 1987;18(2):61–67. [PubMed] [Google Scholar]
- Lutz A, Greischar LL, Rawlings NB, Ricard M, Davidson RJ. Long-term meditators self-induce high-amplitude gamma synchrony during mental practice. Proceedings of the National Academy of Sciences. 2004;101(46):16369–16373. doi: 10.1073/pnas.0407401101. [DOI] [PMC free article] [PubMed] [Google Scholar]
- Mammone N, Morabito FC. Enhanced automatic artifact detection based on independent component analsis and Renyi’s entropy. Neural networks. 2008 doi: 10.1016/j.neunet.2007.09.020. In press. [DOI] [PubMed] [Google Scholar]
- McKeown MJ, Radtke R. Phasic and tonic coupling between EEG and EMG demonstrated with independent component analysis. Journal of clinical neurophysiology : official publication of the American Electroencephalographic Society. 2001;18(1):45–57. doi: 10.1097/00004691-200101000-00009. [DOI] [PubMed] [Google Scholar]
- Meltzer JA, Negishi M, Mayes LC, Constable RT. Individual differences in EEG theta and alpha dynamics during working memory correlate with fMRI responses across subjects. Clinical Neurophysiology. 2007;118:2419–2436. doi: 10.1016/j.clinph.2007.07.023. [DOI] [PMC free article] [PubMed] [Google Scholar]
- Miltner W, Braun C, Johnson R, Jr, Simpson GV, Ruchkin DS. A test of brain electrical source analysis (BESA): A simulation study. Electroencephalography and clinical neurophysiology. 1994;91(4):295–310. doi: 10.1016/0013-4694(94)90193-7. [DOI] [PubMed] [Google Scholar]
- Morecraft RJ, Stilwell-Morecraft KS, Rossing WR. The motor cortex and facial expression: New insights from neuroscience. Neurologist. 2004;10(5):235–249. doi: 10.1097/01.nrl.0000138734.45742.8d. [DOI] [PubMed] [Google Scholar]
- Mulert C, Jager L, Schmitt R, Bussfeld P, Pogarell O, Moller HJ, et al. Integration of fMRI and simultaneous EEG: Towards a comprehensive understanding of localization and time-course of brain activity in target detection. NeuroImage. 2004;22(1):83–94. doi: 10.1016/j.neuroimage.2003.10.051. [DOI] [PubMed] [Google Scholar]
- Oakes TR, Pizzagalli DA, Hendrick AM, Horras KA, Larson CL, Abercrombie HC, et al. Functional coupling of simultaneous electrical and metabolic activity in the human brain. Human brain mapping. 2004;21(4):257–270. doi: 10.1002/hbm.20004. [DOI] [PMC free article] [PubMed] [Google Scholar]
- Ohrbach R, Blascovich J, Gale EN, McCall WD, Dworkin SF. Psychophysiological assessment of stress in chronic pain: Comparisons of stressful stimuli and of response systems. Journal of dental research. 1998;77(10):1840–1850. doi: 10.1177/00220345980770101201. [DOI] [PubMed] [Google Scholar]
- Onton J, Westerfield M, Townsend J, Makeig S. Imaging human EEG dynamics using independent component analysis. Neuroscience and biobehavioral reviews. 2006;30(6):808–822. doi: 10.1016/j.neubiorev.2006.06.007. [DOI] [PubMed] [Google Scholar]
- Pascual-Marqui RD, Michel CM, Lehmann D. Low resolution electromagnetic tomography: A new method for localizing electrical activity in the brain. International journal of psychophysiology : official journal of the International Organization of Psychophysiology. 1994;18(1):49–65. doi: 10.1016/0167-8760(84)90014-x. [DOI] [PubMed] [Google Scholar]
- Pascual-Marqui RD. Review of methods for solving the EEG inverse problem. International Journal of Bioelectromagnetism. 1999;1(1):75–86. [Google Scholar]
- Pascual-Marqui RD, Lehmann D, Koenig T, Kochi K, Merlo MCG, Hell D, et al. Low resolution brain electromagnetic tomography LORETA functional imaging in acute, neuroleptic-naive, first-episode, productive schizophrenia. Psychiatry Research: Neuroimaging. 1999;90(3):169–179. doi: 10.1016/s0925-4927(99)00013-x. [DOI] [PubMed] [Google Scholar]
- Pascual-Marqui RD. Standardized low-resolution brain electromagnetic tomography (sLORETA): Technical details. Methods and findings in experimental and clinical pharmacology. 2002;24 Suppl D:5–12. [PubMed] [Google Scholar]
- Pascual-Marqui RD, Esslen M, Kochi K, Lehmann D. Functional imaging with low-resolution brain electromagnetic tomography (LORETA): a review. Methods Find Exp Clin Pharmacol. 2002;24 Suppl C:91–95. [PubMed] [Google Scholar]
- Perrin F, Pernier J, Bertrand O, Echallier JF. Spherical splines for scalp potential and current density mapping. Electroencephalography and clinical neurophysiology. 1989;72(2):184–187. doi: 10.1016/0013-4694(89)90180-6. [DOI] [PubMed] [Google Scholar]
- Phillips C, Rugg MD, Friston KJ. Systematic regularization of linear inverse solutions of the EEG source localization problem. NeuroImage. 2002;17(1):287–301. doi: 10.1006/nimg.2002.1175. [DOI] [PubMed] [Google Scholar]
- Phillips C, Rugg MD, Friston KJ. Anatomically informed basis functions for EEG source localization: combining functional and anatomical constraints. Neuroimage. 2002;16(3 Pt 1):678–695. doi: 10.1006/nimg.2002.1143. [DOI] [PubMed] [Google Scholar]
- Pizzagalli DA. Electroencephalography and High-Density Electrophysiological Source Localization. In: Cacioppo JT, Tassinaru LG, Berntson GG, editors. Handbook of Psychophysiology. 3rd Edition. Cambridge, U.K: Cambridge University Press; 2007. pp. 56–84. [Google Scholar]
- Pizzagalli DA, Oakes TR, Davidson RJ. Coupling of theta activity and glucose metabolism in the human rostral anterior cingulate cortex: An EEG/PET study of normal and depressed subjects. Psychophysiology. 2003;40(6):939–949. doi: 10.1111/1469-8986.00112. [DOI] [PubMed] [Google Scholar]
- Pizzagalli DA, Oakes TR, Fox AS, Chung MK, Larson CL, Abercrombie HC, et al. Functional but not structural subgenual prefrontal cortex abnormalities in melancholia. Molecular psychiatry. 2004;9:393–405. doi: 10.1038/sj.mp.4001501. [DOI] [PubMed] [Google Scholar]
- Pivik RT, Broughton RJ, Coppola R, Davidson RJ, Fox N, Nuwer MR. Guidelines for the recording and quantitative analysis of electroencephalographic activity in research contexts. Psychophysiology. 1993;30(6):547–558. doi: 10.1111/j.1469-8986.1993.tb02081.x. [DOI] [PubMed] [Google Scholar]
- Putnam KM, Pizzagalli DA, Gooding DC, Kalin NH, Davidson RJ. Neural activity and diurnal variation of cortisol: Evidence from brain electrical tomography analysis and relevance to anhedonia. Psychophysiology. doi: 10.1111/j.1469-8986.2008.00697.x. (In press) in press. [DOI] [PMC free article] [PubMed] [Google Scholar]
- Sadasivan PK, Dutt DN. Use of finite wordlength FIR digital filter structures with improved magnitude and phase characteristics for reduction of muscle noise in EEG signals. Medical & biological engineering & computing. 1995;33(3):306–312. doi: 10.1007/BF02510504. [DOI] [PubMed] [Google Scholar]
- Schellberg D, Besthorn C, Klos T, Gasser T. EEG power and coherence while male adults watch emotional video films. International journal of psychophysiology : official journal of the International Organization of Psychophysiology. 1990;9(3):279–291. doi: 10.1016/0167-8760(90)90060-q. [DOI] [PubMed] [Google Scholar]
- Seaman MA, Serlin RC. Equivalence confidence intervals for two-group comparisons of means. Psychological methods. 1998;3(4):403–411. [Google Scholar]
- Seeck M, Lazeyras F, Michel CM, Blanke O, Gericke CA, Ives J, et al. Non-invasive epileptic focus localization using EEG-triggered functional MRI and electromagnetic tomography. Electroencephalogr Clin Neurophysiol. 1998;106(6):508–512. doi: 10.1016/s0013-4694(98)00017-0. [DOI] [PubMed] [Google Scholar]
- Shackman AJ, Sarinopoulos I, Maxwell JS, Pizzagalli DA, Lavric A, Davidson RJ. Anxiety selectively disrupts visuospatial working memory memory. Emotion. 2006;6:40–61. doi: 10.1037/1528-3542.6.1.40. [DOI] [PubMed] [Google Scholar]
- Sutton SK, Davidson RJ, Donzella B, Irwin W, Dottl DA. Manipulating affective state using extended picture presentations. Psychophysiology. 1997;34(2):217–226. doi: 10.1111/j.1469-8986.1997.tb02135.x. [DOI] [PubMed] [Google Scholar]
- Trujillo-Barreto NJ, Aubert-Vazquez E, Penny WD. Bayesian M/EEG source reconstruction with spatio-temporal priors. Neuroimage. 2008;39(1):318–335. doi: 10.1016/j.neuroimage.2007.07.062. [DOI] [PubMed] [Google Scholar]
- U.S. Department of Health and Human Services Food and Drug Administration Center for Drug Evaluation and Research. [Retrieved November 11th, 2007];Guidance for industry: Statistical approaches to establishing bioequivalence. 2001 from http://www.fda.gov/cder/guidance/index.htm.
- van Boxtel A. Optimal signal bandwidth for the recording of surface EMG activity of facial, jaw, oral, and neck muscles. Psychophysiology. 2001;38(1):22–34. [PubMed] [Google Scholar]
- Vitacco D, Brandeis D, Pascual-Marqui R, Martin E. Correspondence of event-related potential tomography and functional magnetic resonance imaging during language processing. Human brain mapping. 2002;17(1):4–12. doi: 10.1002/hbm.10038. [DOI] [PMC free article] [PubMed] [Google Scholar]
- Waterink W, van Boxtel A. Facial and jaw-elevator EMG activity in relation to changes in performance level during a sustained information processing task. Biological psychology. 1994;37(3):183–198. doi: 10.1016/0301-0511(94)90001-9. [DOI] [PubMed] [Google Scholar]
- Whitham EM, Pope KJ, Fitzgibbon SP, Lewis T, Clark CR, Loveless S, et al. Scalp electrical recording during paralysis: Quantitative evidence that EEG frequencies above 20 hz are contaminated by EMG. Clinical neurophysiology : official journal of the International Federation of Clinical Neurophysiology. 2007;118(8):1877–1888. doi: 10.1016/j.clinph.2007.04.027. [DOI] [PubMed] [Google Scholar]
- Whitham EM, Lewis T, Pope KJ, Fitzgibbon SP, Clark CR, Loveless S, DeLosAngeles D, Wallace AK, Broberg M, Willoughby JO. Thinking activates EMG in scalp electrical recordings. Clinical neurophysiology. 2008;119:1166–1175. doi: 10.1016/j.clinph.2008.01.024. [DOI] [PubMed] [Google Scholar]
- Willis J, Nelson A, Rice J, Black FW. The topography of muscle activity in quantitative EEG. Clinical EEG (electroencephalography) 1993;24(3):123–126. doi: 10.1177/155005949302400310. [DOI] [PubMed] [Google Scholar]
- Worrell GA, Lagerlund TD, Sharbrough FW, Brinkmann BH, Busacker NE, Cicora KM, et al. Localization of the epileptic focus by low-resolution electromagnetic tomography in patients with a lesion demonstrated by MRI. Brain Topography. 2000;12:273–282. doi: 10.1023/a:1023407521772. [DOI] [PubMed] [Google Scholar]
- Yao J, Dewald JP. Evaluation of different cortical source localization methods using simulated and experimental EEG data. NeuroImage. 2005;25(2):369–382. doi: 10.1016/j.neuroimage.2004.11.036. [DOI] [PubMed] [Google Scholar]
- Zumsteg D, Friedman A, Wennberg RA, Wieser HG. Source localization of mesial temporal interictal epileptiform discharges: Correlation with intracranial foramen ovale electrode recordings. Clinical neurophysiology : official journal of the International Federation of Clinical Neurophysiology. 2005;116(12):2810–2818. doi: 10.1016/j.clinph.2005.08.009. [DOI] [PubMed] [Google Scholar]
- Zumsteg D, Wennberg RA, Treyer V, Buck A, Wieser HG. H2(15)O or 13NH3 PET and electromagnetic tomography (LORETA) during partial status epilepticus. Neurology. 2005;65(10):1657–1660. doi: 10.1212/01.wnl.0000184516.32369.1a. [DOI] [PubMed] [Google Scholar]