

Abstract
Bacterial RNA polymerase and a “sigma” transcription factor form an initiation-competent “open” complex at a promoter by disruption of about 14 base pairs. Strand separation is likely initiated at the highly conserved -11 A-T base pair. Amino acids in conserved region 2.3 of the main E. coli sigma factor, σ70, are involved in this process, but their roles are unclear. To monitor the fates of particular bases upon addition of RNA polymerase, promoters bearing single substitutions of the fluorescent A-analog 2-AP at −11 and two other positions in promoter DNA were examined. Evidence was obtained for an open intermediate on the pathway to open complex formation, in which these 2-AP are no longer stacked onto their neighboring bases. The tyrosine at residue 430 in region 2.3 of σ70 was shown to be involved in quenching the fluorescence of a 2-AP substituted at −11, presumably through a stacking interaction. These data refine the structural model for open complex formation and reveal a novel interaction involved in DNA melting by RNA polymerase.
Keywords: RNA polymerase, sigma, strand opening, stacking, open intermediate
Introduction
In bacteria, sigma-type transcription initiation factors bind to the core RNA polymerase assembly (RNAP; subunit composition α2ββ′ω) to assemble the holoenzyme that can specifically recognize promoters and form the “open” complex, competent to initiate RNA synthesis. In this complex a promoter region of about 14 base pairs is melted, extending from the highly conserved -11A in the −10 promoter element to +3 downstream of the start site of transcription. This process requires no external source of energy, and involves several intermediates 1. The -11A of promoter DNA is a vital element in the formation of the strand-separated complex 2; 3; 4. Promoter DNA melting is thought to be initiated by rotating the -11A out of the DNA helix, and into a hydrophobic pocket on the sigma σ70 2; 5. Such base flipping has been demonstrated by X-ray crystallography for enzymes involved in DNA repair and maintenance, and for some enzymes also by 2-AP fluorescence (e.g. 6; 7; 8; 9). However, its role in nucleating DNA opening by RNAP has not yet been directly shown.
The main sigma factor in E. coli, σ70, is responsible for transcription of house-keeping genes, and as such is essential for growth of the cell. While it was discovered almost 40 years ago 10, major gaps remain in our knowledge of the mechanism by which σ70 participates in specific recognition of promoter DNA, and in the strand – separation process. Amino acids in conserved region 2.4 of σ70 are responsible for recognition of the −10 promoter element 11. However, the specific amino acids involved have only been identified for interaction with the −12 base pair 12. Residues of region 2.3 participate in promoter DNA strand separation 13; 14; 15, but the relevant interactions have not yet been elucidated 16. Other subunits of RNAP are likely also involved in the strand separation process. However, the seminal importance of the sigma factor is evident from the observations that a subassembly of σ70 and β′ fragments forms an open complex at an extended consensus –10 promoter (TGxTATAAT) on negatively supercoiled DNA 17, and that key residues in region 2 are required for efficient DNA opening at low temperature 18.
To study the kinetic mechanism by which promoters form heparin-stable (i.e. long-lived) complexes with both WT RNAP and RNAP containing various substitutions in region 2.3 of σ70, the electrophoretic mobility shift assay (EMSA) was employed. To study the fate of particular bases in the promoter DNA subsequent to RNAP binding, we introduced the fluorescent A-analog, 2-AP, at the −11, −8 and −4 positions in the nontemplate strand. Unstacking of 2-AP in double helical DNA due to DNA melting or other distortions in B DNA structure results in increased fluorescence 19. Analysis of the kinetics of the RNAP-induced increase in the fluorescence of 2-AP substituted at positions −4, −8 and −11 of promoter DNA revealed rate constants that are significantly greater than those for formation of stable RNAP-promoter complexes. These results provide evidence for a novel intermediate in which the bases in the region to be melted are unstacked, but the final open complex has not yet been established. With RNAP containing substitutions for Y430, but not for four other region 2.3 amino acids tested, a greatly enhanced -11 2-AP signal was observed compared to that seen with WT RNAP. It is concluded that -11 2-AP fluorescence is quenched to nearly similar extents by stacking in double helical promoter DNA as by interactions with Y430 in promoter complexes formed by WT RNAP. This work identifies Y430 as the key aromatic amino acid residue of σ70 responsible for capturing the extruded -11 A. This function was anticipated for residues in region 2.3, but not established until this study.
Results
Promoter DNA and RNAP
To examine DNA opening without complications due to effects on initial binding of RNAP, promoter DNA substrates have the consensus core promoter sequences at the −35 and extended −10 regions (figure 1a 20; 21; 22). This 65 bp DNA oligomer was designed to favor tight binding, compensating for any disruptive substitutions of 2-AP and/or amino acids in region 2.3 of σ70, as shown below. The holo RNAP contained either WT σ70, or σ70 with the single alanine substitutions for F427, T429, Y430, W433 and W434, region 2.3 residues that play a role in the RNAP-induced promoter strand separation 14; 15; 16; 21; 23. RNAP containing multiple substitutions in σ70 were also investigated: YW has both the Y430A and W433A substitutions, FYW additionally has F427A, and FYWW additionally W434A. RNAP containing substitutions for Y430 other than alanine were also studied (see figures 3A and 3B).
Figure 1.

The promoter DNA used in this work; kinetics of stable complex formation. A. The 65 bp promoter DNA sequence, spanning positions from −45 to +20. DNA sequences downstream of the +1 are not shown. Consensus −35 and −10 elements are shown in bold, as is the +1 transcription start site. The −11, −8 and −4 sites where 2-AP was substituted for A on the nontemplate (top) strand are underlined. B. Plot of the fraction of RNAP bound to -4 2AP DNA over time, as determined by EMSA. The first 4 time points were at 15, 30, 60 and 120 s. After a 2 minute challenge with heparin, the reactions were loaded onto a non-denaturing gel. DNA and RNAP concentrations were 10 nM and 50 nM, respectively. Lines represent single exponential fits to the data. C. Plot of the fraction of RNAP bound to -11 2AP DNA over time, determined as in B, above. The first 4 time points were at 30, 60, 120 and 300 s for WT, Y430A and W434A RNAP, and at 30, 120, 300 and 600 for FYW RNAP.
Figure 3.

Effects of various amino acid substitutions at position 430 of σ70, on -11 2-AP fluorescence. A. The substitutions at 430 do not have large effects on stable complex formation. EMSA experiments were performed by incubating 5 nM of -11 2AP DNA with 25 nM of WT or mutant RNAP for 15 seconds. The reaction mixes were then loaded onto a non-denaturing gel after a 2 minute heparin challenge. The fraction of RNAP-bound DNA for various substitutions, normalized to that for WT RNAP, was plotted as a function of the particular RNAP investigated. B. The substitutions at Y430 affect fluorescence amplitudes, but not the rate constants. Changes in fluorescence over time upon mixing of RNAP and -11 2AP promoter DNA, as measured by a stopped-flow. The concentrations of RNAP and DNA are the same as in A, above; no heparin challenge was used for these experiments.
Characterization of the EMSA assay for determining heparin-stable complex formation between RNAP and promoter DNA
To compare the kinetics of initiation-competent, open RNAP-promoter complex formation with the kinetics of RNAP-induced changes in DNA structure, we first examined the relationship between the formation of heparin-resistant complexes, detected by EMSA, and of initiation-competent complexes. Heparin is a polyanion that binds free RNAP irreversibly, eliminating any complexes that dissociate on a sub-minute timescale from detection. The complexes that survive the challenge by heparin (200 μg/ml) for 2 min are also referred to here as “stable”. In supplementary figure 1A, the amount of shifted complexes is shown, following a 15 s incubation of 50 nM RNAP (WT or with various substitutions) and 10 nM promoter containing 2-AP at −11. The quantified extents of stable complex formation (normalized with respect to WT RNAP) are shown in supplemental figure 1B, and the extents of abortive RNA synthesis following the same time interval, in supplemental figures 2A and 2B. Comparison of the normalized data presented in supplemental figures 1B and 2B demonstrates that the relative amounts of stable complexes and of abortive RNA synthesis are the same, within uncertainty, for 7 out of 9 RNAP tested (W434A and YW are the exceptions). For reactions where the incubation times of RNAP and promoter DNA were 10 minutes, the extents of binding and of abortive RNA synthesis were greater for all the RNAP studied. Although the differences between the various RNAP were less pronounced (formation of stable complexes is complete for most RNAP studied), similar patterns were observed. We conclude from these data that the EMSA monitors the formation of heparin-resistant, abortive-initiation-competent complexes.
Kinetics of complex formation detected by EMSA
Representative curves of the kinetics of stable complex formation as detected by EMSA are shown in figures 1B and 1C. RNAP containing either WT σ70, or region 2.3 substituted σ70 was mixed with 2-AP substituted promoter DNA. In all experiments, RNAP was in excess over promoter DNA. At various times, aliquots of the reaction mixtures were challenged with heparin for 2 min and then loaded onto a non-denaturing polyacrylamide gel. The kinetics of formation of EMSA-detected complexes can be monitored by manual mixing; even for WT RNAP three data points define the early part of the curve, prior to reaching the plateau (cf. figure 1B, WT RNAP). All curves are well fit by a single exponential. While double exponential fits (not shown) described some experiments more accurately based on the residuals, the fit rate constants have large errors, possibly due to the relatively small number of points. Without a basis for choosing the double exponential fit as superior, we present in Table 1 the rate constants and amplitudes from the single exponential fits.
Table 1.
| A Stable complexes, -4 2-AP subt.a | ||
|---|---|---|
| ab | k1 (h, −4) (s−1) | |
| WT | 0.87 ± 0.01 | 0.057 ± 0.002 |
| FYW | 0.81 ± 0.01 | 0.011 ± 0.001 |
| B Stable complexes -11 2-AP subst.a | ||
|---|---|---|
| ab | k1 (h, −11) (s−1) | |
| WT | 0.84 ± 0.01 | 0.016 ± 0.003 |
| T429A | 0.58 ± 0.05 | 0.0014 ± 0.0000 |
| F427A | 0.81 ± 0.04 | 0.008 ± 0.001 |
| Y430A | 0.82 ± 0.08 | 0.016 ± 0.002 |
| W433A | 0.80 ± 0.07 | 0.011 ± 0.001 |
| W434A | 0.84 ± 0.03 | 0.003 ± 0.000 |
| YW | 0.81 ± 0.01 | 0.015 ± 0.002 |
| FYW | 0.67 ± 0.01 | 0.002 ± 0.000 |
| FYWW | 0.10 ± 0.01 | 0.0016 ± 0.0000 |
Complex formation was determined by EMSA. The DNA concentration was 10 nM, and the RNAP concentration 50 nM. Stable complexes of RNAP and promoter DNA (2-AP substituted at the positions indicated) are those that survive a 2 min challenge with heparin.
All binding data were fit to a single exponential; a is the fraction of total labeled DNA migrating with a reduced mobility compared to the free DNA..
Substitutions in region 2.3 of σ70 significantly affect the amount of open complexes formed at equilibrium, as well as the rate of their formation. While most RNAP bind >80% of the -11 2-AP promoter in a heparin-resistant complex, W434A, T429A, FYW and FYWW disfavor conversion to stable complexes. Combined with the 2-AP substitution at the highly conserved −11 position in the −10 hexamer, T429A, FYW and FYWW bind 58%, 67% and 10% promoter DNA in long-lived complexes, respectively (Table 1). Over a tenfold difference in rate constants is observed: WT and Y430A exhibit the greatest values (k (h, −11) = 0.016 s−1) and FYWW and T429A the smallest (k (h, −11) = 0.0016 s−1 and k (h, −11) = 0.0014 s−1), respectively). (Rate constants for stable complex formation are designated k (h, −x) where the h denotes the formation of heparin-resistant complexes and −x is the position of 2-AP substitution.) However, all open complexes, once formed, are very stable: no dissociation is detected during a 60 min heparin challenge (data not shown).
In previous experiments with other templates, Y430A and other single substitutions in region 2.3 clearly had deleterious effects on stable complex formation 14; 23. However, such effects are not observed with the consensus promoter studied here. We also measured the kinetics of stable complex formation of the WT or FYW RNAP with the promoter DNA bearing 2-AP substitutions at less conserved positions in the −10 region (−8; supplemental Table 2) or downstream (−4; Table 1). The rate constants for WT RNAP are fourfold greater with DNA containing -4 or -8 2-AP, than that with -11 2-AP, and more RPo forms at equilibrium (Table 1; supplemental Table 2). These results are consistent with prior data indicating that 2-AP substitution at −11 disfavors open complex formation 4; 5; 16.
Evidence for rapid saturation of an early short-lived complex at the consensus promoter
Kinetic studies of open complex formation performed in excess RNAP over promoter DNA typically exhibit single exponential kinetics where kobs reaches a plateau with increasing RNAP concentration. Such data are well described by a mechanism of open complex formation involving at least one short-lived intermediate formed after an initial binding step. This intermediate rapidly equilibrates with reactants on the time scale of its conversion to a stable complex (cf. 24; 25). When the RNAP concentration is sufficiently high so that all free promoter DNA is rapidly converted to this heparin-sensitive intermediate, kobs becomes independent of [RNAP] and equal to the first order rate constant for the subsequent conformational change. The dependence of kobs on [RNAP] was investigated for the doubly-substituted YW RNAP binding to the -11 2-AP promoter DNA. No effect of YW RNAP concentration on kobs was observed from 5 to 50 nM RNAP in either the EMSA or stopped flow fluorescence assay below (data not shown). We deduce that all promoter DNA is rapidly converted to an initially bound complex at the beginning of either experiment, and that a binding step does not contribute to the observed kinetics.
Previous studies show that the T429A 21, Y430A and W433A 26 substitutions (and likely also F427A, although it was not specifically tested), do not affect initial DNA binding by RNAP. Since promoter DNA is rapidly saturated with YW RNAP under these conditions we infer that 1) WT RNAP also exhibits first order kobs in these experiments and 2) any effects of the substitutions reported here are exerted subsequent to initial complex formation. A possible exception is the W434A RNAP, in view of its binding defect 13; 27.
Kinetics of RNAP-induced increase in fluorescence of 2-AP promoter DNA
To study the conformational changes that occur in the steps after formation of the early complex between RNAP and promoter DNA, we monitored the change in the fluorescence of 2-AP substituted at various positions in the −10 region and downstream region of the promoter as a function of time after mixing. In B-form DNA, base stacking of 2-AP causes near-complete quenching of its fluorescence 19; 28. Changes in stacking interactions such as structural distortions of the double helix by DNA kinking or sharp bending 29; 30, melting 31; 32; 33; 34 or flipping of the 2-AP out of the helix 7; 9; 35 are known to increase the 2-AP fluorescence. To probe the proposed critical role of the -11A in nucleating strand separation, 2-AP was incorporated at this position on the NT strand in the consensus promoter. DNA unstacking downstream of −11 was monitored by 2-AP substitutions at −8 and −4 on the NT strand. In control experiments with 2-AP substitutions on the NT strand at positions outside of the initiation bubble (−13 and +7) we observed no changes in 2-AP fluorescence in open complex formation. Moreover, mixing of core RNAP (lacking σ70) with promoter DNA does not affect the fluorescence signal of 2-AP at −4, −8 and −11 (data not shown). We conclude that the observed fluorescence increases at −11, −8 and −4 reflect specific interactions of the holo RNAP with the consensus promoter.
i) -4 2-AP detected kinetics: large, relatively rapid, bi-exponential fluorescence increases for WT and variant RNAP
The kinetics of the RNAP-induced increase in fluorescence of 2-AP substituted at −4 on the nontemplate strand are shown in figure 2A. Similar amplitudes (averaged as indicated in Materials and Methods) are seen regardless of the σ70 substitution (see Table 2). The notable exception is FYWW, which has a greatly reduced signal, commensurate with its impaired ability to form open complexes 21; 36; 37. The data were best fit to a double exponential (see supplemental figure 3), with exception of those for the T429A and FYWW RNAP, which could only be fit to a single exponential. We surmise that for these RNAP the slower phase was not resolved due to the low signal to noise ratio. The parameters of the fits are collected in Table 2. The rate constants determined by monitoring fluorescence are given in the text as k (f, −x) where −x is the position of 2-AP substitution in the promoter. For double exponential fits, the rate constants for the fast and slow phases have subscripts of 1 or 2, respectively.
Figure 2.

Kinetics of change in 2-AP fluorescence as measured by stopped-flow. DNA and RNAP concentrations were the same as for figures 1B and 1C. Complexes were not challenged with heparin; representative curves are shown. A. Change in fluorescence (arbitrary units) after mixing of RNAP and -4 2AP DNA. B and C. Change in fluorescence after mixing of RNAP and -11 2AP DNA. The different RNAP were plotted in two groups (note differences in the y-axis scales between B and C) due to the large differences in amplitude of the fluorescence signal.
Table 2.
Fluorescence, -4 2-AP substituted promoter DNAa
| a1b | k1 (f, −4) (s−1)b | a2b | k2 (f, −4) (s−1)b | |
|---|---|---|---|---|
| WT | 0.07 ± 0.01 | 0.53 ± 0.08 | 0.20 ± 0.01 | 0.15 ± 0.03 |
| T429A | 0.22 ± 0.04 | 0.08 ± 0.005 | NFc | NFc |
| F427A | 0.07 ± 0.01 | 0.29 ± 0.04 | 0.21 ± 0.02 | 0.08 ± 0.01 |
| Y430A | 0.15 ± 0.04 | 0.37 ± 0.01 | 0.17 ± 0.05 | 0.11 ± 0.00 |
| W433A | 0.15 ± 0.03 | 0.39 ± 0.03 | 0.16 ± 0.05 | 0.14 ± 0.01 |
| W434A | 0.12 ± 0.03 | 0.35 ± 0.02 | 0.18 ± 0.04 | 0.11 ± 0.00 |
| YW | 0.17 ± 0.01 | 0.36 ± 0.05 | 0.15 ± 0.02 | 0.12 ± 0.015 |
| FYW | 0.06 ± 0.01 | 0.12 ± 0.04 | 0.21 ± 0.01 | 0.03 ± 0.01 |
| FYWW | 0.018 ± 0.001 | 0.34 ± 0.07 | NFc | NFc |
The time-dependence of 2-AP fluorescence as determined in a stopped flow instrument. The final DNA and RNAP concentrations were 10 nM and 50 nM. 600 points were taken over times ranging from 20 seconds to 300 seconds (depending on the RNAP mutant used).
The data were fit to a double exponential equation. The amplitudes (a1 and a2) are in arbitrary units.
NF indicates that the data could not be fit to a double exponential equation. Single exponential fits are given in supplemental Table 1.
The rate constants determined by 2-AP fluorescence (whether the 2-AP is at −4, −8 or −11), are at least seven-fold greater than those detected by EMSA for heparin-resistant complex formation, regardless of whether fit to single or double exponentials. Thus some or all of the DNA conformational changes responsible for the fluorescence signal precede formation of the EMSA-detected complexes. In the case of WT RNAP, the k1 (f, −4) was an order of magnitude greater than the corresponding rate constant for the formation of the EMSA-detected stable complex. The rate constants for the fast phase determined with the 2-AP substituted promoters are similar for RNAP containing WT, F429A, Y430A, W433A, W434A and YW σ70 (see Tables 2 and 3, and supplemental Table 2); here the average k1 (f, −4) = 0.38 ± 0.08 s−1. For the FYW RNAP, k1 (f, −4) is smaller than that of WT RNAP by about a factor of 3. The rate constants for the slower phase (k2 (f, −4)) are all about 3-fold smaller than the k1 (f, −4).
Table 3.
Fluorescence, -11 2-AP substituted promoter DNAa
| a1b | k1 (f, −11) (s−1)b | a2b | k2 (f, −11) (s−1)b | |
|---|---|---|---|---|
| WTc | 0.03 ± 0.01 | 0.39 ± 0.02 | ||
| T429A | NFd | NFd | NFd | NF d |
| F427Ac | 0.014 ± 0.001 | 0.48 ± 0.01 | ||
| Y430A | 0.27 ± 0.06 | 0.29 ± 0.01 | 0.21 ± 0.05 | 0.07 ± 0.07 |
| W433Ac | 0.024 ± 0.004 | 0.27 ± 0.04 | ||
| W434Ac | 0.019 ± 0.001 | 0.29 ± 0.01 | ||
| YW | 0.17 ± 0.05 | 0.34 ± 0.05 | 0.26 ± 0.02 | 0.065 ± 0.001 |
| FYW | 0.094 ± 0.001 | 0.13 ± 0.04 | 0.27 ± 0.01 | 0.008 ± 0.001 |
| FYWW | 0.05 ± 0.01 | 0.36 ± 0.02 |
The time-dependence of 2-AP fluorescence as determined in a stopped flow instrument. The final DNA and RNAP concentrations were 10 nM and 50 nM. 600 points were taken over times ranging from 20 seconds to 500 seconds (depending on the RNAP mutant used).
The data were fit to a double exponential equation. The amplitudes (a1 and a2) are in arbitrary units.
The data could only be fit to a single exponential.
NF indicates that the data could not be fit to either a single or a double exponential equation due to a low signal.
ii) -11 2-AP detected kinetics: evidence for interaction between –11A and σ70 Y430
In figures 2B and 2C, the kinetic curves for the interaction of WT and variant RNAP with -11 2-AP substituted promoter DNA are shown. The parameters are collected in Table 3. For the interactions of WT RNAP with -11 2-AP promoter DNA, the observed fluorescence increase is very small (low amplitude), in sharp contrast to the amplitudes observed for WT and variant RNAP interactions with the -4 2-AP substitution (figure 2A). Much larger fluorescence increases are observed for interactions of all RNAP containing the Y430A substitution and -11 2-AP promoter DNA, ranging from two-fold greater than WT RNAP for the FYWW RNAP, to almost 20 – fold for the single Y430A substitution. The latter is 1.5 fold greater than the largest effect observed for the interaction of RNAP with the -4 2-AP promoter. The kinetics of the fluorescence increase with the Y430A, YW and FYW RNAP (variants for which the amplitudes of the fluorescence increase are largest), are double-exponential (see supplemental figure 4). The combined average of k1 (f, −11), and k (f, −11), is 0.36 ± 0.08 s−1 for WT, F429A, Y430A, W433A, W434A and YW σ70. For the WT RNAP and other RNAP containing the Y430 residue the amplitudes are small. Together these observations demonstrate that Y430 participates directly or indirectly in quenching the -11 2-AP fluorescence.
iii) -8 2-AP detected kinetics: low amplitudes and single exponentials
The results obtained with consensus promoter DNA containing 2-AP at −8 are summarized in supplemental Table 2. Low amplitudes were observed for all the RNAP tested, while no measurable signal was detected for FYWW RNAP. All curves fit well to a single exponential. Interestingly, the amplitudes for the RNAP with the W433A and T429A substitutions were about three-fold greater than those for the WT RNAP. While these are considerably smaller effects than that observed for Y430A and the -11 2-AP promoter, they may still reflect proximities of W433 and T429 to the −8 base in an intermediate complex. The average k (f, −8) = 0.34 ± 0.08 s−1 for WT, F429A, Y430A, W433A, W434A and YW σ70. The fluorescence increase for FYW RNAP is considerably slower than that for any of the other RNAP tested with the -8 2-AP substituted promoter DNA.
Effects of different amino acid substitutions at σ70 Y430 on the environment of the nontemplate base at −11
When Y430 is changed to alanine, the fluorescence signal for 2-AP at −11 increases dramatically (more than 15-fold; figures 2B and 2C). This effect is not seen for the Y430A substitution and promoter DNA containing 2-AP at −8 or −4. Possible interpretations are that, after it is flipped out of the helix, the -11 2-AP stacks to Y430 leading to fluorescence quenching, and/or that Y430’s role is to place the -11 2-AP in a pocket where other interactions lead to fluorescence quenching. To determine whether stacking or another type of binding interaction quenches the fluorescence signal of the 2-AP at −11, we changed Y430 to the aromatic residues F or W, to a long aliphatic side chain L, or to H. To assess whether these substitutions affect open complex formation under the conditions of the stopped flow experiment, we determined extents of formation of heparin-resistant complexes after a 15s incubation of RNAP with the -11 2-AP consensus promoter (see figure 3A In this short time interval, amounts of heparin-resistant complexes formed by RNAP σ70 variants are either the same as for WT RNAP (Y430A, Y430W and Y430F), or somewhat greater (Y430H and Y430L). Stable complex formation was also determined following a 10 min incubation; after this longer time, similar extents of binding were seen for all RNAP (data not shown).
The results of kinetic studies with -11 2-AP substituted promoter DNA are shown in figure 3B. As seen for the change to alanine, substitutions of H, L and F for Y430 all increase the fluorescence of -11 2-AP relative to the low signal for WT RNAP. Strikingly, the amplitude of the signal obtained for Y430W RNAP is smaller than that for WT RNAP, too low for the data to be fit. The data for the H, L, F and A substitutions were best fit to a double exponential equation. Other than Y430W, the substitutions do not greatly affect either k1 (f, −11) (average of 5 values is 0.49 ± 0.06), or k2 (f, −11) (average of 4 values is 0.12 ± 0.01) (data not shown). Apparently the W430 residue quenches the -11 2-AP fluorescence to an even greater extent than did the WT residue, Y430. On the other hand, other substitutions at 430 tested rendered RNAP unable to quench the -11 2-AP fluorescence. F and A have similar effects and H and L result in larger increases in the fluorescence of the 2-AP substituted at −11 in the non-template strand. The lack of fluorescence quenching by the Y430F RNAP accentuates the importance of the tyrosine hydroxyl group.
Discussion
The role of σ70 Y430
The Y430A substitution in σ70 leads to a large increase in the 2-AP signal upon binding of RNAP to promoter DNA substituted at −11, but not at −8 or −4. Based on these data, we propose that Y430 plays a role in quenching the fluorescence of the -11 2-AP. Y430 could stack with the −11 base after it is flipped out of the helix, or it could facilitate placing the −11 base in an RNAP pocket where its fluorescence would be quenched due to interactions with additional amino acid side chains. Because the -11 2-AP fluorescence increases for four out of the five substitutions tested, we surmise that it is unstacked in these RNAP-promoter complexes and not in a fluorescence-quenching environment. No change in fluorescence is observed with the Y430W RNAP, even though the kinetics and extent of formation of stable -11 2-AP complexes are indistinguishable from WT RNAP. Our experiments are most consistent with direct capture by Y430 of the -11 2-AP after it is flipped out of the helix. In the 6.5 Å resolution open complex model 38, the Y430 is in close proximity of the -11A. We had previously concluded from studies of interactions between RNAP and a consensus promoter truncated at +1, that -11A and Y430 did not interact 16. While the results presented here supersede that simple interpretation, our previous data still indicate that Y430 plays a role beyond its interaction with -11A. This role may be more critical for promoters lacking downstream DNA.
Studies of base flipping by other enzymes on DNA where 2-AP was substituted for the extruded base found that fluorescence quenching was suppressed if an alanine was substituted for the aromatic amino acid residue to which the 2-AP stacks following its removal from of the helix 9; 35. For both WT and mutant RNAP-promoter complexes, the -11 2-AP apparently remains extra-helical once flipped. Since the observed rate constant (k1 (f, −11)) is similar for WT and Y430A RNAP (see Table 3), i.e. independent of whether the −11 base is captured or not, we propose that another region of the RNAP facilitates its extrusion from the DNA double helix and that capture does not determine the rate of this step. Likely candidates are amino acid side chains in the upstream lobe of the beta subunit. Located directly across from region 2 of σ70 at the entrance of the active site channel 39; 40, these residues appear well-positioned to induce the bend that puts the downstream DNA in the active site cleft in an early intermediate and to flip bases in the −10 region out of the DNA helix.
Evidence for an intermediate species on the pathway to formation of an initiation-competent open complex
The events monitored by 2-AP fluorescence are first order for all RNAP studied here, indicating that they occur subsequent to RNAP binding to promoter DNA. It is likely that this is the case for all single substitutions in σ70 studied here, as well as for DNA with 2-AP substitutions at −4 and −8. The values of the larger rate constants (k1 or k) are about 0.36 s−1, independent of the positions of the 2-AP substitutions (see Results). These values are at least an order of magnitude greater than the EMSA-detected rate constants for stable complex formation (k (h, −11) = 0.016 s−1 for WT RNAP; see Table 1B). The k2 (f, −11) for Y430A and YW were similar at about 0.07 s−1, 4-fold greater than the values for stable complex formation. Similarly, for FYW RNAP the k2 (f, −11) was 4-fold greater than the kobs for stable complex formation (k2 (f, −11) = 0.008 s−1 versus k (h, −11) = 0.002 s−1, respectively; see Tables 1 and 3).
Our results provide compelling evidence for at least one, fluorescent intermediate formed subsequent to the early (quenched) complex and on the pathway to formation of the stable open complex. What might be the nature of these changes in the DNA? The observed increase in 2-AP fluorescence likely results from unstacking, as a consequence of DNA melting or other distortions of DNA structure (e.g. 29; 30). For the 2-AP at −11, we observed large effects of substitutions at residue 430 on the amplitude of the -11 2-AP fluorescence signal. The simplest explanation of this result is that flipping of the −11 base out of the helix (and thus local disruption of base stacking at −11) takes place; for WT RNAP this base is then captured by Y430. The interaction with Y430 appears to quench -11 2-AP fluorescence nearly as effectively as its stacking interactions in promoter duplex DNA. As no early, transient, increase in 2-AP fluorescence is observed, we conclude that the transit time of the -11 2-AP from being stacked in the DNA helix to interacting with the Y430 is very short compared to the time scale of our experiments. The lack of an observable effect of the Y430A substitution in the experiments described here, is likely due to the use of a very strong promoter (see figure 1A).
As the rate constants of the fluorescence increases for the 2-AP at −4 and at −8 are equal to that of the 2-AP at −11, it is likely that base pairs in the region from −11 to −4 are melted concurrently, likely in response to introduction of a bend across this region. The positioning of sigma on RNAP requires that promoter DNA bends sharply at −11/−12 to enter the active site channel. We and others proposed that i) the bend occurs in an early intermediate (I1 at the λPR promoter), and ii) this ~90° bend places the start site (+1) DNA in the active site cleft and likely nucleates melting 40; 41. A bending event was proposed to occur at the T7A1 promoter with a similar rate constant to that observed here for k1 (f, −4, −8 or −11): 0.4 to 1.4 s−1, depending on the model used to analyze the data 42. Indeed, for T7 RNAP concurrent promoter DNA bending and melting was observed 33; 43. Additionally, in base flipping by Uracil DNA glycosylase, DNA bending has been found to be crucial in promoting the extrusion of the base out of the helix 8
Comparison of the fluorescence signals obtained with promoter DNA bearing 2-AP substitutions at −11, −8 and −4
The amplitudes of the fluorescent signals obtained with WT RNAP and promoter DNA containing the 2-AP at −4 are much higher than for the substitutions at both the −11 and −8 positions (a large signal for the -4 2-AP was previously noted 31). Interestingly, the higher signal observed with WT RNAP and the promoter DNA containing the substitution at −4 is comparable to (within 65% of) that seen with Y430A RNAP and the -11 2-AP. We infer that there is little or no quenching of the -4 2-AP once it is displaced out of the DNA helix (compare Tables 2 and 3). The signals obtained with WT RNAP interacting with promoter DNA bearing the 2-AP at −11 and −8 are similar (compare Table 3 and supplemental Table 2). These results likely mean that the fluorescence of the -8 2-AP, just like that of the -11 2-AP, is still partially quenched once it is out of the DNA helix. The residue(s) responsible for quenching the -8 2-AP are as yet unknown.
The pathway to open complex formation and effects of particular substitutions in region 2.3
Scheme 1 below is the simplest mechanism capable of describing the EMSA and fluorescence-detected kinetic data for the formation of complexes between WT or sigma variant RNAP and 2-AP labeled consensus promoter DNA:
Scheme 1.
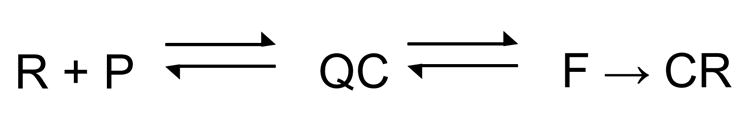
In Scheme 1, QC refers to the most advanced quenched (silent), short-lived (heparin-sensitive) complex between RNAP and promoter DNA; QC reversibly isomerizes to a complex detectable by 2-AP fluorescence (F; also sensitive to heparin challenge), that then converts to competitor (e.g. heparin)-resistant fluorescent complexes (including the open complex RPo), CR, detected by EMSA. Positioning of F before CR is based on the observations for both WT and sigma variant RNAP that the rate constants for increase in 2-AP fluorescence at all promoter positions examined (−11, −8 and −4) significantly exceed those for formation of EMSA-detected stable complexes.
Preliminary results from kinetic simulations based on this mechanism (Gries et al., in preparation) reveal that the double exponential character of the fluorescence data arises from the reversibility of the step converting the silent QC to the F complex detected by 2-AP fluorescence. To observe two exponentials, the conversion of F back to QC, while not necessarily rapid, is at least significant on the time scale of converting F to CR (e.g. RPo). There may be additional intermediates between F and CR; their detection requires investigating the dissociation of CR.
How do the intermediates in Scheme 1 relate to the two kinetically significant intermediates I1 and I2 that precede formation of RPo at the λPR promoter? λPR deviates from consensus at each of the −10 and −35 hexamers by one position and lacks the extended −10 sequence (λPR −15 to −7: gG-gATAAT, where consensus bases are indicated in capital letters). I1 is sensitive to a 10 s heparin challenge, and appears to be a closed complex that protects the DNA backbone to at least ~+20 44; 45. The highly transient nature of I2 has precluded its structural characterization to date. I2 is inferred to be a competitor-resistant complex that rapidly converts to RPo on the time scale of its back conversion to I1. Based on the similar magnitudes of the overall EMSA rate constant for converting QC to CR and the rate constant for converting I1 to I2 at 25 °C (~0.05 s−1; 41), and the evidence to date which indicates that I1 is a closed complex 44; 45, we speculate that QC is similar to I1. CR would represent both heparin-resistant complexes at λPR, I2 and RPo. What is intermediate F?
At λPR, interconversion of I1 and I2 appears to be an elementary step without intermediates. At the consensus promoter, we detect an additional step (formation of F) between the I1-like complex QC and CR. One hypothesis is that optimal sequences in the consensus promoter lower the activation barrier between I1 and I2 compared to that observed for λPR, stabilizing the I1–I2 transition state complex. What promoter sequences provide enough binding free energy to convert this transition state complex to a kinetically-significant intermediate? Based on the observation that a TG sequence at −15 and −14 increases the composite isomerization rate constant kf more than 10-fold at a galP1 derivative promoter with no effect on the initial binding constant 46, we propose that contacts between RNAP and the extended −10 region drive key conformational changes involved in DNA opening.
Substitutions Y430A, W433A and even the double substitution YW in region 2.3 have little effect on the rate constant determined by monitoring 2-AP fluorescence k1 (f) or k (f) (Tables 2 and 3, and supplemental Table 2) of stable complex formation (Table1). This observation is in contrast to their large effects on stable complex formation previously reported 14; 23. Because the consensus sequence used here is such a strong promoter, the above substitutions may not have discernible thermodynamic or kinetic effects. As a consequence our experiments do not reveal at which steps in scheme 1 Y430 and W433 normally exert their effects. The W434A substitution inhibits stable complex formation as measured with the -11 2-AP substituted DNA (see Table 1), but it does not affect the rate constants for the increase in the fluorescent signal from any of the three 2-AP substituted promoter DNAs tested (Tables 2, 3 and supplemental Table 2). W434 apparently plays an important, but as yet unknown role at a late step in formation of the open complex. The single substitution, T429A, in region 2.3 of σ70 affects multiple steps, as does the FYW triple substitution.
Comparison of our results to those of other recent kinetic studies
The rate constants reported for early steps at the T7 A1 promoter obtained by rapid hydroxyl radical footprinting experiments 42 are considerably larger than those obtained in our stopped flow studies. We conclude that in these early complexes significant changes in the DNA structure surrounding −4, −8 or −11 have not yet occurred. In studies performed on promoters containing 2-AP in the melted region, just as in our work, both slow and fast phases were seen. For the lacP1 promoter (2-AP at +1), a very fast step (rate constant of about 10 s−1) was observed, interpreted as immediately following closed complex formation, in addition to a much slower one (rate constant of 0.003 s−1). The reaction mix contained a high [RNAP] (550 nM) 47.
In a study of the interaction of RNAP (100nM) with the galP1 promoter 31, only with 2-AP at +2 or +3, a fast step could be observed, interpreted as DNA distortion. It had a rate constant of about 0.8 s−1, similar to that obtained for the fast step in our studies. In reactions at a much higher [RNAP] (830 nM) just a slower step with a rate constant of about 0.001 s−1, dependent on 2-AP position, was seen which was interpreted as strand separation. The slow steps in both these studies may be slower than in our experiments, as both the GalP1 and LacP1 promoters deviate from consensus at several positions, in contrast to the DNA used here (figure 1A).
Conclusions
We conclude that Y430 of σ70 captures the base at -11 A of promoter DNA through stacking interactions once it is flipped out of the promoter DNA. We present evidence for the existence of an open, heparin-sensitive intermediate F on the pathway to formation of an open complex. In F, the DNA at positions −11, −8 and −4 (and likely also the intervening positions) is open, as judged by 2-AP fluorescence. Most single substitutions in region 2.3 of σ70 affect the conversion of F to the final open complex.
Materials and Methods
Materials
2-Aminopurine containing oligodeoxynucleotides were synthesized by Integrated DNA Technologies or Midland Certified Reagent Company and UpA by Dharmacon. (γ-33P) and (α-33P) ATP were purchased from Perkin Elmer, DNA modifying enzymes from either New England Biolabs or Roche and E. coli RNAP core from EpiCenter. All chemicals were from Sigma, Fisher, or Amresco.
Protein purification, characterization, and reconstitution
E. coli σ factors were purified exactly as described (Schroeder et al., 2007). Holoenzyme was reconstituted by incubating core RNAP (400 nM) and WT or substituted σ70 on ice for 1 hour. Depending on the particular preparation, the σ70 was added in 5 to 15-fold excess over the core enzyme, as determined by EMSA (see below) to give optimal formation of stable complexes with promoter DNA (Schroeder et al., 2007).
Promoter DNA
Both strands of promoter DNA were chemically synthesized, and the 2-AP substituted nontemplate strand was annealed to the template strand, with the latter in 1.5 fold excess 16. For binding studies the nontemplate strand was phosphorylated with 33P at the 5′ end 16.
Electrophoretic mobility shift assay (EMSA)
Binding assays were carried out exactly as previously described 21. 10 nM annealed promoter DNA and 50 nM of RNAP holoenzyme were incubated at 25°C for 15 seconds or 10 minutes in Fork binding buffer (FBB: 30 mM Hepes, pH 7.5, 1 mM DTT, 0.1 mg/ml BSA, 100 mM NaCl, 0.1 mM EDTA, pH 8, 1% glycerol). The reactions were then challenged with 200 μg/ml of heparin for an additional 2 minutes to assay for formation of stable complexes. Four percent non-denaturing gels were loaded and run at room temperature. After drying, the gel was analyzed as described 16.
Obtaining association rate constants by EMSA
The rate constants, kobs for stable complex formation were determined as described 21. Reactions were set up and subjected to EMSA as described above, except that the RNAP and promoter DNA were incubated for various amounts of time prior to addition of heparin. Fractions of DNA bound were determined and plotted as a function of time and fit using Kaleidagraph version 3.52 to the single exponential equation: y = ymax*(1−exp(−kobs*t)) where ymax is the amplitude and kobs is the pseudo first-order rate constant for the association of RNAP and promoter DNA to form a heparin resistant complex. Experiments with lower DNA (1 nM) and RNAP concentrations (5–50 nM), as indicated, were performed as described above. All glycerol concentrations were adjusted with storage buffer to be 10% final. For determination of the koff, RNAP-promoter complexes were formed in 30 μl reaction mixtures by mixing the RNAP and DNA at the same concentrations as for the association kinetics. After a 15 minute incubation at 25°C, heparin was added to 200 μg/ml and time points taken thereafter.
Abortive Initiation Assay
Reactions contained 10 nM annealed DNA in 1 x FBB supplemented with 10 mM MgCl2 and were started by the addition of RNAP to 50 nM (final volume 10 μl). Incubation was carried out at 25°C for either 15 seconds or 10 minutes, followed by a 2 minute heparin challenge (200 μg/ml). Then one μl of a cocktail containing 850 μM UpA, 150 μM UTP, and 60 μCi of α 33P-UTP was added and incubation was allowed to proceed for 25 minutes before addition of 10 μl of stop solution (to final concentrations of 3 M urea, 50mM EDTA, 0.1% BPB and 0.1% XCFF). Reactions were loaded onto a 20% denaturing PAGE gel (1x TBE, 6 M urea, 4% glycerol). Following electrophoresis, the gel was dried and the relative amounts of radio-labeled UpApU trinucleotide and free UTP were determined by Phospor-Imaging. The values obtained for the mutant RNAPs were then normalized to that obtained with the WT RNAP.
Fluorescence
For stopped flow experiments, two (900 μl) solutions were prepared in 1xFBB, but without BSA to reduce background signal. One solution contained 20 nM annealed 2-AP substituted promoter DNA (10 nM after mixing with RNAP), and storage buffer to keep the glycerol and salt concentrations constant for all reactions. A second solution contained 100 nM of reconstituted WT or mutant holoenzyme (50 nM after mixing with 2-AP DNA). The separate reaction mixtures were loaded into 3 ml syringes and maintained at 25°C by a circulating waterbath. For some experiments 1 nM 2-AP DNA was used and 5–50 nM RNAP (final concentrations), but otherwise the procedure was similar to that described above. Using an Applied Photophysics Π*-180 stopped-flow apparatus, the two solutions were rapidly mixed into a cuvette. The dead time of mixing was 8 ms. The excitation wavelength was 310 nm (mercury-xenon lamp) and light above the 350 nm cut-off filter was monitored; the slits were set at 2.5 nm. For all reactions the same photomultiplier voltage was used and 600 points were collected for two or more mixing events. Each experiment was carried out twice, on separate days. The data were analyzed by fitting each individual trace with Applied Photophysics software to a single exponential (y = ymax*(1−exp(−kobs*t)). Only single exponentials provided adequate fits to some –11 2AP data, possibly because the low signal to noise ratio did not allow the precise definition of the trace for the slow phase. Alternatively, as indicated, a double exponential equation was used to fit some of the data (y = ymax1*(1−exp(−kobs1*t)) + ymax2*(1−exp(−kobs2*t)), if the fit was visually better than with a single exponential (e.g. see supplemental figures 3 and 4). Errors represent the spread between two experiments performed on separate days. For the Y430 mutant reactions shown in figure 3, traces were averaged, then fit. For these experiments the reactions contained 5 nM 2-AP DNA and 25 nM RNAP.
Supplementary Material
A. EMSA gel of WT and mutant RNAP stable complex binding to -11 2AP DNA after 15 seconds of incubation. A two minute heparin challenge was performed just prior to loading of samples onto a non-denaturing gel. Bands representing RNAP-bound and Free DNA are indicated. B. Fraction of RNAP-bound -11 2AP DNA graphed as a function of the WT value for each RNAP from gels such as that in A, above. The DNA concentration was at 10 nM, and the RNAP concentration at 50 nM for all reactions.
A. Abortive initiation assay gel of WT and mutant RNAP and -11 2AP DNA monitoring the ability of the complex to be able to initiate phosphodiester bond formation. RNAP and -11 2AP DNA were allowed to incubate for 15 seconds, after which heparin was added for a 2 minute challenge. A cocktail mix containing the UpA dinucleotide, UTP, and 33P-labled α-UTP was added and reactions were allowed to proceed for an additional 25 minutes before adding a urea-containing stop solution. 20% denaturing acrylamide gels were then used to separate the UpApU trinucleotide from the free radiolabeled UTP. B. Quanitification of gels such as those shown in A, above, expressed as the % of WT incorporation of the radiolabeled UTP into the UpApU trinucleotide. The DNA concentration was at 10 nM, and the RNAP concentration at 50 nM for all reactions.
Data obtained for -4 2-AP substituted promoter DNA and YW RNAP: Comparisons of single versus double exponential fits. The data were obtained and the fitting was carried out as described in the Materials and Methods. The parameters of the fits are given in inserts to the figures.
Data obtained for -4 2-AP substituted promoter DNA and Y430A RNAP: Comparisons of single versus double exponential fits. The data were obtained and the fitting was carried out as described in the Materials and Methods. The parameters of the fits are given in inserts to the figures.
Acknowledgments
We thank Drs. M. Barkley and T. Berdis for helpful discussions. This work was supported by NIH Grants GM23467 (MTR) and GM 31808 (PLdH).
Footnotes
Publisher's Disclaimer: This is a PDF file of an unedited manuscript that has been accepted for publication. As a service to our customers we are providing this early version of the manuscript. The manuscript will undergo copyediting, typesetting, and review of the resulting proof before it is published in its final citable form. Please note that during the production process errors may be discovered which could affect the content, and all legal disclaimers that apply to the journal pertain.
References
- 1.deHaseth PL, Zupancic M, Record MT., Jr RNA polymerase-promoter interactions: the comings and goings of RNA polymerase. J Bacteriol. 1998;180:3019–3025. doi: 10.1128/jb.180.12.3019-3025.1998. [DOI] [PMC free article] [PubMed] [Google Scholar]
- 2.Helmann JD, deHaseth PL. Protein-nucleic acid interactions during open complex formation investigated by systematic alteration of the protein and DNA binding partners. Biochemistry. 1999;37:5959–5967. doi: 10.1021/bi990206g. [DOI] [PubMed] [Google Scholar]
- 3.Heyduk E, Kuznedelov K, Severinov K, Heyduk T. A consensus adenine at position -11 of the nontemplate strand of bacterial promoter is important for nucleation of promoter melting. J Biol Chem. 2006;281:12362–12369. doi: 10.1074/jbc.M601364200. [DOI] [PubMed] [Google Scholar]
- 4.Lim HM, Lee HJ, Roy S, Adhya S. A “master” in base unpairing during isomerization of a promoter upon RNA polymerase binding. Proc Natl Acad Sci (USA) 2001;98:14849–14852. doi: 10.1073/pnas.261517398. [DOI] [PMC free article] [PubMed] [Google Scholar]
- 5.Tsujikawa L, Strainic MG, Watrob H, Barkley MD, deHaseth PL. RNA polymerase alters the mobility of an A-residue crucial to polymerase-induced melting of promoter DNA. Biochemistry. 2002;41:15334–15341. doi: 10.1021/bi026539m. [DOI] [PubMed] [Google Scholar]
- 6.Bischerour J, Chalmers R. Base-flipping dynamics in a DNA hairpin processing reaction. Nucleic Acids Res. 2007;35:2584–2595. doi: 10.1093/nar/gkm186. [DOI] [PMC free article] [PubMed] [Google Scholar]
- 7.Lenz T, Bonnist EYM, Pijevaljcic G, Neely RK, Dryden DT, Scheidig AS, Jones AC, Weinhold E. 2-Aminopurine flipped into the active site of the adenine-specific DNA methyltransferase M. TaqI: Crystal structure and time-resolved fluorescence. J Am Chem Soc. 2007;129:6240–6248. doi: 10.1021/ja069366n. [DOI] [PubMed] [Google Scholar]
- 8.Parker JB, Bianchet MA, Krosky DJ, Friedman JI, Amzel LM, Stivers JT. Enzymatic capture of an extrahelical thymine in the search for uracil in DNA. Nature. 2007;449:433–437. doi: 10.1038/nature06131. [DOI] [PMC free article] [PubMed] [Google Scholar]
- 9.Tamulaitis G, Zaremba MRHS, Bochtier M, Siksnys V. Nucleotide flipping by restriction enzymes analyzed by 2-aminopurine steady-state fluorescence. Nucleic Acids Res. 2007;35:4792–4799. doi: 10.1093/nar/gkm513. [DOI] [PMC free article] [PubMed] [Google Scholar]
- 10.Burgess RR, Travers AA, Dunn JJ, Bautz EK. Factor stimulating transcription by RNA polymerase. Nature. 1969;221:43–46. doi: 10.1038/221043a0. [DOI] [PubMed] [Google Scholar]
- 11.Lonetto M, Gribskov M, Gross CA. The sigma 70 family: sequence conservation and evolutionary relationships. J Bacteriol. 1992;174:3843–3849. doi: 10.1128/jb.174.12.3843-3849.1992. [DOI] [PMC free article] [PubMed] [Google Scholar]
- 12.Gross C, Chan C, Dombroski A, Gruber T, Sharp M, Tupy J, Young BA. Cold Spring Harbor Symposia on Quantitative Biology. Vol. 63. Cold Spring Harbor Laboratory Press; Plainview, NY: 1998. The functional and regulatory roles of sigma factors in transcription; pp. 141–155. [DOI] [PubMed] [Google Scholar]
- 13.Juang YL, Helmann JD. A promoter melting region in the primary sigma factor of Bacillus subtilis: Identification of functionally important aromatic amino acids. J Mol Biol. 1994;235:1470–1488. doi: 10.1006/jmbi.1994.1102. [DOI] [PubMed] [Google Scholar]
- 14.Panaghie G, Aiyar SE, Bobb KL, Hayward RS, deHaseth PL. Aromatic amino acids in region 2.3 of Escherichia coli sigma 70 participate collectively in the formation of an RNA polymerase-promoter open complex. J Mol Biol. 2000;299:1217–1230. doi: 10.1006/jmbi.2000.3808. [DOI] [PubMed] [Google Scholar]
- 15.Fenton MS, Lee HJ, Gralla JD. Escherichia coli promoter opening and -10 recognition: mutational analysis of σ70. EMBO Journal. 2000;19:1130–1137. doi: 10.1093/emboj/19.5.1130. [DOI] [PMC free article] [PubMed] [Google Scholar]
- 16.Schroeder LA, Choi AJ, deHaseth PL. The -11A of promoter DNA and two conserved amino acids in the melting region of σ70 both directly affect the rate limiting step in formation of the stable RNA polymerase-promoter complex, but they do not necessarily interact. Nucleic Acids Res. 2007;35:4141–4153. doi: 10.1093/nar/gkm431. [DOI] [PMC free article] [PubMed] [Google Scholar]
- 17.Young BA, Gruber TM, Gross CA. Minimal machinery of RNA polymerase holoenzyme sufficient for promoter melting. Science. 2004;303:1382–1384. doi: 10.1126/science.1092462. [DOI] [PubMed] [Google Scholar]
- 18.Barinova N, Zhilina E, Bass I, Nikiforov V, Kulbachinskiy A. Lineage-specific amino acid substitutions in region 2 of the RNA polymerase σ subunit affect the temperature of promoter opening. J Bacteriol. 2008;190:3088–3092. doi: 10.1128/JB.00008-08. [DOI] [PMC free article] [PubMed] [Google Scholar]
- 19.Ward DC, Reich E, Stryer L. Fluorescence studies of nucleotides and polynucleotides I. Formycin, 2-aminopurine riboside, 2, 6-diaminopurine riboside, and their derivatives. J Biol Chem. 1969;244:1228–1237. [PubMed] [Google Scholar]
- 20.Schroeder LA, deHaseth PL. Mechanistic differences in promoter DNA melting by Thermus aquaticus and Escherichia coli RNA polymerases. J Biol Chem. 2005;280:17422–17429. doi: 10.1074/jbc.M501281200. [DOI] [PubMed] [Google Scholar]
- 21.Schroeder LA, Karpen ME, deHaseth PL. Threonine 429 of Escherichia coli σ70 is a key participant of promoter DNA melting by RNA polymerase. J Mol Biol. 2008;376:153–165. doi: 10.1016/j.jmb.2007.11.070. [DOI] [PMC free article] [PubMed] [Google Scholar]
- 22.Wassarman KM, Saecker RM. Synthesis-mediated release of a small RNA inhibitor of RNA polymerase. Science. 2006;314:1601–1603. doi: 10.1126/science.1134830. [DOI] [PubMed] [Google Scholar]
- 23.Tomsic M, Tsujikawa L, Panaghie G, Wang Y, Azok J, deHaseth PL. Different roles for basic and aromatic amino acids in conserved region 2 of Escherichia coli σ70 in the nucleation and maintenance of the single-stranded DNA bubble in open RNA polymerase-promoter complexes. J Biol Chem. 2001;276:31891–31896. doi: 10.1074/jbc.M105027200. [DOI] [PubMed] [Google Scholar]
- 24.McClure WR. Rate limiting steps in RNA chain initiation. Proc Natl Acad Sci USA. 1980;77:5634–5638. doi: 10.1073/pnas.77.10.5634. [DOI] [PMC free article] [PubMed] [Google Scholar]
- 25.Tsodikov OV, Record MT., Jr General method of analysis of kinetic equations for multistep reversible mechanisms in the single-exponential regime: application to kinetics of open complex formation between Eσ70 RNA polymerase and λPR promoter DNA. Biophys J. 1999;76:1320–9. doi: 10.1016/S0006-3495(99)77294-2. [DOI] [PMC free article] [PubMed] [Google Scholar]
- 26.Fenton MS, Gralla JD. Roles for inhibitory interactions in the use of the −10 promoter element by σ70 holoenzyme. J Biol Chem. 2003;278:39669–39674. doi: 10.1074/jbc.M307412200. [DOI] [PubMed] [Google Scholar]
- 27.Aiyar SE, Juang YL, Helmann JD, deHaseth PL. Mutations in sigma factor that affect the temperature dependence of transcription from a promoter, but not from a mismatch bubble in double-stranded DNA. Biochemistry. 1994;33:11501–11507. doi: 10.1021/bi00204a012. [DOI] [PubMed] [Google Scholar]
- 28.Jean JM, Hall KB. 2-Aminopurine fluorescence quenching and lifetimes: Role of base stacking. Proc Natl Acad Sci USA. 2001;98:37–41. doi: 10.1073/pnas.011442198. [DOI] [PMC free article] [PubMed] [Google Scholar]
- 29.Gowher H, Jeltsch A. Molecular enzymology of the EcoRV DNA-(Adenine-N6)-Methyltransferase: Kinetics of DNA binding and bending, kinetic mechanism and linear diffusion of the enzyme on DNA. J Mol Biol. 2000;303:93–110. doi: 10.1006/jmbi.2000.4127. [DOI] [PubMed] [Google Scholar]
- 30.Reddy YVR, Rao DN. Binding of EcoP15I DNA Methyltransferase to DNA reveals a large structural distortion within the recognition sequence. J Mol Biol. 2000;298:597–610. doi: 10.1006/jmbi.2000.3673. [DOI] [PubMed] [Google Scholar]
- 31.Roy S, Lim HM, Liu M, Adhya S. Asynchronous basepair openings in transcription initiation: CRP enhances the rate-limiting step. EMBO Journal. 2004;23:869–875. doi: 10.1038/sj.emboj.7600098. [DOI] [PMC free article] [PubMed] [Google Scholar]
- 32.Sullivan JJ, Bjornson KP, Sowers LC, deHaseth PL. Spectroscopic determination of open complex formation at promoters for Escherichia coli RNA polymerase. Biochemistry. 1997;36:8005–8012. doi: 10.1021/bi970363k. [DOI] [PubMed] [Google Scholar]
- 33.Tang GQ, Patel SS. Rapid binding of T7 RNA polymerase is followed by simultaneous bending and opening of the promoter DNA. Biochemistry. 2006a;45:4947–4956. doi: 10.1021/bi052292s. [DOI] [PubMed] [Google Scholar]
- 34.Ujvari A, Martin CT. Thermodynamic and kinetic measurements of promoter binding by T7 RNA polymerase. Biochemistry. 1996;35:14574–14582. doi: 10.1021/bi961165g. [DOI] [PubMed] [Google Scholar]
- 35.Liebert K, Hermann A, Schlickenrieder M, Jeltsch A. Stopped-flow and mutational analysis of base flipping by the Escherichia coli Dam DNA-(adenine-N6)-methyltransferase. J Mol Biol. 2004;341:443–454. doi: 10.1016/j.jmb.2004.05.033. [DOI] [PubMed] [Google Scholar]
- 36.Cook VM, deHaseth PL. Strand opening-deficient E. coli RNA polymerase facilitates investigation of closed complexes with promoter DNA: effects of DNA sequence and temperature. J Biol Chem. 2007;282:21319–21326. doi: 10.1074/jbc.M702232200. [DOI] [PubMed] [Google Scholar]
- 37.Sun L, Dove S, Panaghie G, deHaseth PL, Hochschild A. An RNA polymerase mutant deficient in DNA melting facilitates study of activation mechanism: Application to an artificial activator of transcription. J Mol Biol. 2004;343:1171–1182. doi: 10.1016/j.jmb.2004.09.025. [DOI] [PubMed] [Google Scholar]
- 38.Murakami KS, Masuda S, Campbell EA, Muzzin O, Darst SA. Structural basis of transcription initiation: An RNA polymerase holoenzyme-DNA complex. Science. 2002;296:1285–1290. doi: 10.1126/science.1069595. [DOI] [PubMed] [Google Scholar]
- 39.Murakami KS, Masuda S, Darst SA. Structural basis of transcription initiation: RNA polymerase holoenzyme at 4 Å resolution. Science. 2002;296:1280–1284. doi: 10.1126/science.1069594. [DOI] [PubMed] [Google Scholar]
- 40.Vassylyev DG, Sekine SI, Laptenko O, Lee J, Vassylyeva MN, Borukhov S, Yokoyama S. Crystal structure of a bacterial RNA polymerase holoenzyme at 2.6Å resolution. Nature. 2002;417:712–719. doi: 10.1038/nature752. [DOI] [PubMed] [Google Scholar]
- 41.Saecker RM, Tsodikov OV, McQuade KL, Schlax PE, Capp MW, Record MT., Jr Kinetic studies and structural models of the association of E. coli σ70 RNA polymerase with the λPR promoter: Large scale conformational changes in forming the kinetically significant intermediates. J Mol Biol. 2002;319:649–671. doi: 10.1016/S0022-2836(02)00293-0. [DOI] [PubMed] [Google Scholar]
- 42.Sclavi B, Zaychikov E, Rogozina A, Walther F, Buckle M, Heumann H. Real-time characterization of intermediates in the pathway to open complex formation by Escherichia coli RNA polymerase at the T7 A1 promoter. Proc Natl Acad Sci USA. 2005;102:4706–4711. doi: 10.1073/pnas.0408218102. [DOI] [PMC free article] [PubMed] [Google Scholar]
- 43.Tang GQ, Patel SS. T7 RNA polymerase-induced bending of promoter DNA is coupled to DNA opening. Biochemistry. 2006;45:4936–4946. doi: 10.1021/bi0522910. [DOI] [PubMed] [Google Scholar]
- 44.Craig ML, Tsodikov OV, McQuade KL, Schlax PE, Jr, Capp MW, Saecker RM, Record MT., Jr DNA footprints of the two kinetically significant intermediates in formation of an RNA polymerase-promoter open complex: Evidence that interactions with the start site and downstream DNA induce sequential conformational changes in polymerase and DNA. J Mol Biol. 1998;283:741–756. doi: 10.1006/jmbi.1998.2129. [DOI] [PubMed] [Google Scholar]
- 45.Davis CA, Bingman CA, Landick R, Record MT, Jr, Saecker RM. Real-time footprinting of DNA in the first kinetically significant intermediate in open complex formation by Escherichia coli RNA polymerase. Proc Natl Acad Sci USA. 2007;104:7833–7838. doi: 10.1073/pnas.0609888104. [DOI] [PMC free article] [PubMed] [Google Scholar]
- 46.Burr T, Mitchell J, Kolb A, Minchin S, Busby S. DNA sequence elements located immediately upstream of the −10 hexamer in Escherichia coli promoters: a systematic study. Nucleic Acids Res. 2000;28:1864–1870. doi: 10.1093/nar/28.9.1864. [DOI] [PMC free article] [PubMed] [Google Scholar]
- 47.Liu M, Gupta G, Roy S, Bandwar RP, Patel SS, Garges S. Kinetics of transcription initiation at lacP1. Multiple roles of cyclic AMP receptor protein. J Biol Chem. 2003;278:39755–39761. doi: 10.1074/jbc.M305995200. [DOI] [PubMed] [Google Scholar]
Associated Data
This section collects any data citations, data availability statements, or supplementary materials included in this article.
Supplementary Materials
A. EMSA gel of WT and mutant RNAP stable complex binding to -11 2AP DNA after 15 seconds of incubation. A two minute heparin challenge was performed just prior to loading of samples onto a non-denaturing gel. Bands representing RNAP-bound and Free DNA are indicated. B. Fraction of RNAP-bound -11 2AP DNA graphed as a function of the WT value for each RNAP from gels such as that in A, above. The DNA concentration was at 10 nM, and the RNAP concentration at 50 nM for all reactions.
A. Abortive initiation assay gel of WT and mutant RNAP and -11 2AP DNA monitoring the ability of the complex to be able to initiate phosphodiester bond formation. RNAP and -11 2AP DNA were allowed to incubate for 15 seconds, after which heparin was added for a 2 minute challenge. A cocktail mix containing the UpA dinucleotide, UTP, and 33P-labled α-UTP was added and reactions were allowed to proceed for an additional 25 minutes before adding a urea-containing stop solution. 20% denaturing acrylamide gels were then used to separate the UpApU trinucleotide from the free radiolabeled UTP. B. Quanitification of gels such as those shown in A, above, expressed as the % of WT incorporation of the radiolabeled UTP into the UpApU trinucleotide. The DNA concentration was at 10 nM, and the RNAP concentration at 50 nM for all reactions.
Data obtained for -4 2-AP substituted promoter DNA and YW RNAP: Comparisons of single versus double exponential fits. The data were obtained and the fitting was carried out as described in the Materials and Methods. The parameters of the fits are given in inserts to the figures.
Data obtained for -4 2-AP substituted promoter DNA and Y430A RNAP: Comparisons of single versus double exponential fits. The data were obtained and the fitting was carried out as described in the Materials and Methods. The parameters of the fits are given in inserts to the figures.