

Abstract
Immortalized rat choroidal epithelial Z310 cells have the potential to become an in vitro model for studying transport of materials at blood-cerebrospinal fluid barrier (BCB) (Shi and Zheng, Brain Research 1057:37-48, 2005). This study was designed to demonstrate the presence of tight junction properties in Z310 cells and the functionality of Z310 monolayer in transport of selected model compounds. Western blot analyses revealed the presence of claudin-1, ZO-1, and occludin in Z310 cells. Transmission electron microscopy showed a “tight junction” type of structure in the sub-apical lateral membranes between adjacent Z310 cells. Real-time RT-PCR revealed that Z310 cells expressed representative transporters such as DMT1, MTP1, TfR, p-glycoprotein, ATP7A, ZnT1, ABCC1, Oat3, OCT1 and OB-Ra. Moreover, Z310 cells cultured in a two-chamber Transwell device possessed the ability to transport zidovudine (anionic drug), thyroxine (hormone), thymidine (nucleoside), and leptin (large polypeptide) with kinetic properties similar to those obtained from the in vitro model based on primary culture of choroidal epithelial cells. Taken together, these data indicate that the Z310 BCB model expresses major tight junction proteins and forms a tight barrier in vitro. The model also exhibits the ability to transport substances of various categories across the barrier.
Keywords: choroid plexus, blood-cerebrospinal fluid barrier, blood-brain barrier, Transwell transport, Z310 cell, zidovudine, thymidine, leptin, thyroxine, tight junction
Introduction
The choroidal epithelial cells constitute the blood-cerebrospinal fluid barrier (BCB). The BCB restricts the entrance of substances from the blood to the cerebrospinal fluid (CSF), actively secretes CSF, and produces and secretes various polypeptides, such as transthyretin (TTR), vasopressin, and transferrin (Strazielle and Preston, 2003; Zheng, 2001). The importance of BCB in the etiology of certain chemical-induced neurotoxicity has received increasing attention (Zheng et al., 2003). The choroidal epithelia may also play a role in clearing beta-amyloid polypeptide out of the CSF, raising the possibility that the aging process in the choroid plexus may underlie disordered homeostasis in aged brains (Crossgrove et al., 2005, 2007; Serot et al., 2003).
The progress in understanding BCB's functions in neuronal activities demands an in vitro model for mechanistic studies. Currently, the commonly recognized in vitro BCB transport system is based on primary culture of choroidal epithelia on bicameral Transwell devices (Hakvoort et al., 1998; Peraldi-Roux et al., 1990; Strazielle and Ghersi-Egea, 2005; Zheng et al, 1999). However, the impurity of cell population, the relative short lifespan, and the high animal costs have hampered the application of primary choroidal epithelial cells in basic research. To circumvent these limitations, an immortalized rat choroidal epithelial cell line, namely Z310 cells, has been created in this laboratory (Zheng and Zhao, 2002). The cells appear to possess tight barrier characteristics when cells are cultured on a permeable membrane (Shi and Zheng, 2005). Studies using real-time reverse-transcriptase (RT) polymerase chain reaction (PCR) reveal the presence of mRNAs encoding tight junction proteins such as ZO-1, -2, and -3, claudin-1, -2, -4, and -8, occludin, and connexin-32. When grown in a two-chamber Transwell device in the presence of 1 μM dexamethasone, Z310 cells are capable of forming a monolayer with the trans-epithelial electrical resistance (TEER) values (90 ± 10 Ω.cm2) and sucrose permeability (PE(sucrose): 2.6 ± 0.4 × 10⁻⁴ cm/min) highly comparable to those reported in literature. The reported in vivo TEER values define a range of 19–200 Ω.cm2 (Saito and Wright, 1984; Welch, 1975; Wright, 1972). The [14C]sucrose permeability coefficients determined from various in vitro brain barrier models vary between 2.7 and 41 × 10-4 cm/min (Dehouck et al., 1992; Franke et al., 1999; Johnson and Anderson, 1999; Lagrange et al., 1999). These comparisons suggest that the Z310 cell monolayer possesses a comparable tightness to those reported in literature. However, the protein expression of these tight junction molecules and the existence of tight junction structure have not been investigated in Z310 cells.
The ability of the choroid plexus (CP) to transport materials lends the tissue a crucial role in regulating the distribution of those physiologically and pharmacologically important substances in the brain. Over the last several decades, cumulative evidences have shown that the CP possesses a variety of receptors and transporters that are essential to move substances across the BCB, including organic anion transporters (e.g., Oat3), organic cation transporters (e.g., OCT1), ABC (ATP-binding cassette) transporters (e.g., multi-drug resistance protein-1: Mdr1 or p-glycoprotein), metal transporters (e.g., divalent metal transporter-1: DMT1, metal transport protein-1: MTP1, ATPase7A, zinc transporter-1: ZnT1), metal carrier protein transporters (e.g., transferrin receptor: TfR), peptide transporters (e.g., the short form of the leptin receptor: OB-Ra, transthyretin receptor: TTR), and nucleotide and nucleoside transporters (e.g., Na+-dependent transport system) (for detailed information, readers are referred to a monograph by Zheng and Chodobski, 2005). Thus, to use Z310 cells for construction of in vitro transport model, it is imperative to investigate the presence of these common transporters in this cell line.
The BCB has also been shown to participate in the transport of various classes of drugs, nutrients, hormones, and certain large molecular weight polypeptides. For examples, anti-HIV drug zidovudine (AZT), an anionic molecule, is rapidly cleared from the CSF. Evidence suggests that AZT crosses the BCB actively from the CSF to blood by a transport system that is sensitive to probenecide (an inhibitor to organic anion transporter), suggesting that the process is organic anion transporter-mediated (Wong et al., 1993). Thymidine, a nucleoside, is believed to utilize the sodium-dependent nucleoside transporter present in the choroid plexus for its entry into the brain (Spector and Berlinger, 1982). Thyroxine, a major transport form of thyroid hormone, is transported into the CSF by the CP (Dratman et al., 1991; Schreiber et al., 1990; Zheng et al., 1999). The short form of the leptin receptor (OB-Ra) is richly expressed in cerebral vascular endothelia as well as in choroidal epithelia (Bjorbaek et al, 1998), which transports leptin, an adipocyte-secreted polypeptide energy homeostasis hormone with molecular weight of 16 kDa, to the targeted brain areas. Based on in situ brain perfusion studies, the CP displays the highest uptake rate of leptin compared to other brain regions (Kurrimbux et al., 2004). These studies suggest a definite capacity of the BCB in transport of diverse categories of substances.
To validate the feasibility of using Z310 cells to establish in vitro BCB transport model, we conducted experiments (i) to validate the expression of major tight junction proteins by Z310 cells, (ii) to investigate the presence of typical transporters in this cell line; and (ii) to compare the transport kinetics of exemplary molecules such as AZT, thymidine, thyroxine and leptin between in vitro models based on Z310 and cultured primary choroidal cells. In addition, the tight junction structure between adjacent Z310 cells was examined by transmission electron microscopy (TEM).
Materials and methods
Materials
Chemicals were obtained from the following sources: Dulbecco's modified essential medium (DMEM), fetal bovine serum (FBS), insulin, transferrin, sodium selenite, fibroblast growth factor, albumin, penicillin, streptomycin, and gentamycin from Gibco (Grand Island, NY); antibiotic solution (100 ×), cis-hydroxyproline, L-glutamine, epidermal growth factor (EGF), collagen solution (type I), laminin, EGTA, EDTA, sodium vanadate, NaF, etaglycerolphosphate, phenylmethylsulfonyl fluoride (PMSF), 2-mercaptoethanol (2-ME), Triton X-100, NaCl, SDS, Trislaminin, glutaraldehyde, cacodylate, sucrose, osmium tetroxide, uranyl acetate, and lead citrate from Sigma (St. Louis, MO); dexamethasone from Calbiochem (San Diego, CA); polyclonal rabbit anti-claudin-1, anti-claudin-2, anti-occludin, and anti-ZO-1 from Zymed (San Francisco, CA); goat anti-rabbit IgGs conjugated with HRP (horseradish peroxidase) and ECL detection system from Amersham Biosciences; Fluor Alexa-488 conjugated goat anti-rabbit IgG from Molecular Probes (Eugene, OR); RNeasy mini kit and RNase-free DNase set from Qiagen (Valencia, CA); MgCl2 solution, PCR buffer, dNTP, Oligo dT and MuLV reverse transcriptase from Applied biosystems (Foster city, CA); absolute QPCR Sybr Green Mix from ABgene (Rochester, New York); DEPC water and Trizol reagent from Invitrogen (Carlsbad, CA); Transwell-COL culture wells from Costar (Cambridge, MA); and Lab-Tek chambered slides from Lab-Tek (Rochester, NY). [14C]Sucrose, [14C]AZT, [14C]inulin and [3H]thymidine were purchased from Moravek Biochemicals (Brea, CA) and [125I]Leptin and [125I]thyroxine from PerkinElmer Life Sciences (Boston, MA). All the radiolabeled compounds were used within two weeks from the date of arrival.
Cultures of primary and Z310 choroidal epithelial cells
Z310 choroidal epithelial cells were cultured as previously described (Zheng and Zhao, 2002). Briefly, cells were grown in DMEM supplemented with 10% FBS, 100 U/mL penicillin, 100 μg/mL streptomycin, and 40 μg/mL of gentamycin in a humidified incubator with 95% air-5% CO2 at 37 °C. The cells were passaged (1:12-16) twice a week. Primary choroidal epithelial cells were cultured using the method established in this laboratory (Zheng et al., 1998). In brief, the choroid plexuses from Sprague–Dawley rats (4–6 weeks old) (Harlan, Indianapolis, IN) were dissected and digested in HBSS containing 0.2% pronase at 37 °C for 5 min. The dissociated cells were washed and re-suspended in growth medium consisting of DMEM supplemented with 10% FBS and 10 ng/mL EGF. The cells were plated in 35-mm Petri dishes at a density of 1-2 × 10⁵ cells/mL and cultured in a humidified incubator with 95% air-5% CO2 at 37 °C. The growth medium was refreshed 3 days after the initial plating and every 2 days thereafter. The culture displays a dominant polygonal phenotype of epithelial cells for at least 7-10 days. At confluence, the cells were harvested and transferred to the Transwells for TEER measurement and transport assays described below. The protocol that involves use of animals for primary cultures was approved by the Animal Care and Use Committee of Purdue University.
Cultures in Transwell transport device
Transwell device is composed of two chambers which are separated by an insert with the porous polyester membrane on its bottom. Z310 or primary choroidal epithelial cells were seeded on the porous polyester membrane. The compartment in the insert is defined as the inner chamber, also known as the apical chamber. The inner chamber is immersed in the outer chamber. When a chemical is added to the inner chamber and measured in the outer chamber, i.e., transport from the inner to the outer chamber, the experiment is referred to as an efflux study. Vice versa, when a chemical is added to the outer and determined in the inner chamber, it is named as an influx study. Prior to cell seeding on the Transwell device, the porous polyester membranes attached to the inner chamber were pre-coated with 0.01% collagen for 4-5 hr, followed by UV irradiation overnight. Aliquots (0.9 mL) of cell suspensions (Z310, or primary choroidal epithelial cells) containing 2.0 × 10⁵ cells were added to the inner chamber, which was inserted into the outer chamber containing 1.3 mL of the same culture medium. A cell monolayer was usually formed 3-5 days after seeding. For Z310 cells, the culture medium was the complete growth medium containing 1 μM dexamethasone (Shi and Zheng, 2005). For primary choroidal epithelial cells, the culture medium was DMEM containing 10% FBS, antibiotics, and 10 ng/mL EGF. The media were refreshed every the other day after seeding.
The formation of cell monolayer was judged by three criteria: (1) the cells formed a confluent monolayer without visible spaces between cells under a light microscope; (2) the height of the culture medium in the inner chamber had to be at least 2 mm higher than that in the outer chamber for at least 24 h; and (3) a constant TEER value across the cell layer was obtained (90 ± 10 Ω.cm2 for Z310 cells and 70 ± 5 Ω.cm2 for primary choroidal epithelia) (Shi and Zheng, 2005). The cultures that reached the confluence were used in the transport studies.
Western blot of claudin-1, ZO-1, and occluding in Z310 cells
Total proteins were isolated from Z310 cells. Kidney, liver, or CP tissues were selected as positive controls as recommended by the manufacturer of the antibodies (Zymed, San Francisco, CA). In order to obtain enough amount of protein to be used in the immunoprecipitation, Z310 cells cultured in regular T-75 flask or tissues were lysed in 1 mL of homogenization buffer supplemented with protease inhibitors. After a 30 min rocking incubation on ice (to solublize the membrane-bound fraction of TJ proteins) and sonication at duty cycle 20% and output power 4∼6 for 25 pulses (1 s/pulse) using Sonifer Model 250, the homogenates were centrifuged at 10,000g for 20 min at 4 °C. The supernatant was collected as the total protein preparation and stored in -70 °C until use. Protein concentration was determined by Bradford method. One mg of total proteins was immunoprecipitated by sequentially incubating with 1-10 μL (0.2-2 μg) primary antibodies for 1-2 h at 4 °C and 20 μL of appropriate Protein A-Agarose on a rotating device for 1 h to overnight. Immunoprecipitates were then resolved by SDS-PAGE using 4-20% polyacrylamide gradient gels (Bio-Rad) and transferred onto polyvinylidene difluoride (PVDF) membranes. The membranes were incubated with primary rabbit polyclonal antibodies (anti-claudin-1, 1:200, anti-occludin, 1:250, or anti-ZO-1, 1:250) and secondary antibody goat anti-rabbit IgG conjugated with HRP (horseradish peroxidase) (1:2000). The bands were visualized using the ECL detection system.
Transmission electron microscopic studies
Z310 cells were grown on a collagen-precoated polyester filter membrane in the inner chamber of a Transwell apparatus (2 × 10⁵ cells per well). At the different stages of cell growth, the membrane along with the cells was removed from the inner chamber, fixed with 2.5% glutaraldehyde in 0.1 M cacodylate buffer, pH 7.3 overnight, washed briefly with 8% sucrose in 0.1 M cacodylate buffer. After fixation with 2% osmium tetroxide in 0.1 M cacodylate buffer for 1 h, the sample was block-stained for 1 h with 1% uranyl acetate in distilled water. Following dehydration with graded ethanol solutions, the sample was embedded in Polybed/Araldite (Poly-sciences, Warrington, PA) Epon 812. The ultrathin sections were cut either horizontally or vertically using ultra-microtome. Sections, on a 150 square meshes grid covered with formvar, were stained with uranyl acetate followed by lead citrate, and examined under an electron microscope.
Quantitative real-time RT-PCR analyses of representative transporter mRNAs
The transcription of the genes encoding typical transporters was quantified using real-time RT-PCR as described by Walker (Walker, 2001). Briefly, total RNA was isolated from Z310 cells cultured on Transwells and choroid plexus tissues (as controls) using TRIzol reagent (Invitrogen, Carlsbad, CA), which was further purified using RNeasy columns (Qiagen, Palo Alto, CA). Purified RNA (1 μg) was reverse transcribed with MuLV reverse transcriptase and oligo dT primers. The forward and reverse primers for target genes were designed using Primer Express 2.0 software (Applied Biosystems, Foster City, CA). The ABsolute QPCR SYBR green Mix kit (ABgene, Rochester, New York) was used for real-time RT-PCR analyses. The amplification was carried out in the Mx3000P Real-Time PCR System (Stratagene, La Jolla, CA). Amplification conditions were 15 min at 95 °C, followed by 40 cycles of 30 sec at 95 °C, 1 min at 60 °C and 30 sec at 72 °C. All the primers for real-time RT-PCR analyses were synthesized by Sigma (St. Louis, MO) and the sequences are listed in Table 1.
Table 1.
Primer sequences for quantitative real-time RT-PCR analyses of mRNA expression of tight junction proteins and typical transporters
| Name | Accession number | Forward primer | Reverse primer |
|---|---|---|---|
| TfR (+IRE) | M58040 | ctagtatcttgaggtgggaggaagag | gagaatcccagtgagggtcaga |
| Mdr1b | L16546 | gaggcagcttggtgtaagaatagg | gcaacgtctctaccactgagctaa |
| ZnT1 | U17133 | aggagtggaggaagtccatgagt | gccacctgcatgtatgaagct |
| ATP7A | NM_052803 | ccctcaacagcgtcgtcact | gactagcagcatccccaaagg |
| Oat3 | AB017446 | gaggacctgtgattggagaactg | ctggctgccagcatgagata |
| Oct1 | U76379 | tcctgctgacctgaagatgct | gaacaggtcggcaaacgaa |
| Mrp1 | NM_022281 | gcttctggcaccacttgtga | ctctggcttggctctataaatgtg |
| OB-Ra | D85557 | gatgcagggctgtatgtcattg | agtccttgtgcccaggaaca |
| DMT-1 | NM_013173 | cttgggttggcagtgtttga | agtattgccaccgctggtatct |
| MTP-1 | AF394785 | ccacctgtgcctcccagat | cccatgccagccaaaaatac |
| GAPDH | NM_017008 | cctggagaaacctgccaagtat | agcccaggatgccctttagt |
Note: The sequence of the primers was determined using Primer Express 2.0 software (Applied Biosystems, Foster City, CA).
Transwell transport studies
[14C]Sucrose and [14C]inulin were used as paracellular space markers. If the model compounds were labelled with isotopes other than 14C, co-transports of model compounds and the paracellular space markers were conducted on the same sets of Transwells. Otherwise, the transport experiments were separately conducted on parallel sets of Transwell chambers, which had similar TEER values, for compounds or paracellular markers. To limit the confounding effects on transport kinetics due to the difference in molecular weights of the model and paracellular space marker, [14C]Sucrose (MW: 342.3) was used as the paracellular space marker for AZT, thymidine, and thyroxine studies, and [14C]inulin (MW: ∼5,000) used for leptin study.
All transport experiments were performed in serum-free medium (SFM) (Zheng et al., 1999) at 37 °C. The 10-day or 12-day cultures of Z310 cells or primary choroidal epithelia were rinsed with pre-warmed SFM before they were used in the transport studies. To study the efflux transport of azidothymidine (AZT) from the inner to outer chamber, aliquots (3.6 μL) of [14C]AZT (specific activity: 53 mCi/mmol; concentration: 0.1 mCi/mL) or 4.5 μL of [14C]sucrose solution (in 2% ethanol, specific activity: 495 mCi/mmol; concentration: 0.1 mCi/mL) was added into the inner (apical, donor) chamber to the final concentration of 7.5 μM for AZT and 1.0 μM for sucrose. At time “0”, an aliquot (25 μL) of SFM was taken from the inner chamber. Thereafter, at 6, 15, 30, 45, 60, 75, and 90 min, aliquots (100 μL) of SFM were taken from the outer (basal, receiver) chamber and replaced with 100 μL of pre-warmed SFM to keep constant hydrostatic pressure during the whole experiment. All the aliquots were mixed with 6.0 mL scintillation cocktail (Eco-lite) and counted with a Packard Tri-Carb 2900 TR liquid scintillation analyzer (counting efficiency for [14C]sucrose: 95%). The actual radioactivity in the receiver chamber was corrected for sampling. The paracellular permeability was calculated as described in the following section.
To examine the influx transport of thymidine from the outer to inner chamber, aliquots of 28.6 μL of [3H]thymidine (specific activity: 22 Ci/mmol; concentration: 1.0 mCi/mL) and 6.4 μL of [14C]sucrose solution were added in the same outer chamber to the final concentrations of 5.0 μM and 1.0 μM for thymidine and sucrose, respectively. At time “0”, an aliquot of 25 μL of SFM was taken from the outer chamber. At 6, 15, 30, 45, 60, 75, and 90 min after the onset of the experiment, aliquots (25 μL) of SFM were sampled from the inner chamber. All the samples were similarly processed and counted as described above (counting efficiency for [3H]thymidine: 67%).
To study the influx of thyroxine, aliquots of 0.51 μL of [125I]thyroxine (specific activity: 969 Ci/mmol; concentration: 320 μCi/mL) and 6.4 μL of [14C]sucrose solution were added to the same outer chamber to final concentrations of 0.13 nM and 1.0 μM for thyroxine and sucrose, respectively. At time “0”, an aliquot of 20 μL SFM was taken from the outer chamber. Thereafter, at 30 s, 5, 15, 30, 45, 60, 75, 90 min, 3, 6, 12, 24, 36, and 48 hr, aliquots of 20 μL SFM were taken from the inner chamber and replaced with 20 μL of pre-warmed SFM. Similarly, all the samples were counted for radioactivities (counting efficiency for [125I]thyroxine: 73%).
To investigate the influx transport of leptin, aliquots of 34.3 μL of [125I]leptin (specific activity: 2200 Ci/mmol; concentration: 41.7 μCi/mL) and 10 μL of [14C]inulin (specific activity: 20800 Ci/mmol; concentration: 80.1 Ci/mL) were added to the same outer chamber to the final concentration of 0.5 nM and 30 μM for leptin and inulin, respectively. At time “0”, an aliquot of 25 μL SFM was taken from the outer chamber. At 30 s, 5, 15, 30, 45, 60, 75, 90 min, 3, 6, 12, 24, 36, and 48 hr after the onset of the experiment, aliquots of 50 μL SFM were taken from the inner chamber and replaced with 50 μL of pre-warmed SFM. Samples were counted for radioactivities (counting efficiency for [125I]leptin: 35% and for [14C]inulin: 48%).
Calculation of transport parameters
To determine the transport coefficients across the cellular monolayer, the data within the linear range were used for linear regression analyses. The slope (mg/mL-min) of each dataset was used to calculate the total and blank permeability coefficients in Eq. 1,
| (Eq. 1) |
Where PT represents the total permeability coefficient (cell monolayer + membrane + coating, cm/min); PB, the blank permeability coefficient (membrane + coating, cm/min); VR, volume of media in the receiver chamber; A, surface area of transport membrane (1.1 cm2); CD, concentration of radiolabeled compounds in donor chamber (mg/mL); CR, concentration of radiolabeled compounds in receiver chamber (mg/mL). The permeability coefficients of epithelial barrier (PE) are then obtained from the Eq. 2 (Zheng and Zhao, 2002; Strazielle and Preston, 2003),
Where PE is the permeability coefficient of epithelial barrier.
Statistical analysis
Statistical comparisons were made using one-way ANOVA (Prism 4.0, GraphPad software Inc., San Diego, CA) or Student's t-test. P < 0.05 was considered statistically significant. Linear regression analyses were performed using Prism 4.0. The quality of fits was determined by evaluating correlation coefficient (γ2). Data were reported as mean ± SD.
Results
Qualitative expression of claudin-1, ZO-1, and occludin proteins in Z310 cells
Western blot analyses using specific antibodies against claudin-1, ZO-1, and occludin confirmed that Z310 cells expressed claudin-1, occludin, and ZO-1 (Fig. 1A, 1B, and 1C). The results are consistent with our previous real-time RT-PCR and immunocytochemistry results (Shi and Zheng, 2005). However, claudin-2 was not detected in Z310 cells by Western blot (data not shown), although the transcripts were previously found in a low expression level by real-time RT-PCR (Shi and Zheng, 2005).
Figure 1.
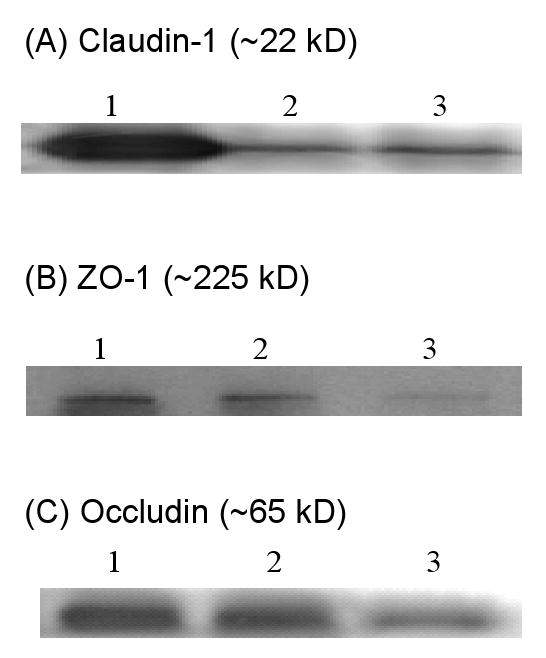
Presence of claudin-1, ZO-1, and occludin proteins in Z310 cells by Western blot. Cell homogenates were immunoprecipitated and electrophoresized. Tissue extracts were directly electrophoresized. Results were not qualitative. (A). Claudin-1: lane 1, kidney extract as the positive control (40 μg); lane 2-3, Z310 cell immunoprecipitates. (B). ZO-1: lane 1-2, Z310 cell immunoprecipitates; lane 3, rat choroid plexus tissue extract as the positive control (40 μg). (C). Occludin: lane 1-2, Z310 cell immunoprecipitates; lane 3, liver extract as the positive control (40 μg).
Visualization of tight junctions between adjacent Z310 cells by TEM
Z310 cells grown on the inner chamber membrane underwent TEM examination. A “tight junction” type of structure was identified at the subapical lateral membranes between two adjacent cells (8000 X) (Fig. 2A). Also, a microvillus type of structure was seen on the surface of Z310 cell monolayer (1000 X) (Fig. 2B), suggesting a secretory and/or absorption function of Z310 epithelial cells.
Figure 2.
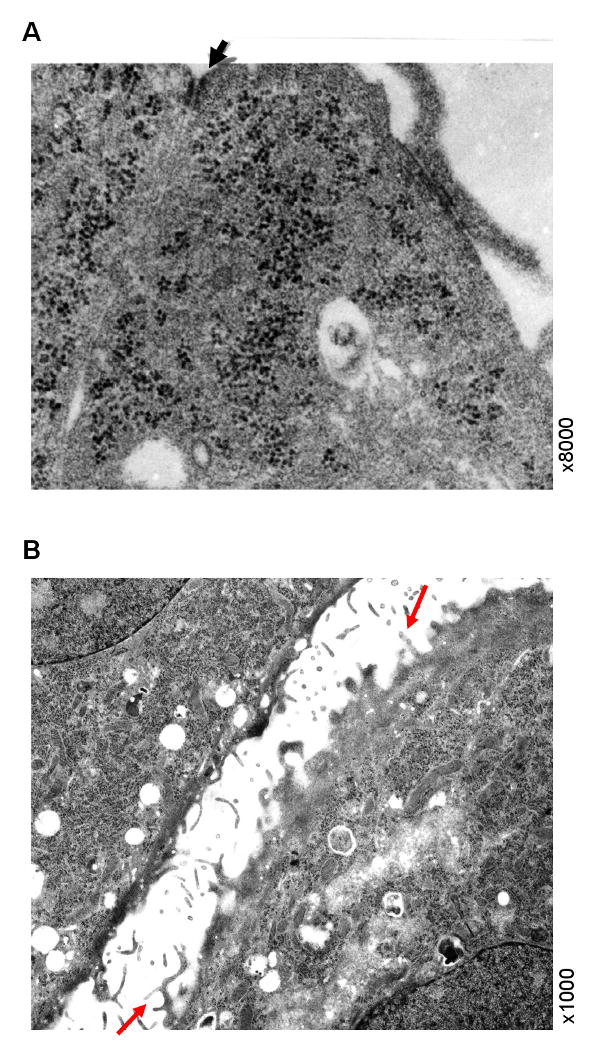
Presence of “tight junction” type of structure between adjacent Z310 cells by TEM. Panel A illustrates a cell-to-cell contact site at confluence by high magnification (8000×). Z310 cells were grown on a collagen-precoated polyester filter membrane in the inner chamber of a Transwell apparatus and fixed with 2.5% glutaraldehyde. The arrowhead indicates a “tight junction” type of structure in the subapical region along adjacent lateral membranes. Panel B illustrates the presence of microvilli on apical surface of Z310 cells prior to the formation of monolayer barriers. The arrows indicate the microvillus structures on the surface of Z310 cells (1000×).
mRNA expression of representative transporters in Z310 cells
Real-time RT-PCR analyses revealed detectable levels of mRNAs encoding typical transporters in Z310 cells, such as DMT1, MTP1, TfR (+IRE), Mdr1b, ATP7a, ZnT1, ABCC1, Oat3, OCT1, and OB-Ra, in Z310 cells (Table 2). The relative differences between the Z310 cells and the choroid plexus tissue were compared after the data were normalized to GAPDH in the same samples. Data showed that mRNA levels of DMT1, Mdr1b, Oat3, and OB-Ra in choroid plexus tissue were significantly higher than those in Z310 cells when cultured regularly on 6-well plate. Our previous studies have also demonstrated that Z310 cells possess both DMT-1 and TTR proteins (Zheng & Zhao, 2002; Wang, et al. 2006).
Table 2.
Comparison of mRNA expression levels of typical transporters between Z310 cells and rat choroid plexus tissue
| Transporters | Z310 Cells | Choroid Plexus Tissue |
|---|---|---|
| DMT1 | 100 ± 12.5 | 395.5 ± 66.4*** |
| MTP1 | 100 ± 30 | 118 ± 46 |
| TfR (+IRE) | 100 ± 17.9 | 112 ± 24.7 |
| Mdr1b | 100 ± 12.5 | 298.5 ± 117.8* |
| ATP7a | 100 ± 38.4 | 112.1 ± 36.8 |
| ZnT1 | 100 ± 42.5 | 135.4 ± 31.5 |
| ABCC1 | 100 ± 31.4 | 115.3 ± 20.7 |
| Oat3 | 100 ± 33.4 | 6510 ± 3022*** |
| OCT1 | 100 ± 20.3 | 112.8 ± 23.5 |
| OB-Ra | 100 ± 9.5 | 3776 ± 235.3*** |
All transporter mRNA expression was normalized to that of GAPDH in the same samples. The expression in Z310 cells was arbitrarily set as 100%. Data represent mean ± SD (n=4).
p<0.05,
p<0.001 as compared to controls.
Efflux transport of [14C]AZT by Z310 and primary CP transport model
Transport studies were performed after cell cultures reached the confluence using parallel sets of Transwells with similar TEER values (for Z310 model, TEER value was 90 ± 10 Ω.cm2; for primary CP model, TEER value was 70 ± 5 Ω.cm2.). Linear ranges of each dataset were decided by statistically testing fitness of the linear equation, as indicated in Fig. 3A (for paracellular space marker, sucrose) and Fig. 3B (for model compound, AZT). The validity of linear relationship was further evaluated by linear regression analyses of the coefficients of determinations. Resulting slopes were used to calculate the permeability coefficients (PT, PB, and PE). In general, PE values of [14C]sucrose were about 2.5-3 fold higher in primary CP model than in Z310 model (Table 3), indicating that the cell barrier formed in the primary CP model appeared to be more permeable than that derived in the Z310 model. When the ratios of efflux coefficients of AZT to sucrose were compared, no significant difference was found between the Z310 model and the primary CP model (p = 0.28). Noticeably, both models transported AZT from the inner to the outer chamber significantly faster than the paracellular space marker sucrose (p<0.01), suggesting active and/or transcellular transport processes involving in AZT transport from the CSF to blood by the CP.
Figure 3.

Transport kinetics of [14C]AZT efflux at BCB. Parallel sets of Transwells with similar TEER values (for Z310 model, TEER value was 90 ± 10 Ω.cm2; for primary CP model, TEER value was 70 ± 5 Ω.cm2) were used for either [14C]sucrose (A) or [14C]AZT (B). CR/CD represents the ratio of the chemical concentrations in the receiver chamber to that in the donor chamber. Linear ranges were decided by statistical analyses of linear model fitting as well as linear regression. The resulting slopes (ΔCR/CD·Δt) were used in Eq. 1 for calculation of permeability coefficients (PB or PT), the values of which are presented in Table 3.
Table 3.
Permeability coefficients (PE) (×10-4 cm/min) of representative compounds transported by Z310 cell model and primary CP model, in vitro
| Z310 Model | Primary CP Model | PE(primary)/PE(Z310) | |
|---|---|---|---|
| [ 14C]AZT Efflux | |||
| PE(AZT) | 6.7 ± 0.4*** | 17.4 ± 0.7** | 2.6 |
| PE(sucrose) | 4.2 ± 0.1 | 12.4 ± 0.6 | 2.9 |
| PE(AZT)/PE(sucrose) | 1.6 ± 0.1 | 1.4 ± 0.1 | |
| [3H]Thymidine Influx | |||
| PE(TMD) | 3.2 ± 0.4* | 28 ± 7.0* | 8.8 |
| PE(sucrose) | 2.6 ± 0.1 | 19 ± 3.0 | 7.3 |
| PE(TMD)/PE(sucrose) | 1.3 ± 0.2 | 1.4 ± 0.4 | |
| [125I]Thyroxine Influx | |||
| PE(T4) | 6.8 ± 0.2*** | 44 ± 5.0* | 6.5 |
| PE(sucrose) | 3.6 ± 0.3 | 19 ± 3.0 | 5.3 |
| PE(T4)/PE(sucrose) | 1.9 ± 0.1 | 2.3 ± 0.3 | |
| [125I]Leptin Influx | |||
| PE(Leptin) | 0.54 ± 0.30*** | 36 ± 0.3** | 67 |
| PE(Inulin) | 1.28 ± 0.02 | 82 ± 0.7 | 64 |
| PE(Leptin)/PE(Inulin) | 0.42 ± 0.02 | 0.44 ± 0.04 | |
Data represent mean ± SD, n=3-6.
p<0.05,
p<0.01,
p<0.001 as compared to PE values of space markers (either sucrose or inulin) in the same models.
Influx transport of [3H]thymidine and [125I]thyroxin by Z310 and primary CP model
Co-transport studies of [3H]thymidine and [14C]sucrose or [125I]thyroxine and [14C]sucrose were conducted in both cell models (Fig. 4). Again, the permeability coefficients for sucrose (Fig. 4A) were significantly higher in the primary CP model than those in the Z310 model. By comparing PE values of [3H]thymidine (Fig. 4B) or [125I]thyroxine (Fig. 4C) against [14C]sucrose, both in vitro models transported thymidine and thyroxine from the outer to the inner chamber significantly faster than they transported space marker sucrose. The ratios of PE values of thymidine/sucrose or thyroxine/sucrose were not significantly different between two barrier models (Table 3).
Figure 4.

Transport kinetics of [3H]thymidine and [125I]thyroxine influx at BCB. Same sets of Transwells were used for co-transportf of [3H]thymidine and [14C]sucrose or of [125I]thyroxine and [14C]sucrose transport studies. Panel A presents the transport of sucrose. Panel B and C depicts the transport kinetics of thymidine and thyroxine, respectively. The values of permeability coefficients are presented in Table 3.
Influx transport of [125I]Leptin by Z310 and primary CP model
Similar to the above influx studies, co-transports of [125I]leptin and [14C]inulin were conducted on the same sets of Transwells (Fig. 5). The permeability of the primary CP model to tested molecules was much higher than that of the Z310 cells. While the ratio of PE(leptin) to PE(inulin) was not significantly different between two barrier models, the leptin molecules passing through both models appeared at a significantly slower rate than the paracellular space marker inulin (p<0.01) (Table 3).
Figure 5.

Transport kinetics of [125I]leptin influx at BCB. (A) [14C]inulin. (B) [125I]leptin. Same sets of Transwells were used for both [125I]leptin and [14C]inulin transport studies. The values of permeability coefficients are presented in Table 3.
Discussion
The current study using Western blot and TEM demonstrated that Z310 cells not only expressed three typical tight junction proteins, namely, claudin-1, ZO-1, and occludin, but also formed a likely “tight-junction” type of structure between adjacent cells. Furthermore, the presence of microvilli on the cell surface of Z310 cells, when the cells were cultured on the polyester membranes of the Transwells, suggested a secretory and/or absorption function of Z310 epithelial cells. Together with our previous real-time RT-PCR and immunocytochemistry studies (Shi and Zheng, 2005), our data provide the strong evidence for the presence of tight junctions in the Z310 model.
For Z310 cells to be used as a BCB transport model, the cells should express common transporters that are known to be present in the CP tissues. About ten extensively studied transporters were investigated in this study. The transferrin receptor (TfR) is present on capillary vascular endothelial cells and choroidal epithelial cells and mediates the uptake of ferric iron into the cells via receptor-mediated endocytosis (Li et al., 2005; Moos et al., 2000). The divalent metal-ion transporter I (DMT1) is responsible for transporting divalent metal ions (Fleming et al., 1997; Gunchin et al., 1997). The metal transport protein-1 (MTP1, ferroportin) is another metal transporter known to expel metal ions out of the cells (McKie et al., 2000; Wu et al., 2004). Recent studies also show that the CP possesses ATP7A transporter, which controls the copper trafficking between the blood and CSF (Mercer and Llanos, 2003). The expression of Zn-transporter-1 (ZnT1) in rat choroidal epithelium has been verified by immunohistochemistry (Wang et al., 2004), which regulates intracellular Zn2+ by acting as a zinc ion efflux pump (Sekler et al., 2002). The CP also possesses the transporters responsible for transport of organic chemicals, such as multi-drug resistance protein-1 (MRP1) (Rao et al., 1999; Wijnholds et al., 2000), organic anion transporter (Oat3) (Nagata et al., 2002), and organic cation transporter-1 (OCT1) (Sweet et al., 2001). The current study clearly demonstrated the presence of all these transporters in Z310 cells. Noticeably, the mRNA levels of Oat3 and OB-Ra were substantially lower in Z310 cells than in the CP tissue, the fact that may be considered when the Z310 Transwell model is used for the substrates transported by these transporters.
To verify the functionality of the Z310 model in transport of substances, four organic chemicals whose mechanisms of transport have been extensively studied by other investigators were chosen to compare their transport kinetics between in vitro models based on Z310 cells or cultured primary epithelial cells. Overall, the permeability coefficients for all tested molecules were greatly higher in the transport model derived from primary CP cells than that based on Z310 cells. Thus, it appears that the in vitro cellular monolayer of primary CP cells is more permeable than that of Z310 cells. By comparing PE values between model compounds and space markers, both in vitro transport models appeared to be capable of actively and/or transcellularly transporting AZT, thymidine and thyroxine across the barrier, since PE values of model compounds were significantly higher than those of space markers. Moreover, by comparing the ratios of PE(model compound)/PE(space markers) between two transport systems, it is apparent that two model systems operated in a highly comparable fashion as none of these ratios were statistically significantly different.
AZT, as an organic anion, is reportedly to be actively removed by the CP (Masereeuw et al, 1994; Thomas and Segal, 1997; Wu et al., 1998). A study by Strazielle et al. (2003) suggests that the efflux of AZT from the CSF to blood is associated with an apical (CSF-facing) carrier belonging to the solute carrier (Slc) 22 family of organic anion transporters. The results of our in vitro studies support an active and/or transcellular clearance of AZT by the CP. It should be noted, however, that Z310 cells expressed much less Oat3 mRNA than the CP tissue; further this reduced expression did not seem to affect the transport kinetics of AZT by Z310 model in comparison to primary CP model. Thus, the efflux of AZT may not be entirely modulated by Oat3.
Thymidine and thyroxine are known to be transported from the blood to the CSF by the CP (Schreiber et al., 1990; Spector and Berlinger, 1982). The current transport data from both Z310 and primary CP models support the involvement of active and/or transcellular transport systems in influx transport of thymidine and thyroxine by the CP. Earlier studies from this laboratory demonstrate that thyroxine may bind to transthyretin in the CP; a unidirectional secretion of transthyretin to the CSF may drive thyroxine molecule to the CSF (Zheng et al., 1999; 2003b). Exposure to toxic metal lead may inhibit the production and secretion of transthyretin in the CP, leading to an altered thyroxine transport at the BCB (Zheng et al., 1996, 1999, 2003a). It would be interesting to further validate if lead exposure alters thyroxine transport by using the Z310 transport model.
Leptin is a large molecular weight protein and reportedly transported by the CP (Kurrimbux, 2004). The kinetic data from space marker inulin suggested a more abundant leakage of primary CP model than Z310 cell model; yet the overall ratio of PE(leptin) to PE(inulin) was not statistically different between two model systems. The amounts of leptin transported by both models proportionally correlate with the abundance of OB-Ra in these models, confirming the important role of OB-Ra in transporting leptin across the BCB reported earlier (Bjorbaek et al, 1998). An alternative explanation would be that the lesser amount of leptin transported to the inner (acceptor) chamber by Z310 cells than by primary cells could be due to a leptin tighter binding or cellular sequestration by Z310 cells.
In summary, choroidal epithelial Z310 cells possess tight junction proteins and express “tight junction” type of structure under TEM. This BCB cell line also expresses typical transporters known to transport metals and organic chemicals. When grown on a Transwell chamber, the monolayer of Z310 cells appears to form a tighter barrier than the cultured primary choroidal epithelia. The Z310 cell transport model is capable of transporting model chemicals representative of organic anions, nucleosides, hormones, and large-molecular-weight peptides. Taken together, the Z310 cell-based in vitro BCB model may be useful for pharmacological and toxicological studies of material transport at the BCB. The limitations of this model system are its relatively low TEER values in comparison to other in vitro barrier models based on renal MDCK cells or brain endothelial cells, lack of a comprehensive understanding of many other transports or systems in the cells, and incomplete knowledge on its application in drug/toxicant transport. All these warrant further exploration.
Acknowledgments
This study was supported in part by NIH/National Institute of Environmental Health Science Grants ES013118 and ES08146, and Lilly Research Foundation.
Abbreviations
- CSF
cerebrospinal fluid
- BCB
blood-CSF barrier
- CP
choroid plexus
- Oat3
organic anion transporter-3
- OCT1
organic cation transporter-1
- Mdr1or p-glycoprotein
multidrug resistance protein-1
- DMT1
divalent metal transporter-1
- MTP1
metal transport protein-1
- ZnT1
zinc transporter-1
- TfR
transferrin receptor
- OB-Ra
the short form of the leptin receptor
- AZT
zidovudine
Footnotes
Publisher's Disclaimer: This is a PDF file of an unedited manuscript that has been accepted for publication. As a service to our customers we are providing this early version of the manuscript. The manuscript will undergo copyediting, typesetting, and review of the resulting proof before it is published in its final citable form. Please note that during the production process errors may be discovered which could affect the content, and all legal disclaimers that apply to the journal pertain.
References
- Bjorbaek C, Elmquist JK, Michl P, Ahima RS, van Bueren A, McCall AL, Flier JS. Expression of leptin receptor isoforms in rat brain microvessels. Endocrinology. 1998;139:3485–3491. doi: 10.1210/endo.139.8.6154. [DOI] [PubMed] [Google Scholar]
- Crossgrove JS, Li GJ, Zheng W. The choroid plexus removes beta-amyloid from the cerebrospinal fluid. Experimental Biology and Medicine. 2005;230:771–776. doi: 10.1177/153537020523001011. [DOI] [PMC free article] [PubMed] [Google Scholar]
- Crossgrove JS, Smith EL, Zheng W. Macromolecules involved in production and metabolism of beta-amyloid at the brain barriers. Brain Research. 2007;1138:187–95. doi: 10.1016/j.brainres.2006.12.022. [DOI] [PMC free article] [PubMed] [Google Scholar]
- Dehouck MP, Jolliet-Riant P, Bree F, Fruchart JC, Cecchelli R, Tillement JP. Drug transfer across the blood– brain barrier: correlation between in vitro and in vivo models. Journal of Neurochemistry. 1992;58:1790–1797. doi: 10.1111/j.1471-4159.1992.tb10055.x. [DOI] [PubMed] [Google Scholar]
- Dratman MB, Crutchfield FL, Schoenhoff MB. Transport of iodothyronines from bloodstream to brain: contributions by blood:brain and choroid plexus:cerebrospinal fluid barriers. Brain Research. 1991;554:229–236. doi: 10.1016/0006-8993(91)90194-z. [DOI] [PubMed] [Google Scholar]
- Fanning AS, Jameson BJ, Jesaitis LA, Anderson JM. The tight junction protein ZO-1 establishes a link between the transmembrane protein occludin and the actin cytoskeleton. The Journal of Biological Chemistry. 1998;273:29745–29753. doi: 10.1074/jbc.273.45.29745. [DOI] [PubMed] [Google Scholar]
- Fleming MD, Trenor CC, Su MA, Foernzler D, Beier DR, Dietrich WF, Andrews NC. Microcytic anaemia mice have a mutation in Nramp2, a candidate iron transporter gene. Nature Genetics. 1997;16:383–386. doi: 10.1038/ng0897-383. [DOI] [PubMed] [Google Scholar]
- Franke H, Galla HJ, Beuckmann CT. An improved low-permeability in vitro-model of the blood– brain barrier: transport studies on retinoids, sucrose, haloperidol, caffeine and mannitol. Brain Research. 1999;818:65–71. doi: 10.1016/s0006-8993(98)01282-7. [DOI] [PubMed] [Google Scholar]
- Gunshin H, Mackenzie B, Berger UV, Gunshin Y, Romero MF, Boron WF, Nussberger S, Gollan JL, Hediger MA. Cloning and characterization of a mammalian proton-coupled metal-ion transporter. Nature. 1997;388:482–488. doi: 10.1038/41343. [DOI] [PubMed] [Google Scholar]
- Johnson MD, Anderson BD. In vitro models of the blood– brain barrier to polar permeants: comparison of transmonolayer flux measurements and cell uptake kinetics using cultured cerebral capillary endothelial cells. Journal of Pharmaceutical Sciences. 1999;88:620–625. doi: 10.1021/js9803149. [DOI] [PubMed] [Google Scholar]
- Hakvoort A, Haselbach M, Galla HJ. Active transport properties of porcine choroid plexus cells in culture. Brain Research. 1998;795:247–256. doi: 10.1016/s0006-8993(98)00284-4. [DOI] [PubMed] [Google Scholar]
- Huber JD, Egleton RD, Davis TP. Molecular physiology and pathophysiology of tight junctions in the blood-brain barrier. Trends in Neurosciences. 2001;24:719–725. doi: 10.1016/s0166-2236(00)02004-x. [DOI] [PubMed] [Google Scholar]
- Kurrimbux D, Gaffen Z, Farrell CL, Martin D, Thomas SA. The involvement of the blood-brain and the blood-cerebrospinal fluid barriers in the distribution of leptin into and out of the rat brain. Neuroscience. 2004;123:527–536. doi: 10.1016/j.neuroscience.2003.08.061. [DOI] [PubMed] [Google Scholar]
- Lagrange P, Romero IA, Minn A, Revest PA. Transendothelial permeability changes induced by free radicals in an in vitro model of the blood– brain barrier. Free Radical Biology & Medicine. 1999;27:667–672. doi: 10.1016/s0891-5849(99)00112-4. [DOI] [PubMed] [Google Scholar]
- Li GJ, Zhao Q, Zheng W. Alteration at translational but not transcriptional level of transferrin receptor expression following manganese exposure at the blood-CSF barrier in vitro. Toxicology and Applied Pharmacology. 2005;205:188–200. doi: 10.1016/j.taap.2004.10.003. [DOI] [PMC free article] [PubMed] [Google Scholar]
- Masereeuw R, Jaehde U, Langemeijer MW, de Boer AG, Breimer DD. In vitro and in vivo transport of zidovudine (AZT) across the blood-brain barrier and the effect of transport inhibitors. Pharmaceutical Research. 1994;11:324–330. doi: 10.1023/a:1018932213953. [DOI] [PubMed] [Google Scholar]
- McKie AT, Marciani P, Rolfs A, Brennan K, Wehr K, Barrow D, Miret S, Bomford A, Peters TJ, Farzaneh F, Hediger MA, Hentze MW, Simpson RJ. A novel duodenal iron-regulated transporter, IREG1, implicated in the basolateral transfer of iron to the circulation. Molecular Cell. 2000;5:299–309. doi: 10.1016/s1097-2765(00)80425-6. [DOI] [PubMed] [Google Scholar]
- Mercer JF, Llanos RM. Molecular and cellular aspects of copper transport in developing mammals. The Journal of Nutrition. 2003;133:1481S–1484S. doi: 10.1093/jn/133.5.1481S. [DOI] [PubMed] [Google Scholar]
- Moos T, Morgan EH. Transferrin and transferrin receptor function in brain barrier systems. Cellular and Molecular Neurobiology. 2000;20:77–95. doi: 10.1023/A:1006948027674. [DOI] [PMC free article] [PubMed] [Google Scholar]
- Nagata Y, Kusuhara H, Endou H, Sugiyama Y. Expression and functional characterization of rat organic anion transporter 3 (rOat3) in the choroid plexus. Molecular Pharmacology. 2002;61:982–988. doi: 10.1124/mol.61.5.982. [DOI] [PubMed] [Google Scholar]
- Peraldi-Roux S, Nguyen-Than Dao B, Hirn M, Gabrion J. Choroidal ependymocytes in culture: expression of markers of polarity and function. International Journal of Developmental Neuroscience. 1990;8:575–588. doi: 10.1016/0736-5748(90)90050-c. [DOI] [PubMed] [Google Scholar]
- Rao VV, Dahlheimer JL, Bardgett ME, Snyder AZ, Finch RA, Sartorelli AC, Piwnica-Worms D. Choroid plexus epithelial expression of MDR1 P glycoprotein and multidrug resistance-associated protein contribute to the blood-cerebrospinal-fluid drug-permeability barrier. Proceedings of the National Academy of Sciences of the United States of America. 1999;96:3900–3905. doi: 10.1073/pnas.96.7.3900. [DOI] [PMC free article] [PubMed] [Google Scholar]
- Saito Y, Wright EM. Regulation of bicarbonate transport across the brush border membrane of the bull-frog choroid plexus. The Journal of physiology. 1984;350:327–342. doi: 10.1113/jphysiol.1984.sp015204. [DOI] [PMC free article] [PubMed] [Google Scholar]
- Schreiber G, Aldred AR, Jaworowski A, Nilsson C, Achen MG, Segal MB. Thyroxine transport from blood to brain via transthyretin synthesis in choroid plexus. The American Journal of Physiology. 1990;258:R338–R345. doi: 10.1152/ajpregu.1990.258.2.R338. [DOI] [PubMed] [Google Scholar]
- Sekler I, Moran A, Hershfinkel M, Dori A, Margulis A, Birenzweig N, Nitzan Y, Silverman WF. Distribution of the zinc transporter ZnT-1 in comparison with chelatable zinc in the mouse brain. The Journal of Comparative Neurology. 2002;447:201–209. doi: 10.1002/cne.10224. [DOI] [PubMed] [Google Scholar]
- Serot JM, Bene MC, Faure GC. Choroid plexus, aging of the brain, and Alzheimer's disease. Frontiers in Bioscience. 2003;8:s515–21. doi: 10.2741/1085. [DOI] [PubMed] [Google Scholar]
- Shi LZ, Zheng W. Establishment of an in vitro brain barrier epithelial transport system for pharmacological and toxicological study. Brain Research. 2005;1057:37–48. doi: 10.1016/j.brainres.2005.07.046. [DOI] [PMC free article] [PubMed] [Google Scholar]
- Spector R, Berlinger WG. Localization and mechanism of thymidine transport in the central nervous system. Journal of Neurochemistry. 1982;39:837–841. doi: 10.1111/j.1471-4159.1982.tb07968.x. [DOI] [PubMed] [Google Scholar]
- Strazielle N, Ghersi-Egea JF. In vitro investigation of the blood-cerebrospinal fluid barrier properties: Primary cultures and immortalized cell lines of the choroidal epithelium. In: Zheng W, Chodobski A, editors. The Blood-Cerebrospinal Fluid Barrier. CRC Press; New York: 2005. pp. 553–593. [Google Scholar]
- Strazielle N, Preston JE. Transport across the choroid plexuses in vivo and in vitro. Methods in Molecular Medicine. 2003;89:291–304. doi: 10.1385/1-59259-419-0:291. [DOI] [PubMed] [Google Scholar]
- Strazielle N, Belin MF, Ghersi-Egea JF. Choroid plexus controls brain availability of anti-HIV nucleoside analogs via pharmacologically inhibitable organic anion transporters. AIDS. 2003;17:1473–1485. doi: 10.1097/00002030-200307040-00008. [DOI] [PubMed] [Google Scholar]
- Sweet DH, Miller DS, Pritchard JB. Ventricular choline transport: a role for organic cation transporter 2 expressed in choroid plexus. The Journal of Biological Chemistry. 2001;276:41611–41619. doi: 10.1074/jbc.M108472200. [DOI] [PubMed] [Google Scholar]
- Thomas SA, Segal MB. The passage of azidodeoxythymidine into and within the central nervous system: does it follow the parent compound, thymidine? The Journal of Pharmacology and Experimental Therapeutics. 1997;281:1211–1218. [PubMed] [Google Scholar]
- Walker NJ. Real-time and quantitative PCR: applications to mechanism-based toxicology. Journal of Biochemical and Molecular Toxicology. 2001;15:121–127. doi: 10.1002/jbt.8. [DOI] [PubMed] [Google Scholar]
- Wang X, Li GJ, Zheng W. Upregulation of DMT1 expression in choroidal epithelia of the blood-CSF barrier following manganese exposure in vitro. Brain Research. 2006;1097:1–10. doi: 10.1016/j.brainres.2006.04.046. [DOI] [PMC free article] [PubMed] [Google Scholar]
- Wang ZY, Stoltenberg M, Jo SM, Huang L, Larsen A, Dahlstrom A, Danscher G. Dynamic zinc pools in mouse choroid plexus. Neuroreport. 2004;15:1801–1804. doi: 10.1097/01.wnr.0000132918.05366.81. [DOI] [PubMed] [Google Scholar]
- Welch K. The principles of physiology of the cerebrospinal fluid in relation to hydrocephalus including normal pressure hydrocephalus. Advances in neurology. 1975;13:247–332. [PubMed] [Google Scholar]
- Wijnholds J, deLange EC, Scheffer GL, van den Berg DJ, Mol CA, van der Valk M, Schinkel AH, Scheper RJ, Breimer DD, Borst P. Multidrug resistance protein 1 protects the choroid plexus epithelium and contributes to the bloodcerebrospinal fluid barrier. The Journal of Clinical Investigation. 2000;105:279–285. doi: 10.1172/JCI8267. [DOI] [PMC free article] [PubMed] [Google Scholar]
- Wong SL, Van Belle K, Sawchuk RJ. Distributional transport kinetics of zidovudine between plasma and brain extracellular fluid/cerebrospinal fluid in the rabbit: investigation of the inhibitory effect of probenecid utilizing microdialysis. The Journal of Pharmacology and Experimental Therapeutics. 1993;264:899–909. [PubMed] [Google Scholar]
- Wright EM. Mechanisms of ion transport across the choroid plexus. The Journal of Physiology. 1972;226:545–571. doi: 10.1113/jphysiol.1972.sp009997. [DOI] [PMC free article] [PubMed] [Google Scholar]
- Wu D, Clement JG, Pardridge WM. Low blood-brain barrier permeability to azidothymidine (AZT), 3TC, and thymidine in the rat. Brain Research. 1998;791:313–316. doi: 10.1016/s0006-8993(98)00139-5. [DOI] [PubMed] [Google Scholar]
- Wu LJ, Leenders AG, Cooperman S, Meyron-Holtz E, Smith S, Land W, Tsai RY, Berger UV, Sheng ZH, Rouault TA. Expression of the iron transporter ferroportin in synaptic vesicles and the blood-brain barrier. Brain Research. 2004;1001:108–117. doi: 10.1016/j.brainres.2003.10.066. [DOI] [PubMed] [Google Scholar]
- Zheng W. Toxicology of choroid plexus: special reference to metal-induced neurotoxicities. Microscopy Research and Technique. 2001;52:89–103. doi: 10.1002/1097-0029(20010101)52:1<89::AID-JEMT11>3.0.CO;2-2. [DOI] [PMC free article] [PubMed] [Google Scholar]
- Zheng W, Chodobski A. The Blood-Cerebrospinal Fluid Barrier. CRC Press; New York: 2005. [Google Scholar]
- Zheng W, Zhao Q. Establishment and characterization of an immortalized Z310 choroidal epithelial cell line from murine choroid plexus. Brain Research. 2002;958:371–380. doi: 10.1016/s0006-8993(02)03683-1. [DOI] [PMC free article] [PubMed] [Google Scholar]
- Zheng W, Aschner M, Ghersi-Egea JF. Brain barrier systems: a new frontier in metal neurotoxicological research. Toxicology and Applied Pharmacology. 2003a;192:1–11. doi: 10.1016/s0041-008x(03)00251-5. [DOI] [PMC free article] [PubMed] [Google Scholar]
- Zheng W, Blaner WS, Zhao Q. Inhibition by lead of production and secretion of transthyretin in the choroid plexus: its relation to thyroxine transport at blood-CSF barrier. Toxicology and Applied Pharmacology. 1999;155:24–31. doi: 10.1006/taap.1998.8611. [DOI] [PMC free article] [PubMed] [Google Scholar]
- Zheng W, Zhao Q, Graziano JH. Primary culture of choroidal epithelial cells: characterization of an in vitro model of blood-CSF barrier. In Vitro Cellular & Developmental Biology. Animal. 1998;34:40–45. doi: 10.1007/s11626-998-0051-8. [DOI] [PMC free article] [PubMed] [Google Scholar]
- Zheng W, Deane R, Redzic Z, Preston JE, Segal MB. Transport of L-[125I]thyroxine by in situ perfused ovine choroid plexus: inhibition by lead exposure. Journal of Toxicology and Environmental Health A. 2003b;66:435–451. doi: 10.1080/15287390306451. [DOI] [PMC free article] [PubMed] [Google Scholar]
- Zheng W, Shen H, Blaner WS, Zhao Q, Ren X, Graziano JH. Chronic lead exposure alters transthyretin concentration in rat cerebrospinal fluid: The role of the choroid plexus. Toxicology and Applied Pharmacology. 1996;139:445–450. doi: 10.1006/taap.1996.0186. [DOI] [PMC free article] [PubMed] [Google Scholar]