Abstract
It has been observed that the evolutionary distances of interacting proteins often display a higher level of similarity than those of non-interacting proteins. This finding indicates that interacting proteins are subject to common evolutionary constraints and constitutes the basis of a method to predict protein interactions known as mirrortree. It has been difficult, however, to identify the direct cause of the observed similarities between evolutionary trees. One possible explanation is the existence of compensatory mutations between partners’ binding sites to maintain proper binding. This explanation, however, has been recently challenged; and it has been suggested that the signal of correlated evolution uncovered by the mirrortree method is unrelated to any correlated evolution between binding sites. We examined the contribution of binding sites to the correlation between evolutionary trees of interacting domains. We showed that binding neighborhoods of interacting proteins have, on average, higher coevolutionary signal compared to the regions outside binding sites; although when the binding neighborhood was removed, the remaining domain sequence still contained some coevolutionary signal. In conclusion, the correlation between evolutionary trees of interacting domains cannot exclusively be attributed to the correlated evolution of the binding sites or to common evolutionary pressure exerted on the whole protein domain sequence, both factors contribute to the signal measured by the mirror tree approach. In addition, we showed that binding neighborhoods of interacting proteins have, on average, higher coevolutionary signal compared to the regions outside binding sites.
Keywords: domain-domain interactions, protein coevolution, protein-protein interactions, phylogenetic tree, mirrortree
Introduction
It has been proposed that interacting proteins should coevolve to maintain their interactions 1; 2; 3. This idea provides the main motivation for the method to predict protein interactions known as the mirrortree method 1; 3; 4; 5; 6; 7; 8; 9; 10; 11; 12; 13. The mirrortree method predicts protein-protein interactions by assessing the extent of agreement between evolutionary distances that could be attributed to correlated evolution. For this purpose, distance matrices are constructed from alignments of orthologous sequences taken from a common set of species. The degree of correlated evolution between families of orthologs is assessed by computing the correlation coefficient between the corresponding distance matrices. The mirrortree method measures the correlation between evolutionary distances and thus, indirectly, the correlation between evolutionary rates along individual branches of evolutionary trees of two families. While correlation between the evolutionary trees of interacting proteins has been well documented 1; 2; 4; 7; 10; 14, the principal cause of such correlated changes remains unclear 15. In particular, it has been proposed that higher correlation values between evolutionary trees of interacting proteins (with respect to non-interacting ones) can be caused by compensatory mutations, where mutations in one binding partner are being compensated by complementary mutations in another partner to maintain amino acid interactions important for protein function, stability and foldability 1; 2; 4; 16; 17; 18; 19.
However, correlation between evolutionary distances of interacting proteins may also have other sources. For example, Fraser et al. 20 used codon adaptation index analysis to infer that the levels of expression of interacting partners are also subject to correlated evolution and that such co-expression could be required for maintaining proper stoichiometry among interacting components. It has been observed that expression levels are correlated with evolutionary rates 16; 21; 22, which might contribute to the coevolution signal measured by the mirrortree method. Indeed, Hakes et al. 23 demonstrated that mRNA abundance is a good protein interaction predictor. Another important argument against using compensatory mutations to explain the entire coevolutionary signal detected by the mirrortree is that this approach could also identify as interacting non-interacting proteins within the same protein complex or biological pathway. Indeed, an extension of the mirrortree recently introduced by Juan et al. detects proteins within the same metabolic pathways despite the fact that they are not necessarily related by physical interactions 24.
Challenging previous assumptions about the strong contribution of coevolution of binding interfaces to the correlation signal between evolutionary distances measured by the mirrortree method, Hakes et al. 23 suggests that such correlation does not mostly originate from compensating mutations in the interface. In their work, Hakes et al. 23 shows that selecting only the surface residues or the interface residues as input for the mirrortree approach yields similar results as using the whole protein sequence. Based on their analysis, they conclude that “correlated sequence evolution is most probably due to interacting proteins being constrained in similar ways and having similar rates of evolution across their entire sequences.”
Accounting for the considerations above, in this work “correlated evolution” refers to correlated changes in evolutionary rates imposed on a pair of interacting proteins to preserve their interaction properties. As such, this definition of correlated evolution includes also correlated changes to preserve physical binding properties, co-expression, foldability and all other constraints that are imposed on a pair of interacting proteins to preserve functional properties of interaction. It is important to keep in mind that since the mirrortree technique is based on correlated changes in distances between sequences of interacting proteins rather than on a direct measurement of any of the above mentioned factors, it cannot assess which one of them is a dominating contributor to the signal.
In this work, we analyze the contribution of the binding sites to the coevolutionary signal of domain-domain interactions measured by the mirrortree method. For this purpose, we use binding sites together with their spatially surrounding residues, which we refer to as “binding neighborhoods”. We select a set of protein domains with representatives in one common set of species, thereby avoiding problems related to comparing correlations computed based on different sets of species. Furthermore, to limit the impact of the coevolutionary signal due to common speciation divergence, we apply the Pazos et al. 14 and Sato et al. 11 speciation subtraction methods. With these controls in place, we develop several tests to compare the relative strength of the coevolutionary signal from binding and non-binding parts of proteins. In particular, we test how the coevolutionary signal computed from the binding neighborhood compares to that computed from an equivalent number of non-binding positions.
In agreement with previous work indicating that coevolutionary signal is not restricted to the binding interface, we find that when completely removing the binding neighborhoods, the remaining sequences of interacting domains still contain significant coevolutionary signal. However, we also find that the signal is not distributed uniformly across the sequence. In particular, removing the binding neighborhood significantly reduces the performance of the method. In addition, we find that the binding neighborhood alone provides a stronger coevolutionary signal than the same number of randomly selected residues outside the binding neighborhood. Thus, the correlation between evolutionary distances of interacting protein domains can be only partially explained by the common evolutionary pressure exerted along the whole sequence of interacting protein domains. In particular, our results indicate that the binding neighborhood has a significantly higher contribution to this signal than the rest of the protein domain sequence.
Results and discussion
To compare the contribution of correlated evolution measured by mirrortree based on binding sites against that of the whole protein domain sequence, we considered a set of columns from the multiple sequence alignment (MSA) corresponding to binding sites and their close neighborhood (“binding neighborhood”). The rationale to consider this binding neighborhood rather than binding sites alone is as follows. The mirrortree method measures the correlation between evolutionary changes but the binding sites alone are often (sometimes nearly perfectly) conserved and might not display enough variation to provide detectable coevolutionary signal. Furthermore, it has been found previously that the majority of the coevolving positions are not in direct contact but usually physically close (≤10 Å) 25.
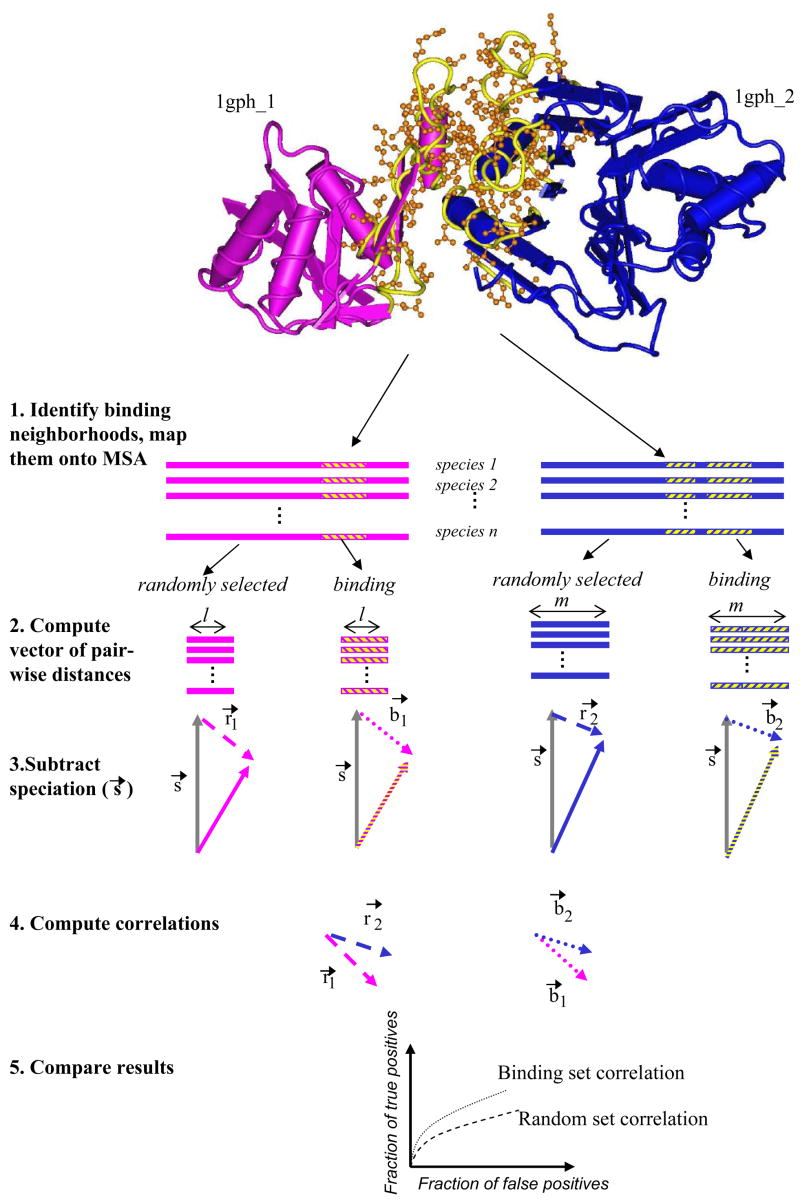
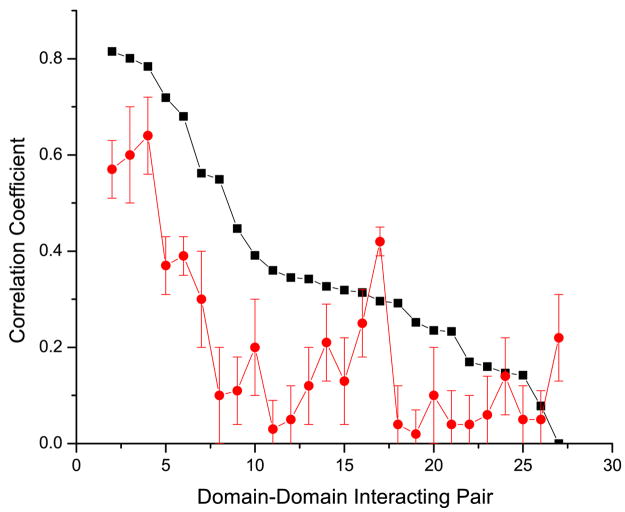
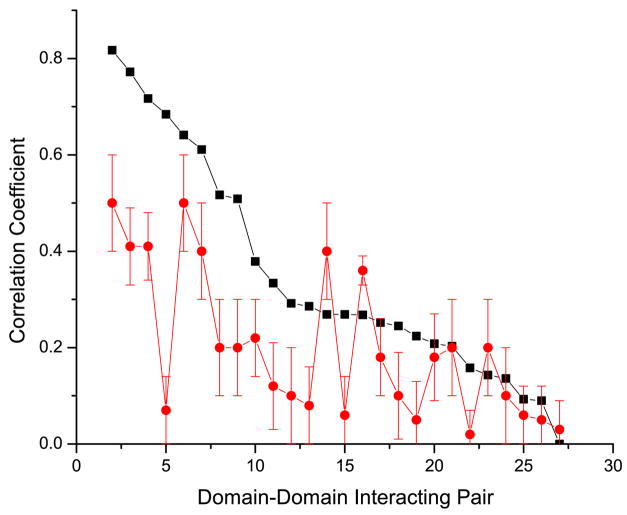
First, we compared the performance of the mirrortree method using MSA columns from the binding neighborhood alone to the performance of the same method when an equal number of randomly selected non-neighborhood MSA columns were used (Figure 1). We considered binding neighborhoods at increasing thresholds: 6 Å, 8 Å, 10 Å and 12 Å (see Methods). We corrected for the speciation divergence using two different methods that we will refer to as the “non-orthogonal” and “orthogonal” methods proposed by Pazos et al. 14 and Sato et al. 11 respectively (see Methods). We refer to our previous study 6 for details about the methodological differences between these methods and for the explanation of this naming convention. We should note that the gold standard used for benchmarking was designed based on a set of domain-domain interactions verified with crystallographic data from Shoemaker et al. 26. This dataset, with additional constrains (see Methods), might be biased towards domain pairs that form more stable complexes rather than transient interactions due to the limited sample size. Figure 2 depicts the comparison, for all interacting domains pairs, of the correlation coefficients obtained using the binding neighborhood alone against those of using an equal number of randomly selected non-neighborhood MSA columns (see Methods). Results using the orthogonal and non-orthogonal speciation corrections are depicted in Figure 2a and 2b respectively. For both speciation corrections, the coevolutionary signal strength, represented by the correlation coefficients, derived from the binding neighborhood is predominately higher.
Figure 1.
Comparing signals from the binding neighborhood against randomly selected MSA columns. (1) The binding neighborhoods are extracted from crystal structures of interacting domains and projected onto the multiple sequence alignment (MSA) of orthologous sequences. (2) The distance matrices are constructed using the MSA columns corresponding to the binding neighborhoods, and separately, for the sequences constructed by randomly selecting the same number of non-binding MSA columns. The upper triangle of the distance matrix is represented as a vector. Subsequently, (3) each vector is corrected by subtracting the speciation vector (s→, depicted in gray). (4) The correlation coefficient between the resulting vectors is computed (dashed and dotted vectors for randomly selected and binding neighborhood respectively). (5) Finally, it is tested whether the correlation between vectors computed using the binding neighborhood lead to better retrieval results than vectors computed using randomly selected MSA columns.
Figure 2.
Comparison of the correlation coefficients for each domain-domain interacting pair using the binding neighborhood (black), and an equivalent number of randomly selected columns (red). The values in the x-axis, labeled 1 to 26, represent each of the domain-domain interacting pairs sorted in descending order by the corresponding correlation coefficient when using the binding neighborhood. Results in panels a and b were obtained using the orthogonal and non-orthogonal speciation corrections respectively. For randomized experiments we plot the mean value and represent the standard deviation based on 100 trials as the error bar.
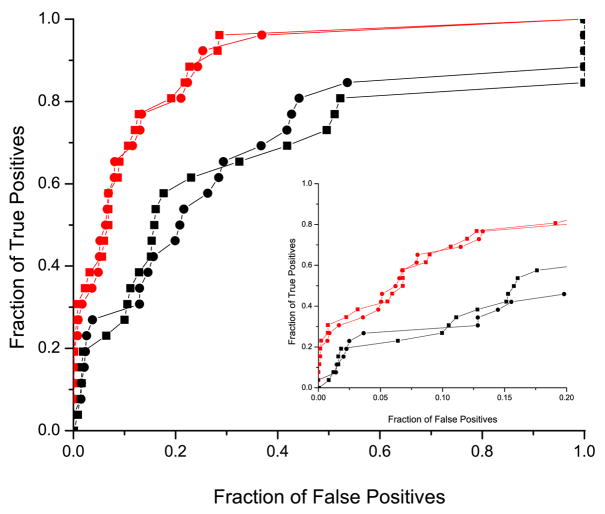
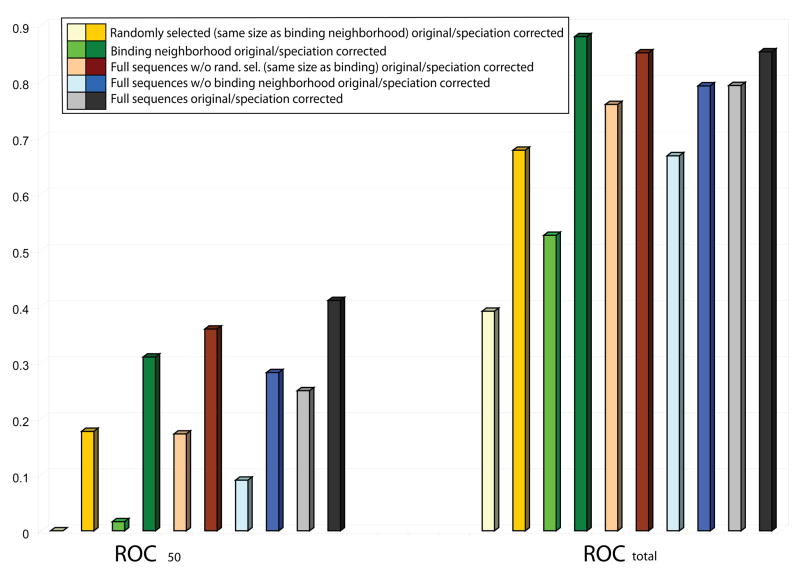
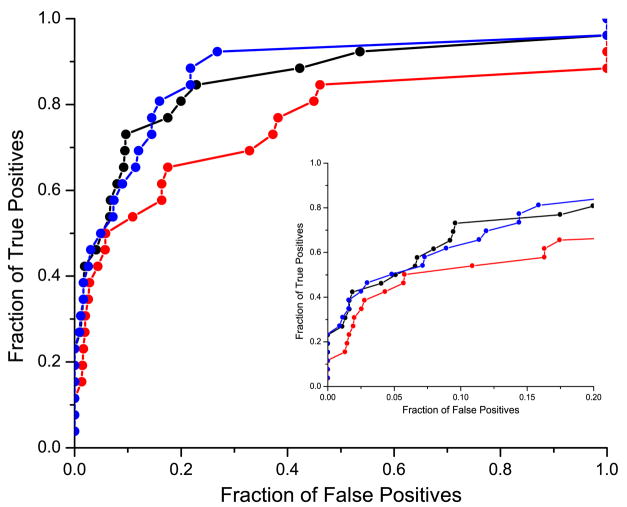
In addition, the accuracy of the different methods was measured using the Receiver Operating Curves (ROC )27. We used complete ROC and ROCn curves (plots truncated after the first n false results 28; 29) that were normalized so that the area under the ROC curve for an ideal retrieval method (one which returns all the true results first) was equal to 1.0. The corresponding ROC curves, for binding neighborhood of 10 Å, are shown in Figure 3. Independent of the speciation subtraction method used, exclusive use of the binding neighborhood drastically improves the performance in predicting domain interactions over the set of randomly selected MSA columns outside the binding neighborhood. Figure 4 shows values for ROC50, ROCtotal for all these experiments, together with the corresponding values from additional experiments discussed below. The values of ROC are given in Table 1. For the experiment using randomly selected columns, we computed the standard deviation based on 100 trials. Note that the results for randomly selected columns and the binding neighborhood differ by several standard deviations. We confirmed that the results presented in this paper are robust with respect to the definition of binding neighborhood.
Figure 3.
Comparison of the performance of the mirrortree method on the binding neighborhood and on the randomly selected MSA columns set of the same size. The red lines correspond to the performance using the binding neighborhood with corrections from the orthogonal speciation subtraction (circles) and non-orthogonal speciation subtraction (squares). The corresponding graphs for randomly selected residues are drawn in black. Insert shows ROC curves for up to 20% false positive rate.
Figure 4.
Dependence of ROC results on the columns used in the alignment and on the speciation correction used in the analysis. Results for ROCtotal and ROC50 show the following trends. Regardless of the region of the sequence used, the performance of the method with the correction for speciation (darker colors) is better than that of the original mirrortree without the correction (lighter colors). In particular, using the full length sequence with speciation correction yields, for ROC50, the best results (grey), and substracting a set of randomly selected non-binding columns (brown) represents only a slight decrease in the performance, while subtracting the binding neighborhood (cyan) to the full sequence represents a significant decrease on the overall performance of the method. Finally, performance using the binding neighborhood alone (green) is significantly better than using a randomly selected set of columns of the same size but not belonging to the binding neighborhood (yellow).
Table 1.
Summary of ROC50 and ROCtotal values for all experiments. For randomized experiments we report the mean value and compute the standard deviation based on 100 trials (standard deviation in parenthesis).
| Experiment | Speciation correction | ROC50 (std) | ROCtotal (std) |
|---|---|---|---|
| Randomly selected columns | none | 0.000 (0.003) | 0.391 (0.006) |
| Binding neighborhood | none | 0.016 | 0.526 |
| Full w/o rand. selected res. | none | 0.189 (0.02) | 0.75 (0.02) |
| Full w/o binding neighborhood | none | 0.090 | 0.667 |
| Full sequence | none | 0.249 | 0.793 |
| Randomly selected columns | non-orthogonal | 0.16 (0.03) | 0.677(0.05) |
| Binding neighborhood | non-orthogonal | 0.309 | 0.88 |
| Full w/o rand. selected res. | non-orthogonal | 0.38 (0.02) | 0.851(0.02) |
| Full w/o binding neighborhood | non-orthogonal | 0.282 | 0.792 |
| Full sequence | non-orthogonal | 0.410 | 0.852 |
| Randomly selected columns | orthogonal | 0.14 (0.03) | 0.645 (0.04) |
| Binding neighborhood | orthogonal | 0.276 | 0.735 |
| Full w/o rand. selected res. | orthogonal | 0.31 (0.02) | 0.85 (0.02) |
| Full w/o binding neighborhood | orthogonal | 0.249 | 0.735 |
| Full sequence | orthogonal | 0.348 | 0.838 |
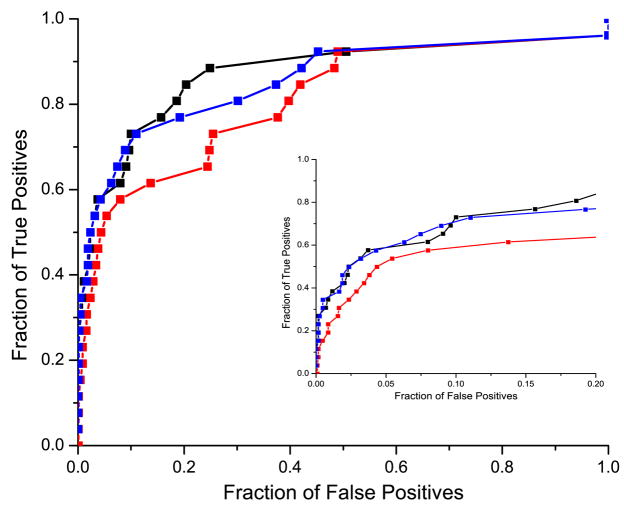
Next, we analyzed the effect of removing the binding neighborhood on the performance of the mirrortree method and compared it with the effect of removing randomly chosen columns outside the binding neighborhood. The number of removed random columns was equal to the number of columns in the binding neighborhood, thereby accounting for any effect that the number of columns might have on the method. We applied both orthogonal and non-orthogonal speciation subtraction; results are depicted in Figure 5a and 5b respectively. Independent of the applied speciation subtraction, we observed that the removal of the binding neighborhood leads to a significant decrease in the performance of the mirrortree method. Yet, our results show that the sequence without the binding neighborhood still provides significant coevolutionary signal. Furthermore, for randomly selected residues, the discriminating power measured by ROC value increased with the number of selected columns.
Figure 5.
Comparison of the performance of the mirrortree method using the full sequence (black), full sequence without the binding neighborhood (red), and sequence without the set of randomly selected columns of the same number as the binding neighborhood (blue). Figure 5a corresponds to the orthogonal speciation correction and Figure 5b corresponds to the non-orthogonal correction. Inserts show ROC curves for up to 20% false positive rate.
One can argue that since Hakes et al. 23 found no differences in the discriminating power between the surface region and the whole sequence, the better performance of the binding neighborhood could be due to surface residues that might be contained within the binding neighborhood. To eliminate this possibility, we compared the ROC values obtained from the binding neighborhood to those computed based on surface residues (of the same size as the binding neighborhood and excluding residues from the binding neighborhood). In addition, only interacting pairs that contain sufficiently large numbers of surface residues outside of the binding neighborhood were selected (see Methods). The results for this analysis, depicted in Table 2, show that the ROC values using surface residues outside the binding neighborhood are always smaller than those using the binding neighborhood (independent of the speciation correction used).
Table 2.
Comparison of ROC50 and ROC100 values for experiments using the full sequence, only the surface and only the binding neighborhood (radius 10A) using set_18 defined in methods
| Experiment | Speciation correction | ROC50 | ROC100 |
|---|---|---|---|
| Full sequence | none | 0.196 | 0.256 |
| Surface | none | 0.000 | 0.000 |
| Binding neighborhood | none | 0.000 | 0.022 |
| Full sequence | non-orthogonal | 0.430 | 0.548 |
| Surface | non-orthogonal | 0.188 | 0.261 |
| Binding neighborhood | non-orthogonal | 0.287 | 0.386 |
| Full sequence | orthogonal | 0.337 | 0.444 |
| Surface | orthogonal | 0.162 | 0.211 |
| Binding neighborhood | orthogonal | 0.201 | 0.312 |
Finally, Figure 4 provides a summary view of the results discussed above without speciation subtraction (faded colors) and with the non-orthogonal subtraction (bright colors); results for orthogonal subtraction, not shown, were almost identical. Clearly, the binding neighborhood is a better discriminator of interactions than a randomly selected set of columns of the same size. The relative discriminative powers of the whole sequence, the whole sequence without binding neighborhood and the binding neighborhood differ between the ROC values, with the whole sequence performing the best on the more practical ROC50. In addition to the above results, it shows that a larger number of MSA columns provide a stronger signal (the number of columns in the randomly selected and binding neighborhood sets are smaller than the number of columns in the full length sequences). Furthermore, from the summary in Figure 4 one can also appreciate the strongly increased power of the mirrortree method when the correction for speciation is applied.
Conclusions
We have shown that binding neighborhoods of interacting proteins have, on average, higher coevolutionary signal compared to those columns outside binding sites. We also found that the sequences without the binding sites still contain some coevolutionary signal, however, the signal coming from a randomly selected set of columns is weaker than that of the binding neighborhoods. Interestingly, our results also show that the coevolutionary signal of randomly selected MSA columns outside the binding neighborhood increases with the number of columns.
Thus, in agreement with Hakes et al. and others, we found that the binding neighborhood alone is not the only contributor to the coevolutionary signal. Hakes et al. concluded that “correlated sequence evolution is most probably due to interacting proteins being constrained in similar ways and, consequently, having similar rates of evolution across their entire sequences.” Our additional experiments lead, however, to the conclusion that the signal is not uniform, instead it is stronger in the binding neighborhood.
Our results indicate that the binding neighborhood is subject to stronger correlated evolution than other regions of the interacting protein domains. However since the mirrortree technique is based on common variation of sequence distances between sequences of interacting proteins rather than on a direct measurement of any of the factors that might contribute to this variation, the exact coevolutionary mechanism which leads to the similarity of evolutionary trees of interacting proteins is still not fully uncovered.
Materials and methods
Data set
The set of interacting and non-interacting domains has been selected similar to Kann et al.6. In particular, this test set ensures that all orthologous families (interacting or not) contain sequences from the same set of 70 species. Our set of interacting domain families contains a total of 26 interacting pairs and 1291 non-interacting pairs. The interacting domains have been selected rigorously based on the Conserved Binding Mode (CBM) database of Shoemaker et al. 26, which maps the protein domains from the Conserved Domain Database (CDD)30 onto a set of interacting domains from PDB and verifies the interactions via conserved binding modes (CBMs). The CBM analysis uses conserved geometric interfaces to reduce the possibility of including non-biological interactions. All interacting domains in this study were extracted from the CBM database. For cases where multiple conserved binding modes are present for a single interacting pair of domains, we randomly chose one conserved binding mode per pair. For each domain pair extracted from the CBM database an expanded binding neighborhood was determined about the binding interface. Any two residues a and b, from domains A and B respectively, are included if and only if the distance between the closest atoms from a and b does not exceed a given threshold. Threshold values of 6 Å, 8 Å, 10 Å and 12 Å were used. The results given in the main text are for 10 Å. In addition, all pairs selected for this study must contain at least 20 residues satisfying this condition.
Solvent-accessible residues were determined from DSSP 31 calculations available for all structures at ftp://ftp.cmbi.kun.nl/pub/molbio/data/dssp. The solvent accessibility of residue “X” is defined as a ratio of its solvent accessible area in protein structure to that for extended tripeptide Gly-X-Gly. An amino acid is considered as solvent accessible if this ratio is greater than 0.05. To account for the size effect the same number of columns was chosen for both surface and binding neighborhood regions. In addition, we selected only those interacting pairs that contained sufficiently large numbers of surface residues outside of the binding neighborhood and did not contain large disordered regions (surface accessibility could not be calculated for disordered regions). After applying all these restrictions we ended up with 18 interacting pairs (set_18).
Mirrortree method with speciation subtraction
For each domain pair reported in the interacting and non-interacting sets, the correlation between their evolutionary trees was measured by computing the correlation coefficient of the corresponding vectors. The sets of residues, and their corresponding MSA columns, were selected as follows. All the columns of the protein domain’s MSA were used for the “full sequence experiment”. For each interacting domain, we randomly selected a set of columns outside the binding neighborhood equal to the number of sites in the binding neighborhood. Only binding neighborhood columns or randomly selected columns were used (or excluded) in the remaining experiments. This selection procedure was repeated 100 times. The correlation coefficient was adjusted using one of the two speciation subtraction approaches: orthogonal subtraction or non-orthogonal subtraction proposed by Sato et al 11 and Pazos et al. 14 respectively. For two domains A and B with n species in common in their MSA, let’s denote Aij as the distance between species i and j for protein family A, and Bij for protein family B.
To implement the speciation signal subtraction, these distance vectors were further modified as follows. First, the background speciation matrix was computed by averaging the evolutionary distance matrices (F) of all protein families (from interacting and non-interacting sets). Thus, for N protein families, the distance between species i and j in the background speciation vector is given by
To reduce the impact of codivergence due to common speciation history, the non-orthogonal speciation subtraction method 14 computes modified distances A′ij and B′ij by A′ij = Aij − sij and B′ij = Bij −sij. When using the orthogonal reference, corresponding distances are defined by and where is the standard representation of the projection of the distance vector for protein families F=A or B into the speciation vector s→ij, and is given by
We point out that the implementations of orthogonal and non-orthogonal subtraction are identical to 6. Finally, given A′ij and B′ij, the correlation between evolutionary histories is estimated by computing a standard Pearson’s correlation coefficient of the upper right triangle of the corresponding matrices.
Supplementary Material
Table S1 List of the 70 organisms used in all of the experiments.
Table S2 Domain definitions for the interacting protein families.
Table S3 Dependence of ROC values on the size of the binding neighborhood.
Table S4 Number of residues inside and outside the binding neighborhood defined using threshold values of 6 Å, 8 Å, 10 Å and 12 Å.
Table S5 Correlation coefficient for all interacting pairs computed using the orthogonal method for speciation correction.
Table S6 Correlation coefficient for all interacting pairs computed using the non-orthogonal method for speciation correction.
Acknowledgments
Support for this work was provided in part by the intramural research program of the National Institutes of Health, National Library of Medicine and funding from the University of Maryland, Baltimore County Special Research Initiative Support.
Footnotes
Publisher's Disclaimer: This is a PDF file of an unedited manuscript that has been accepted for publication. As a service to our customers we are providing this early version of the manuscript. The manuscript will undergo copyediting, typesetting, and review of the resulting proof before it is published in its final citable form. Please note that during the production process errors may be discovered which could affect the content, and all legal disclaimers that apply to the journal pertain.
References
- 1.Goh CS, Bogan AA, Joachimiak M, Walther D, Cohen FE. Co-evolution of proteins with their interaction partners. J Mol Biol. 2000;299:283–93. doi: 10.1006/jmbi.2000.3732. [DOI] [PubMed] [Google Scholar]
- 2.Pazos F, Helmer-Citterich M, Ausiello G, Valencia A. Correlated mutations contain information about protein-protein interaction. J Mol Biol. 1997;271:511–23. doi: 10.1006/jmbi.1997.1198. [DOI] [PubMed] [Google Scholar]
- 3.Pazos F, Valencia A. Similarity of phylogenetic trees as indicator of protein-protein interaction. Protein Eng. 2001;14:609–14. doi: 10.1093/protein/14.9.609. [DOI] [PubMed] [Google Scholar]
- 4.Goh CS, Cohen FE. Co-evolutionary analysis reveals insights into protein-protein interactions. J Mol Biol. 2002;324:177–92. doi: 10.1016/s0022-2836(02)01038-0. [DOI] [PubMed] [Google Scholar]
- 5.Jothi R, Kann MG, Przytycka TM. Predicting protein-protein interaction by searching evolutionary tree automorphism space. Bioinformatics. 2005;21(Suppl 1):i241–50. doi: 10.1093/bioinformatics/bti1009. [DOI] [PMC free article] [PubMed] [Google Scholar]
- 6.Kann MG, Jothi R, Cherukuri PF, Przytycka TM. Predicting protein domain interactions from coevolution of conserved regions. Proteins. 2007;67:811–20. doi: 10.1002/prot.21347. [DOI] [PubMed] [Google Scholar]
- 7.Jothi R, Cherukuri PF, Tasneem A, Przytycka TM. Co-evolutionary analysis of domains in interacting proteins reveals insights into domain-domain interactions mediating protein-protein interactions. J Mol Biol. 2006;362:861–75. doi: 10.1016/j.jmb.2006.07.072. [DOI] [PMC free article] [PubMed] [Google Scholar]
- 8.Ramani AK, Marcotte EM. Exploiting the co-evolution of interacting proteins to discover interaction specificity. J Mol Biol. 2003;327:273–84. doi: 10.1016/s0022-2836(03)00114-1. [DOI] [PubMed] [Google Scholar]
- 9.Gertz J, Elfond G, Shustrova A, Weisinger M, Pellegrini M, Cokus S, Rothschild B. Inferring protein interactions from phylogenetic distance matrices. Bioinformatics. 2003;19:2039–45. doi: 10.1093/bioinformatics/btg278. [DOI] [PubMed] [Google Scholar]
- 10.Pazos F, Valencia A. In silico two-hybrid system for the selection of physically interacting protein pairs. Proteins. 2002;47:219–27. doi: 10.1002/prot.10074. [DOI] [PubMed] [Google Scholar]
- 11.Sato T, Yamanishi Y, Kanehisa M, Toh H. The inference of protein-protein interactions by co-evolutionary analysis is improved by excluding the information about the phylogenetic relationships. Bioinformatics. 2005;21:3482–9. doi: 10.1093/bioinformatics/bti564. [DOI] [PubMed] [Google Scholar]
- 12.Tan SH, Zhang Z, Ng SK. ADVICE: Automated Detection and Validation of Interaction by Co-Evolution. Nucleic Acids Res. 2004;32:W69–72. doi: 10.1093/nar/gkh471. [DOI] [PMC free article] [PubMed] [Google Scholar]
- 13.Craig RA, Liao L. Phylogenetic tree information aids supervised learning for predicting protein-protein interaction based on distance matrices. BMC Bioinformatics. 2007;8:6. doi: 10.1186/1471-2105-8-6. [DOI] [PMC free article] [PubMed] [Google Scholar]
- 14.Pazos F, Ranea JA, Juan D, Sternberg MJ. Assessing protein co-evolution in the context of the tree of life assists in the prediction of the interactome. J Mol Biol. 2005;352:1002–15. doi: 10.1016/j.jmb.2005.07.005. [DOI] [PubMed] [Google Scholar]
- 15.Juan D, Pazos F, Valencia A. Co-evolution and co-adaptation in protein networks. FEBS Lett. 2008;582:1225–30. doi: 10.1016/j.febslet.2008.02.017. [DOI] [PubMed] [Google Scholar]
- 16.Fraser HB, Hirsh AE, Steinmetz LM, Scharfe C, Feldman MW. Evolutionary rate in the protein interaction network. Science. 2002;296:750–2. doi: 10.1126/science.1068696. [DOI] [PubMed] [Google Scholar]
- 17.Kim WK, Bolser DM, Park JH. Large-scale co-evolution analysis of protein structural interlogues using the global protein structural interactome map (PSIMAP) Bioinformatics. 2004;20:1138–50. doi: 10.1093/bioinformatics/bth053. [DOI] [PubMed] [Google Scholar]
- 18.Mintseris J, Weng Z. Structure, function, and evolution of transient and obligate protein-protein interactions. Proc Natl Acad Sci U S A. 2005;102:10930–5. doi: 10.1073/pnas.0502667102. [DOI] [PMC free article] [PubMed] [Google Scholar]
- 19.Chakrabarti S, Panchenko A. Coevolution in defining the functional specificity. Proteins. 2009 April;75(1):231–40. doi: 10.1002/prot.22239. [DOI] [PMC free article] [PubMed] [Google Scholar]
- 20.Fraser HB, Hirsh AE, Wall DP, Eisen MB. Coevolution of gene expression among interacting proteins. Proc Natl Acad Sci U S A. 2004;101:9033–8. doi: 10.1073/pnas.0402591101. [DOI] [PMC free article] [PubMed] [Google Scholar]
- 21.Drummond DA, Bloom JD, Adami C, Wilke CO, Arnold FH. Why highly expressed proteins evolve slowly. Proc Natl Acad Sci U S A. 2005;102:14338–43. doi: 10.1073/pnas.0504070102. [DOI] [PMC free article] [PubMed] [Google Scholar]
- 22.Rocha EP, Danchin A. An analysis of determinants of amino acids substitution rates in bacterial proteins. Mol Biol Evol. 2004;21:108–16. doi: 10.1093/molbev/msh004. [DOI] [PubMed] [Google Scholar]
- 23.Hakes L, Lovell SC, Oliver SG, Robertson DL. Specificity in protein interactions and its relationship with sequence diversity and coevolution. Proc Natl Acad Sci U S A. 2007;104:7999–8004. doi: 10.1073/pnas.0609962104. [DOI] [PMC free article] [PubMed] [Google Scholar]
- 24.Juan D, Pazos F, Valencia A. High-confidence prediction of global interactomes based on genome-wide coevolutionary networks. Proc Natl Acad Sci U S A. 2008;105:934–9. doi: 10.1073/pnas.0709671105. [DOI] [PMC free article] [PubMed] [Google Scholar]
- 25.Yeang CH, Haussler D. Detecting coevolution in and among protein domains. PLoS Comput Biol. 2007;3:e211. doi: 10.1371/journal.pcbi.0030211. [DOI] [PMC free article] [PubMed] [Google Scholar]
- 26.Shoemaker BA, Panchenko AR, Bryant SH. Finding biologically relevant protein domain interactions: conserved binding mode analysis. Protein Sci. 2006;15:352–61. doi: 10.1110/ps.051760806. [DOI] [PMC free article] [PubMed] [Google Scholar]
- 27.Swets JA. Measuring the accuracy of diagnostic systems. Science. 1988;240:1285–93. doi: 10.1126/science.3287615. [DOI] [PubMed] [Google Scholar]
- 28.McClish DK. Analyzing a portion of the ROC curve. Med Decision Making. 1989;9:190–195. doi: 10.1177/0272989X8900900307. [DOI] [PubMed] [Google Scholar]
- 29.Gribskov M, Robinson NL. Use of receiver operating characteristic (ROC) analysis to evaluate sequence matching. Comput Chem. 1996;20:25–33. doi: 10.1016/s0097-8485(96)80004-0. [DOI] [PubMed] [Google Scholar]
- 30.Marchler-Bauer A, Anderson JB, Cherukuri PF, DeWeese-Scott C, Geer LY, Gwadz M, He S, Hurwitz DI, Jackson JD, Ke Z, Lanczycki CJ, Liebert CA, Liu C, Lu F, Marchler GH, Mullokandov M, Shoemaker BA, Simonyan V, Song JS, Thiessen PA, Yamashita RA, Yin JJ, Zhang D, Bryant SH. CDD: a Conserved Domain Database for protein classification. Nucleic Acids Res. 2005;33:D192–6. doi: 10.1093/nar/gki069. [DOI] [PMC free article] [PubMed] [Google Scholar]
- 31.Kabsch W, Sander C. Dictionary of protein secondary structure: pattern recognition of hydrogen-bonded and geometrical features. Biopolymers. 1983;22:2577–637. doi: 10.1002/bip.360221211. [DOI] [PubMed] [Google Scholar]
Associated Data
This section collects any data citations, data availability statements, or supplementary materials included in this article.
Supplementary Materials
Table S1 List of the 70 organisms used in all of the experiments.
Table S2 Domain definitions for the interacting protein families.
Table S3 Dependence of ROC values on the size of the binding neighborhood.
Table S4 Number of residues inside and outside the binding neighborhood defined using threshold values of 6 Å, 8 Å, 10 Å and 12 Å.
Table S5 Correlation coefficient for all interacting pairs computed using the orthogonal method for speciation correction.
Table S6 Correlation coefficient for all interacting pairs computed using the non-orthogonal method for speciation correction.


