Abstract
Because loss of podocytes associates with glomerulosclerosis, monitoring podocyte loss by measuring podocyte products in urine may be clinically useful. To determine whether a single episode of podocyte injury would cause persistent podocyte loss, we induced limited podocyte depletion using a diphtheria toxin receptor (hDTR) transgenic rat. We monitored podocyte loss by detecting nephrin and podocin mRNA in urine particulates with quantitative reverse transcriptase–PCR. Aquaporin 2 mRNA served as a kidney reference gene to account for variable kidney contribution to RNA amount and quality. We found that a single injection of diphtheria toxin resulted in an initial peak of proteinuria and podocyte mRNAs (podocin and nephrin) followed 8 d later by a second peak of proteinuria and podocyte mRNAs that were podocin positive but nephrin negative. Proteinuria that persisted for months correlated with podocin-positive, nephrin-negative mRNAs in urine. Animals with persistent podocyte mRNA in urine progressed to ESRD with global podocyte depletion and interstitial scarring. Podocytes in ectatic tubules expressed podocalyxin and podocin proteins but not nephrin, compatible with detached podocytes’ having an altered phenotype. Parallel human studies showed that biopsy-proven glomerular injury associated with increased urinary podocin:aquaporin 2 and nephrin:aquaporin 2 molar ratios. We conclude that a single episode of podocyte injury can trigger glomerular destabilization, resulting in persistent podocyte loss and an altered phenotype of podocytes recovered from urine. Podocyte mRNAs in urine may be a useful clinical tool for the diagnosis and monitoring of glomerular diseases.
The direct relationship between podocyte injury/loss and glomerulosclerosis is now established in both experimental models and human disease.1–13 It should therefore be clinically useful if podocyte loss could be monitored by measuring podocyte products in urine. Hara and colleagues14–19 detected podocytes and fragments of podocytes in the urine of humans with a variety of glomerular diseases using a podocalyxin antibody detection system. Lemley et al.13 demonstrated podocyturia in urine of humans with IgA nephropathy and systemic lupus erythematosus (SLE) in relation to disease activity. Patari et al.20 detected nephrin protein in urine of patients with diabetes by Western blotting. Vogelmann et al.21 and Petermann et al.22 reported that viable podocytes were detected in human and rat urine in health and kidney disease. Garovic et al.23 reported viable podocytes in urine in association with toxemia of pregnancy. We previously demonstrated nephrin mRNA in urine as a marker of podocyte loss in a rat PAN model.3 Szeto and colleagues24–26 reported podocyte mRNAs (nephrin, podocin, and synaptopodin) expressed in the urinary sediment of proteinuric diseases including diabetes and SLE. Yu et al.27 made the case that the identification of podocyte products in urine is a more specific measure of disease activity than is proteinuria.
To evaluate the potential impact of graded podocyte injury, we developed a transgenic (Tg) model [strain F344-Tg(DTR)C354Wig] in which the human diphtheria toxin receptor (hDTR) is expressed specifically on rat podocytes.6 In this model, stages of glomerular injury and sclerosis as defined by Kriz and colleagues2,4–6 can be identified in relation to the degree of podocyte loss. If podocyte depletion is indeed the major mechanism driving progression, then this should be reflected by detection of persistent podocyte products in the urine during long-term progression. To test this hypothesis, we caused a range of initial podocyte injury in heterozygous hDTR Tg rats and measured specific podocyte mRNA products in urine (nephrin and podocin mRNAs) using real-time quantitative PCR.
RESULTS
hDTR Rat Model
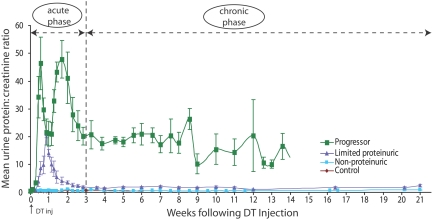
A range of podocyte injury was produced using low-dosage DT (40 ng/kg in 10 ml of normal saline intraperitoneally in 100-g rats) into 17 heterozygous hDTR Tg rats (seven female, 10 male). During the 6-mo observation period, eight rats progressed to end-stage kidney disease (ESKD; defined as “progressors”) and were identified clinically by an initial biphasic peak of proteinuria followed by persistent high-level proteinuria (Figure 1), high-volume urine output, and a scruffy appearance with weight loss as they developed uremia. ESKD was diagnosed by decreasing urine and fecal output and was confirmed by histologic analysis and serum creatinine measurements (Figure 1). Progressor rats were killed at 42, 42, 56, 62, 71, 78, 96, and 98 d after DT injection.
Figure 1.
Four groups based on urine protein:creatinine ratio and serum creatinine: Mean urine protein:creatinine ratio data for four groups of rats. Progressor rats had an initial biphasic peak of proteinuria followed by high level proteinuria until reaching ESKD. Limited proteinuric rats had a single peak of proteinuria that returned to close to control levels. Control and nonproteinuric groups are superimposable and had no increased proteinuria. Serum creatinine values measured at 6 mo or at ESKD were as follows: Control 0.37 ± 0.09 mg/dl; nonproteinuric 0.37 ± 0.10 mg/dl; limited proteinuric 0.30 ± 0.12 mg/dl; progressors 3.03 ± 0.46 mg/dl. Progressors had significantly higher values compared with other groups (P < 0.01, by Kruskal-Wallis test and Scheffe test).
A “limited proteinuric” (n = 4) group, a “nonproteinuric” group (n = 5), and a control group that received no diphtheria toxin (n = 4; two male, two female) were followed for the 175-d time course (Figure 1) and used for comparison with the progressor group. On the basis of the proteinuria, profiles we divided the progression process into an acute injury phase (lasting 21 d) followed by a chronic progression phase defined as beginning at day 22 and lasting until death at ESKD (Figure 1).
Histologic and Morphometric Analysis
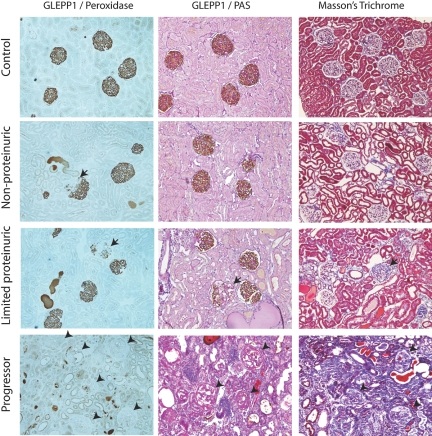
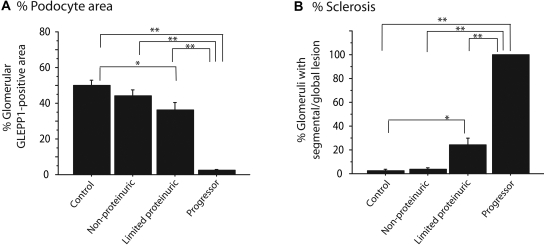
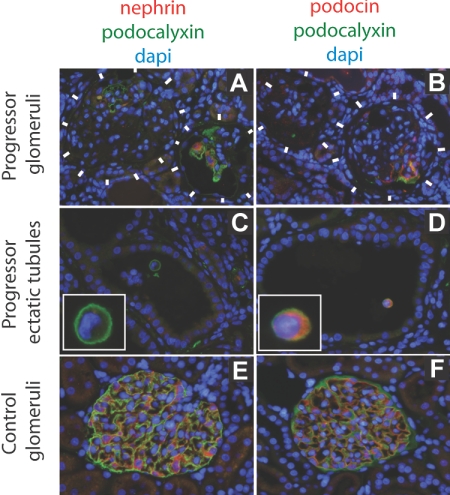
All eight rats that diagnosed clinically as ESKD (progressors) showed >90% loss of podocytes from glomeruli as judged by GLEPP1 immunoperoxidase (Figures 2 and 3). Using WT1 as a podocyte nuclear marker, progressor rats had 8.4 ± 2.5 remaining podocytes per glomerulus compared with 121 ± 25 podocytes per normal glomerulus, a reduction of 93%. Other podocytes markers (podocin, nephrin, and podocalyxin) were similarly markedly reduced or absent from glomeruli at ESRD (Figure 4). There was also widespread interstitial fibrosis and glomerular scarring in progressor rat kidney as judged by Masson's Trichrome staining (Figure 2). Conversely, the limited proteinuric group of rats that showed transient proteinuria had focal and segmental sclerosis and associated focal and segmental absence of podocytes (Figures 2 and 3) and patchy interstitial scarring. The nonproteinuric group had occasional segmental glomerular lesions as shown in Figure 2. Control rats did not show segmental sclerosis or interstitial scarring.
Figure 2.
Representative histology for each group: Podocytes were identified using GLEPP1/peroxidase staining shown without counterstain (left) and with periodic acid-Schiff (PAS)/hematoxylin counterstain (middle). Masson's Trichrome staining is shown on right. From top to bottom, micrographs are from control, nonproteinuric, limited proteinuric and progressor groups. Note that progressors showed almost total loss of peroxidase product indicating loss of almost all podocytes in association with progression (glomeruli shown by arrowheads). In contrast the limited proteinuric group showed patchy loss of podocytes from some glomeruli (arrows). The nonproteinuric group showed an occasional glomerulus with patchy podocytes loss (arrow). Progressors showed extensive interstitial scarring as indicated by Masson's Trichrome staining. Limited progressors showed patchy interstitial scarring.
Figure 3.
Quantification of histology: Quantitative information related to Figure 2. (A) Percentage of glomerular tuft area containing GLEPP1 is significantly reduced in progressors and limited proteinurics in relation to controls. (B) Percentage of glomeruli with segmental or global lesions is significantly increased in progressor and limited proteinuric groups compared with control. *P < 0.05 and **P < 0.01 as assessed by Kruskal-Wallis test and then Scheffe test.
Figure 4.
Immunofluorescent photomicrographs developed for nephrin, podocin, and podocalyxin protein expression in progressor (chronic kidney disease) compared with normal kidney. The immunofluorescent color codes for each protein are shown above each set of panels. (A and B) Progressor (chronic kidney disease) rat glomeruli (delineated by white blocks) show absence of podocyte markers (podocalyxin, nephrin, or podocin) except in parts of glomeruli where intact podocytes still persisted in some glomeruli. (C and D) Podocytes in ectatic tubules in progressor renal cortex contain detached podocytes (identified by intense green podocalyxin immunofluorescent cell surface) that express podocin (D) but not nephrin (C). A higher magnification view of the detached podocytes is shown in the insets. (E and F) Normal glomerular podocytes express podocalyxin, nephrin, and podocin.
Urine RNA Amount and Quality
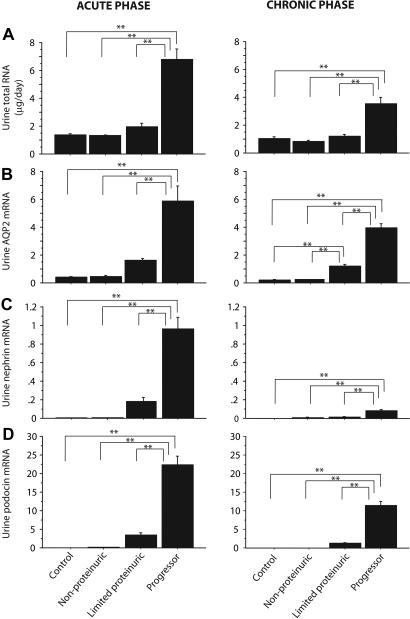
Figure 5A shows the average amounts of RNA excreted per day for the various groups. Progressors had significantly increased urine RNA excretion in both the acute injury phase and the chronic progression phase. The quality of RNA recovered from urine was variable as judged by Agilent Technologies capillary electrophoresis. The average RNA integrity number (RIN) of urine RNA samples was 4.9 ± 1.8 (range 2.4 to 7.8; n = 18 samples tested); the range of RIN is 1 to 10 with 1 being lowest and 10 being highest (see the Concise Methods section). For comparison, two RNA samples purified from isolated rat glomeruli by the same method gave RINs of 8.8 and 8.9; therefore, as expected, the RNA obtained from urine is variably degraded. There was no correlation between amount of RNA excreted and RIN (r2 = 0.05) or the amount of proteinuria and RIN (r2 = 0.0005).
Figure 5.
RNA parameters for the progressor group: Excretion of total RNA (A), urine AQP2 mRNA (B), urine nephrin mRNA (C), and urine podocin mRNA (D) for the acute (left) and chronic (right) progressor phases of injury. *P < 0.05 and **P < 0.01 as assessed by Kruskal-Wallis test and then Scheffe test. Unless otherwise specified, units are arbitrary, based on standard curves from wild-type animals as described in the Concise Methods section.
Aquaporin 2 as a Kidney-Derived Reference Gene
To account for variability in amount and quality of recovered urine RNA and contamination from other sources and to facilitate the use of spot urine samples for measurement, we sought a robustly expressed kidney-specific reference gene to represent kidney RNA from the nonglomerular compartment. Immunofluorescent analysis using antibodies to various markers in the normal and end-stage rat kidney showed that aquaporin 2 (AQP2) continued to be expressed by the collecting ducts of functioning nephrons in end-stage kidneys (data not shown). AQP2 mRNA was detectable in 70.3% of control rat urine samples (n = 276). Figure 5B shows that AQP2 expression was increased in association with progression and to a lesser but still significant extent in rats with limited proteinuria for both the acute and chronic phases of injury. A similar result was observed for uromodulin mRNA (data not shown). We conclude that both the acute injury and chronic progression processes were associated with increased loss of nonpodocyte kidney RNA species into the urine in both the acute and chronic phases.
Urine Podocyte mRNA Excretion
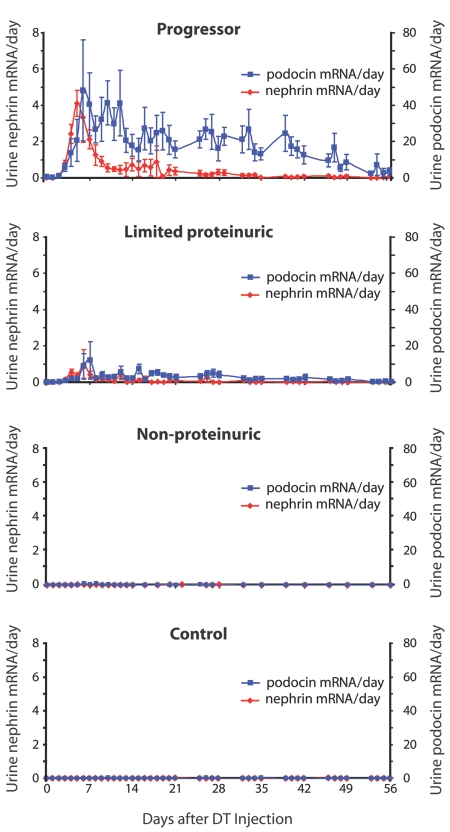
Figure 5, C and D, shows mean nephrin and podocin mRNA excretion during the acute injury and chronic progression phases. Figure 6 shows the time course for the podocyte mRNAs in the various groups. There was significantly increased nephrin and podocin mRNA excretion in rats that progressed. Podocin mRNA was robustly expressed in urine during the chronic progression period. There was markedly less urine nephrin and podocin mRNA in the limited proteinuria group and barely detectable or undetectable increases in nephrin and podocin mRNAs in the nonproteinuric and control groups (Figures 5, C and D, and 6).
Figure 6.
Comparison of urine nephrin and podocin mRNA excretion between groups through day 56: The progressor group excreted high-level urine nephrin mRNA (red) as an initial peak followed by low-level mRNA excretion. Podocin mRNA (blue) was excreted persistently throughout the time course. A similar pattern but reduced in quantity was seen for the limited proteinuric group. Unless otherwise specified, units are arbitrary, based on standard curves from wild-type animals as described in the Concise Methods section.
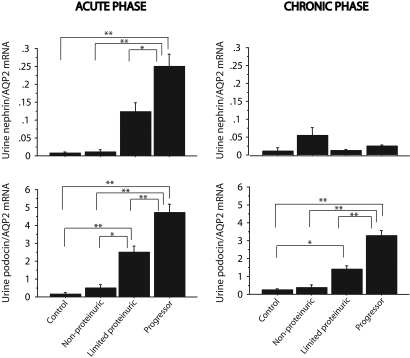
Because urine AQP2 mRNA also increased in progressors, we expressed podocyte mRNAs as a ratio to AQP2 to examine the relative increase in podocyte mRNAs detected over and above that for AQP2 (Figure 7). The nephrin:AQP2 ratio was increased in the acute phase for progressors; however, for the chronic phase, there was no statistical increase in nephrin:AQP2 ratio in progressors compared with other groups. In contrast, the podocin:AQP2 ratio was significantly increased in progressors compared with other groups for both the acute injury phase and the chronic progressor phase.
Figure 7.
Urine nephrin and podocin mRNA expressed as a ratio with AQP2 mRNA. In the acute phase (left), both nephrin:AQP2 (top) and podocin:AQP2 (bottom) mRNA ratios were highest in progressors and still significantly increased in limited proteinurics. In the chronic phase (right), only urine podocin:AQP2 (bottom) ratios remained significantly increased. *P < 0.05 and **P < 0.01 as assessed by Kruskal-Wallis test and then Scheffe test.
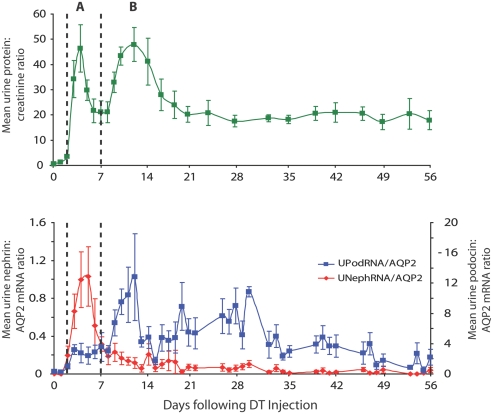
Figure 8 shows the temporal relationship between nephrin and podocin mRNA excretion in urine for the progressor group in relation to proteinuria. Figure 8, top, shows the biphasic peak of proteinuria seen after DT injection, which is followed by long-term sustained proteinuria in the progressor group. The nephrin:AQP2 ratio peak corresponds closely to the first proteinuria peak seen in the acute phase. The second proteinuria peak corresponds to the podocin:AQP2 peak of mRNA in urine. The high level of sustained proteinuria in progressors correlates with continued podocin:AQP2 mRNA in urine.
Figure 8.
Time course of proteinuria versus urine nephrin:AQP2 and podocin:AQP2 excretion in progressors. The urine protein:creatinine ratio profile (top) shows two peaks (A and B) during the initial injury phase as indicated by the dotted lines. The first peak (A) corresponds temporally to the nephrin:AQP2 mRNA peak, and the second peak (B) corresponds to the podocin:AQP2 peak (bottom). Persistent proteinuria during the chronic phase of progression corresponds to continued high-level podocin:AQP2 and low-level nephrin:AQP2 mRNA excretion.
The seeming discrepancy between nephrin and podocin mRNA profiles in urine was confirmed by time-course correlation analysis (Table 1). There was no temporal correlation between nephrin mRNA excretion and podocin mRNA excretion in urine (r2 = 0.17), thereby suggesting that these podocyte markers are not identifying the same populations of cells in urine. In addition, nephrin profiles obtained using a second independent set of rat nephrin primers were consistent (r2 = 0.74; n = 35). The podocin mRNA profile correlated closely with the podocalyxin mRNA profile (r2 = 0.61; n = 70) but not the nephrin mRNA profile (r2 = 0.26; n = 70), thereby linking these podocin data to previous reports using podocalyxin as a marker for urine podocytes.
Table 1.
Correlation coefficients between probesa
| Probe A | Probe B | r2 | n |
|---|---|---|---|
| Nephrin | Nephrin | 0.74 | 35 |
| Nephrin | Podocin | 0.17 | 1153 |
| Nephrin | Podocalyxin | 0.26 | 70 |
| Nephrin | GLEPP1 | 0.02 | 70 |
| Nephrin | WT1 | 0.26 | 70 |
| Nephrin | AQP2 | 0.12 | 1149 |
| Nephrin | GAPDH | 0.22 | 35 |
| Podocin | Podocalyxin | 0.61 | 70 |
| Podocin | GLEPP1 | 0.51 | 70 |
| Podocin | WT1 | 0.44 | 70 |
| Podocin | AQP2 | 0.33 | 1148 |
| Podocin | GAPDH | 0.23 | 35 |
Correlation coefficients (r2) between probe sets used to measure the relative amounts of mRNAs in urine over the time course of progression.
We conclude that two podocyte phenotypes are identifiable in the urine of progressor rats. These include a nephrin-positive (and podocin-positive) phenotype present in the acute phase immediately after DT injection and associated with the first proteinuria peak. A nephrin-negative, podocin/podocalyxin/GLEPP1-positive podocyte phenotype was present in association with the second wave of proteinuria and persisted for several months during the progression process in rats that progressed to ESKD but not in those that did not progress. Nephrin-negative but podocin-positive detached podocytes were also identified in ectatic tubules of progressor rats (Figure 4). These data are consistent with the concept that detached podocytes lose their nephrin expression at both the mRNA and protein levels during the progression phase of glomerular injury.
Quantitative Analysis Based on Podocin mRNA Excretion
Table 2 shows that podocin mRNA loss in urine during the chronic progression phase was on average 230-fold higher than in normal rats (ranging from 40-fold in slow progressors to 350-fold in rapid progressors). This is in contrast to nonproteinuric and nonprogressor rats, in which the rate of urine podocin mRNA loss during the chronic phase was not significantly different from control. On the basis of assumptions outlined in the Concise Methods section, we estimate that progressor rats were losing on average 130,000 podocyte-equivalents in their urine per day compared with approximately 500 to 600 podocyte-equivalents per day found in normal and nonprogressor rat urine.
Table 2.
Chronic phase urine podocin mRNA and podocyte-equivalents per daya
| Group | n | Urine Podocin mRNA (ng/d)
|
Urine Podocyte-Equivalents per Day
|
||
|---|---|---|---|---|---|
| Mean ± SD | Range | Mean ± SD | Range | ||
| Normal | 4 | 0.06 ± 0.10 | 0.00 to 0.21 | 552 ± 935 | 0 to 1944 |
| Nonproteinurics | 5 | 0.06 ± 0.03 | 0.00 to 0.08 | 561 ± 316 | 0 to 741 |
| Limited proteinurics | 4 | 1.27 ± 0.76 | 0.46 to 2.14 | 11,782 ± 7056 | 4259 to 19814 |
| Progressors | 8 | 14.04 ± 11.22b | 11.00 to 36.00 | 129,977 ± 103,916b | 24,074 to 333,333 |
Values for podocyte-equivalents per day were calculated using a recovery rate of 0.03% (see the Concise Methods section).
P < 0.01 compared with the data sets above in that column. These data assume that podocin mRNA in detached podocytes remains constant and similar to that of glomerular podocytes.
Correlation between Proteinuria and Urine Podocyte mRNAs
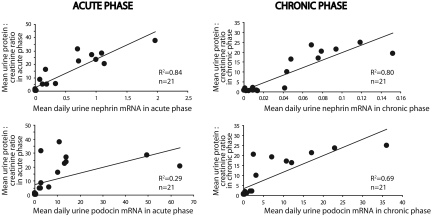
If urine podocyte markers reflect the degree of podocyte loss, then they should correlate with the degree of proteinuria. As shown in Figure 9, this was indeed the case. The level of proteinuria in the acute phase correlated closely with the nephrin mRNA excretion (r2 = 0.84) but less well with the podocin mRNA excretion (r2 = 0.29). Proteinuria in the chronic phase correlated with both the low-level nephrin (r2 = 0.80) and high-level podocin (r2 = 0.69) mRNA excretion.
Figure 9.
Relationship between proteinuria and mRNA excretion of urine nephrin and podocin: In the acute phase (left), proteinuria correlated highly with urine nephrin mRNA excretion (top; r2 = 0.84) but not with urine podocin mRNA excretion (bottom; r2 = 0.29). In the chronic phase (right), both nephrin and podocin mRNA correlated with proteinuria (r2 = 0.80 and 0.69, respectively). Unless otherwise specified, units are arbitrary, based on standard curves from wild-type animals as described in the Concise Methods section.
Systolic BP
Systolic BP (SBP) of rats that progressed to ESKD was significantly higher than controls as assessed by the “last measured” SBP (P < 0.05; progressors 194 ± 6 mmHg; limited proteinuria 162 ± 8; nonproteinuric 140 ± 7; controls 153 ± 10). The last measuring days of the progressor rats were approximately 1 wk before being killed and at 5 mo after DT injection for the other groups.
Human Urine mRNA
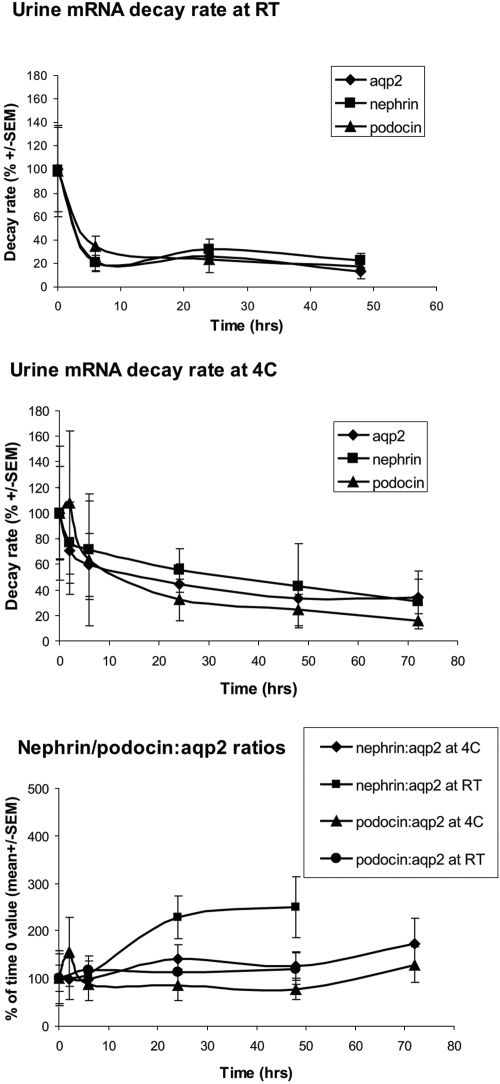
To confirm that the urine mRNA system developed for the rat can be applied to the clinic, we examined urine from patients with biopsy-proven glomerular disease as a result of SLE. Nephrin, podocin, and AQP2 mRNAs were detectable in normal human urine. The measured amounts of each mRNA decreased in urine samples stored at both 4°C (30 to 40% by 6 h) and room temperature (80% by 6 h), but the ratio of nephrin:AQP2 or podocin:AQP2 mRNA did not change significantly up to 48 h of storage at 4°C (Figure 10). Data are therefore presented as the nephrin:AQP2 or podocin:AQP2 molar ratios (MRs). The upper limit of the normal MR ranges (mean ± 2 SD) were established from eight normal humans under conditions of fasting, nonfasting, time of day, storage, and exercise (n = 100; Table 3). None of these physiologic stimuli changed the MRs.
Figure 10.
Human urine RNA decay rates: mRNAs from normal subjects decayed rapidly at room temperature (RT; top). The rate of decay was slower at 4°C (middle), but, by 6 h, 30 to 40% decay was observed for all mRNAs. The rate of decay was similar for all mRNAs so that expression of podocyte mRNA data divided by a reference gene (AQP2) was relatively constant even after 48 h at 4°C (bottom).
Table 3.
Human SLE urine podocyte mRNA studya
| Patient | Age/Gender | Duration of SLE | SCr (mg/dl) | Up:Cr | Renal Biopsy Findings | Unep:AQP2 MR (ULNR = 2.1) | Upod:AQP2 MR (ULNR = 0.26) |
|---|---|---|---|---|---|---|---|
| 1 | 21/F | 2 yr | 1.0 | 5.9 | DPGN (WHO IV), 7/12 crescentic glomeruli, focal mild interstitial scarring | 3.0 | 1.6 |
| 2 | 34/F | 7 yr | 0.9 | 2.9 | Severe DPGN (WHO IV), 3/13 crescentic glomeruli, no interstitial changes | 10.9 | 4.4 |
| 3 | 19/M | 3 mo | 0.8 | 1.6 | Membranous GN (WHO V), no global glomerulosclerosis, diffuse mild interstitial fibrosis | 3.1 | 1.4 |
| 4 | 41/F | >11 yr | 0.7 | 4.3 | Membranous GN (WHO V), mild focal proliferation, no glomerulosclerosis, focal mild interstitial fibrosis | 0.2 | 0.1 |
DPGN, diffuse proliferative glomerulonephritis; SCr, serum creatinine; ULNR, upper limit of normal range; Unep, urine nephrin; Upod, urine podocin; Upr:Cr, urine protein-creatinine ratio; WHO, World Health Organization.
Urine from four patients with SLE-associated glomerular disease was evaluated at renal biopsy (Table 3). Three patients with diffuse proliferative glomerulonephritis or membranous glomerulonephropathy had elevated MRs for both nephrin:AQP2 MR (1.3- to five-fold) and podocin:AQP2 MR (five- to 17-fold). One patient with longstanding membranous glomerulonephropathy with proteinuria and stable normal renal function for >11 yr had MR values in the normal range. This result confirms that podocyte mRNA products are detectable in normal human urine, that a kidney reference gene can be a useful method for adjusting data for RNA stability and other confounding variables, that proteinuria per se was not associated with elevated MRs, and that podocyte MRs are increased in association with active glomerular injury such as occurs in lupus nephritis.
DISCUSSION
The podocyte hypothesis predicts that progression will be associated with continued podocyte loss from glomeruli. Consistent with this hypothesis, we observed persistent podocyte mRNAs in urine for months as progression occurred. Quantification (making the critical assumption that the amount of podocin mRNA per podocyte is a constant) revealed that normal and nonproteinuric rats excreted approximately 500 to 600 podocyte-equivalents (0.006%) of podocin mRNA per day. In contrast, progressor rats excreted a 230-fold higher rate of podocyte-equivalents of podocin mRNA in urine (mean 130,000 podocyte-equivalents per day). Progressor rats lost from 24,000 podocyte-equivalents (0.2%) per day (slow progressor) up to 333,000 podocyte-equivalents (3%) per day (rapid progressor). This result therefore directly supports a key role for podocyte loss in the progression process. Furthermore, glomeruli became substantially depleted of podocytes (>90%) as demonstrated by both podocyte counting using the WT1 podocyte nuclear marker and immunofluorescence for the podocyte markers nephrin, podocin, podocalyxin, and glepp1. Global depletion of podocytes was therefore associated with reaching ESKD, further linking the progression process to podocyte depletion and compatible with the concept that intact podocytes are necessary for glomerular maintenance.
A single limited episode of podocyte injury and loss triggered subsequent prolonged podocyte loss leading to ESKD. The implication is that whatever the initial mechanism of podocyte injury, an autonomous process that can lead to progression through further podocyte loss can supervene. This process is likely analogous to both the “hyperfiltration hypothesis” of Brenner et al.28 and the “podocyte damage damages podocytes” hypothesis suggested by Ichikawa et al.29 The mediators of these events are not yet well understood but may include angiotensin 2 and be susceptible to therapeutic manipulation.30
Different urine podocyte phenotypes were identifiable through urine mRNA monitoring. We identified an initial nephrin-positive (and podocin-positive) podocyte phenotype in urine during the acute injury phase analogous to the podocyte phenotype found in the normal glomerulus. This podocyte phenotype was present in urine coincident with the first peak of proteinuria after acute DT-induced podocyte injury; however, the second peak of proteinuria, which we hypothesize is caused by the “podocyte damage damages podocytes” phenomenon described by Ichikawa et al.,29 was associated with podocyte mRNAs that were podocin and podocalyxin positive but nephrin negative. This conclusion was further supported by identifying podocalyxin- and podocin-positive but nephrin-negative podocytes in ectatic tubules of progressor rats. This would also be compatible with previous reports in which nephrin was not found to be a good marker of urine podocytes in contrast to podocalyxin and podocin.14,18,31 Podocyte detachment may therefore require a phenotypic switch that downregulates nephrin expression, thereby allowing a detaching podocyte to disengage from its neighbors. This result also suggests that the biology of the glomerular podocyte may be monitored by urine mRNA analysis and that clinically useful diagnostic and therapeutic parameters may be available through this approach.
Urine podocyte mRNAs can be semiquantified and used for analysis of the events taking place in the kidney. We previously reported detection of mRNA for nephrin in rat urine after PAN injury.3 Szeto and colleagues24–26 have since reported detecting podocyte mRNAs in human urine and have linked this to progression in patients with glomerular diseases including diabetes and SLE. An innovation reported here is the use of a kidney-specific reference gene mRNA that is robustly expressed even in the end-stage kidney. This approach has several advantages: It allows for spot urine sample analysis, variations in proportion of RNA recovered from kidney as opposed to the numerous other sources of RNA that could end up in the urine, variations in RNA quality and degradation between samples, and variations in efficiency of the reverse transcriptase–PCR (RT-PCR) step. We elected to use AQP2 mRNAs as our reference gene in this report, but other kidney-specific candidates may turn out to be preferable.
Finally, we confirmed that the observations made in rat urine could potentially be extended to patients with glomerular diseases. We found that podocyte mRNA products were detectable in normal human urine and that differences in mRNA stability during urine storage could be accounted for by using the reference kidney gene (AQP2). Three patients with active glomerular disease as a result of SLE had significantly increased urine podocin:AQP2 MRs (five- to 17-fold increased above the upper limit of the normal range). The urine nephrin:AQP2 MRs were also elevated above the upper limit of the normal range (2.5- to six-fold). A patient with longstanding membranous lupus nephropathy and proteinuria with stable normal renal function did not have elevated MRs. The podocyte mRNA:AQP2 ratios therefore seemed to be a potentially clinically useful indicator of podocyte injury as predicted from the rat studies. Szeto and colleagues26 also found urine podocin mRNA to correlate with progression in human diabetic glomerulosclerosis.
Other investigators have demonstrated the presence of podocytes in urine using antibodies to podocalyxin and podocin and have correlated podocyturia with outcome in a range of human glomerular diseases.13–23 Fragments of podocytes have also been demonstrated in human urine.18 We initially identified microvesicles in urine and demonstrated their apparent release from podocytes during injury in an anti–glomerular basement membrane model in the rabbit using a procoagulant assay system to quantify and identify these structures.30 We also demonstrated the presence of microvesicles in normal human urine (termed “urosomes”).32 Knepper and colleagues33,34 characterized urine exosomes and defined a urine exosome proteome that includes podocin and podocalyxin. For the studies described, the centrifugation step would predominantly pellet whole cells; however, it is possible that podocyte mRNAs could be packaged and protected from degradation within lipid membranes as microvesicles and that their association with larger structures in urine (e.g., polymerized Tamm-Horsfall protein) might allow them to be pelletted under the conditions used for the assay.30,32 Both RNA and micro-RNAs have been shown to travel via microvesicles.35,36 Further studies will be required to evaluate the possibility that downstream nephron signaling can occur via this mechanism.
CONCISE METHODS
Experimental Design
All animal studies were approved by the University of Michigan Committee on Use and Care of Animals. Heterozygous hDTR Tg rats received an injection of DT in normal saline containing 0.1 mg/ml rat albumin as a carrier (n = 17; 11 male, six female) or normal saline containing rat albumin at 0.1 mg/ml as controls (n = 4; two male, two female). Rats were injected intraperitoneally when they reached approximately 100 g of weight. Then they were kept on an ad libitum rat food and water diet until they were killed under anesthesia for analysis up to 175 d. All studied rats were kept in metabolic cages. We performed daily urine collection for 4 wk, followed by 4 d/wk urine collection for 8 wk and subsequent 1-wk urine collections at monthly intervals. All rats were inspected daily and evaluated for lethargy, ruffled fur, and failure to eat or drink as assessed by reduced urine volume and feces production as evidence for uremia. Eight progressor rats were killed before the 6-mo time point as noted in the Results section. In these experiments, a variable portion of the injected DT in 10 ml of saline leaked out of the peritoneal cavity through the injection site. Some rats therefore received a lower dosage of DT than others, resulting in a variable level of podocyte injury (see below for data on uniformity of transgene expression and intrinsic model reproducibility in response to DT injection).
RNA from Urine Sediments
To maximize RNA harvest, we washed metabolic cage collection surfaces thoroughly and rinsed with alcohol every afternoon, urine collection tubes were set up, and the urine was harvested the next morning. Average collected time was approximately 14 h/d. The urine samples were centrifuged at 3200 × g for 15 min at 4°C. Urine was removed and the remaining pellet was suspended in 1.5 ml of DEPC-treated PBS then centrifuged 13,000 × g for 5 min at 4°C. The pellet was suspended in 1.0 ml of Trizol (cat. no. 15596-026; Invitrogen, Carlsbad, CA) and stored at −80°C until use. Total RNA was isolated using the protocol of the Trizol Reagent and RNeasy Mini Kit (cat. no. 74106; Qiagen, Valencia, CA). The contaminating chromosomal DNA was digested with RNase-Free DNase (cat. no. 79254; Qiagen). The coefficient of reproducibility of RNA recovery was 28% (n = 6). The 300 ng of RNA was reverse-transcribed to cDNA using High-Capacity cDNA Reverse Transcription Kits (Applied Biosystems, Foster City, CA) and stored at −20°C until use.
RNA Quality Analysis
RNA was analyzed by the University of Michigan Affymetrix Core using Agilent Technologies and both the Nano and Pico systems (Agilent Technologies, Santa Clara, CA). RINs are used as a measure of RNA quality as defined (http://www.agilent.com/chem/labonachip).
Quantitative Real-Time PCR
Quantification of the absolute nephrin, podocin, AQP2, podocalyxin, uromodulin, GLEPP1, WT1, and glyceraldehyde-3-phosphate dehydrogenase mRNA abundance was performed using the 7900 HT Fast Real-Time PCR System (Applied Biosystems) using TaqMan Fast Universal PCR Master Mix, with sample cDNA in a final volume of 10 μl per reaction. TaqMan Probes (Applied Biosystems) used were as follows: Rat homologue for NPHS1 (nephrin) spanned exons 20 to 21 (cat. no. Rn00575235_m1, for regular use); rat homologue for NPHS1 spanned exons 6 to 7 (cat. no. Rn01457444_g1, alternative nephrin primer/probe set), rat homologue for NPHS2 (podocin) spanned exons 3 to 4 (cat. no. Rn00709834_m1); rat AQP2 spanned exons 1 to 2 (cat. no. Rn00563755_m1), rat Podxl (podocalyxin) spanned exons 4 to 5 (cat. no. Rn00593804_m1), rat Umod (uromodulin or Tamm-Horsfall protein) spanned exons 9 to 10 (cat. no. Rn00567180_m1), rat GLEPP1 (Ptpro) spanned exons 11 to 12 (cat. no. Rn01462616_m1), rat WT1 (Wilms’ tumor 1) spanned exons 7 to 8 (cat. no. Rn00580566_m1), and rat GAPDH (glyceraldehyde-3-phosphate dehydrogenase) was within exon 3 (cat. no. Rn99999916_s1). All data were from 100 ng of sample cDNA. Standards were obtained from glomerular or cortical RNA prepared from a wild-type rat. For these experiments, glomeruli (or cortex) were isolated by sieving and RNA was extracted as described already, then reverse-transcribed to cDNA. Glomerular or cortical standards of 100, 10, 1, 0.1, and 0.01 ng of cDNA were used for the nephrin, podocin, and podocalyxin mRNA assays. The source glomeruli used to prepare cDNA standards used for nephrin mRNA assays were from a different animal than that used to prepare cDNA standards for the other probes. The cDNA standards for AQP2 and Umod were prepared from wild-type rat kidney cortex and diluted as described already. Standard curves were constructed using these serially diluted standards. CT value was used to analyze the level of mRNAs from standard curve with the software SDS 2.2.2 (Applied Biosystems). The intra-assay reproducibility gave r2 values of 82 and 96% (n = 2 experiments). The coefficient of assay variation starting with crude urine and taking individual samples through to final assay for nephrin, podocin, and AQP2 were 54, 61, and 24%, respectively (n = 6). For these calculations, the amount of UNephRNA in nonprogressor groups present in the equivalent of the acute or chronic phases could not be defined by peaks of UNephRNA; therefore, they were designated as days 0 to 21 for the acute phase and days 22 to 45 for the chronic phase, on the basis of the time course of the progressor group.
Histologic Analysis
All histology was performed on paraformaldehyde/lysine/periodate-perfused and fixed kidney tissue followed by paraffin embedding for sectioning as described previously.6
Quantification of Glomerular Segmental/Global Lesions
A murine anti-rat GLEPP1 mAb was used as a podocyte marker as described previously.6 Four-micrometer sections were stained with anti-GLEPP1 peroxidase/DAB. Results were obtained by counting at least 100 glomerular cross-sections and determining the proportion in which patchy or global loss of DAB staining was present in the glomerular tuft.
Quantification of GLEPP1-Positive and Periodic Acid-Schiff–Positive Glomerular Areas
Staining was done on 4-μm sections as outlined in the previous section. Podocytes were identified using peroxidase/DAB immunohistochemistry using the monoclonal anti-rat GLEPP1 as primary antibody.6 Sections were counterstained with periodic acid-Schiff and hematoxylin. Thus, podocytes were stained brown; nuclei were stained blue; and the remaining mesangial cells, mesangial matrix, and endothelial cells were stained pink. The area of the glomerulus that stained brown by peroxidase product was measured as a proportion of the total glomerular area in at least 50 consecutive glomerular cross-sections photographed on computer software and analyzed using the Metamorph Imaging System (Universal Imaging Corp., Downingtown, PA) as described previously.6 The glomerular podocyte area was expressed as a percentage of total glomerular area.
Podocyte Counts per Glomerulus
Podocyte counts per glomerulus were performed as described previously using the two-section thickness method.37 In parallel studies, this method correlated with the GLEPP1-positive area method outlined in the previous section (r2 = 0.88).
Immunofluorescence Studies
Paraformaldehyde/lysine/periodate-fixed paraffin-embedded 4-μm sections of progressor rat kidney and normal kidney were deparaffinized and incubated for 4 h at 92°C with Retrieve-All (Signet Laboratories, Dedham, MA) for antigen unmasking. They were developed using rabbit anti-murine nephrin and rabbit anti-podocin antibodies (supplied by Dr. Larry Holzman, University of Michigan, Ann Arbor, MI). The murine monoclonal anti-podocalyxin antibody 2A4 was produced as previously reported.38 FITC- and Cy3-labeled secondary antibodies were purchased from Jackson ImmunoResearch (West Grove, PA). Sections were mounted in DAPI-containing mounting fluid (SlowFade; Invitrogen, Eugene, OR) and photographed using a Leica DM inverted microscope (Banockburn, IL) and a SPOT camera system (Diagnostic Instruments, Sterling Heights, MI).
Quantification of Podocin mRNA Excretion
The standard curves used for mRNA quantification were derived from known numbers of isolated glomeruli. A total of 95% of podocytes were lost from progressor rat glomeruli by the time they reached ESKD (Figure 3A). We can therefore estimate the proportion of total glomerular podocin mRNA that was recovered in the urine of progressing rats by the time they reached ESKD. This value was 0.03 ± 0.02% (1 SD; n = 8). This calculation assumes that the relationship between podocyte podocin mRNA in urine and in the normal glomerulus remained constant during the disease process. The data in Table 2 compare the excretion rates of podocin mRNA in different groups. Assuming there are approximately 76,000 glomeruli per rat39 and each rat glomerulus contains 128 podocytes,37 there are 9.7 × 10⁶ podocytes per rat. These values were used to calculate the excretion of podocyte-equivalents shown in Table 2.
Urine Protein and Creatinine Assays
Urine and serum creatinine measurements were performed using the Sigma Creatinine kit (cat. no. 555-A; St. Louis, MO) or the Teco Diagnostics Creatinine kit (cat. no. C513-480; Anaheim, CA). For protein measurements, urine samples were precipitated with an equal volume of 30% TCA, dissolved in 1 M NaOH, then assayed using the Bio-Rad Protein Assay (cat. no. 500-0006; Hercules, CA) as described previously.6 Urine protein was expressed as the protein:creatinine ratio.
BP
BP was measured by the tail-cuff technique at approximately monthly intervals during the study period. Before measurement, the rats were anesthetized using isofluorane (4% induction and 1.5% maintenance) and placed on a warming pad to maintain their temperature. Eight tail-cuff BP measurements were taken for each rat at each time point (IITC Life Science, Woodland Hills, CA) as previously reported.40 The tail-cuff method of measuring BP is less precise than direct intra-arterial monitoring and gave higher values for SBP than expected for controls. Nevertheless, this method is adequate for comparisons between groups.
Reproducibility of the hDTR Model
One potentially important reason for nonreproducibility of the model would be mosaicism of transgene expression. We therefore formally addressed this question as follows: Transgene (human HB EGF) expression was compared in homozygous, heterozygous, and wild-type Fischer 344 rat glomeruli at both the mRNA and protein levels. Rat glomerular RNA prepared as outlined already was used to measure the relative amount of transgene mRNA in relation to the podocyte marker nephrin mRNA using quantitative RT-PCR (human HB-EGF TaqMan probe spanning exons 4 to 5; cat. no. Hs00181813_m1) expressed as a ratio to nephrin mRNA (TaqMan probe spanning exons 20 to 21; cat. no. Rn00575235_m1). The homozygous rat glomerular transgene:nephrin mRNA ratio was normalized to 100%. The values obtained (mean ± 1 SD) were as follows: Homozygous 100 ± 13% (n = 10), heterozygous 55 ± 11% (n = 10), and wild-type undetectable (n = 6). A similar approach was used for glomerular protein expression. Isolated glomerular transgene protein expression measured by Western blot (using goat polyclonal antibody AF-259-NA; R&D Systems, Minneapolis, MN) was expressed as a ratio with the podocyte marker GLEPP1 (using monoclonal murine antibody 1B4). The homozygous rat glomerular transgene:GLEPP1 ratio was normalized to 100%. The values obtained were as follows: Homozygous 100 ± 17% (n = 6), heterozygous 53 ± 17% (n = 9), and wild type undetectable (n = 5). Therefore, both transgene mRNA and protein were expressed in glomeruli at approximately 50% in heterozygotes compared with homozygotes and were undetectable in wild-type glomeruli.
To examine the relative distribution of the transgene within and between glomeruli, we used double-label immunofluorescence comparing transgene expression (using goat polyclonal AF-259-NA) with GLEPP1 expression (using monoclonal mouse antibody 1B4) in DAPI-stained sections of homozygous (n = 8), heterozygous (n = 16), and wild-type rats (n = 5). We found no significant discrepancies in signal expression between transgene and GLEPP1 protein expression within or between glomeruli in either homozygous or heterozygous glomeruli. No detectable signal was seen in wild-type rat glomeruli.
As a further test of reproducibility of the model to DT, we measured the effect of low-dosage intravenous diphtheria toxin injections (12.5 ng/kg) in heterozygous rats. The values for urine protein:creatinine ratio at 7 d were as follows: Mean 8.4 ± 2.2 (1 SD), range 5.9 to 13.7 (n = 13). For comparison, the urine protein:creatinine ratio at high-dosage DT is in the 60 to 80 range. This result therefore confirms that the model was very reproducible in response to intravenous DT (in contrast with intraperitoneal injection of DT used in these studies), even at a low dosage in the steep part of the DT dose-response curve; therefore, the variability of response seen in these experiments was not due to intrinsic variability of response to DT between individual animals.
Human Urine mRNA Analysis
Urine collection was approved by the University of Michigan human studies committee (IRB HUM2468 and 4729). Random urine samples were collected from four patients with SLE at the time of renal biopsy (Table 3). Urine samples were collected from eight normal individuals (ages 30 to 63, six men, two women) to evaluate impact of time of day, hydration, exercise, and storage of urine at 4°C and at room temperature (n = 100 samples). These urine samples were collectively used to establish a normal range. RNA from human urine was processed as described for rat urine. For quantitative RT-PCR assay, standard curves were constructed for nephrin (using a full-length 6.2-kb cDNA construct provided by Dr. Larry Holzman), podocin (using a full-length cDNA 6.1-kb construct provided by Dr. Geraldine Mollet, Hôpital Necker-Enfants Malade, Paris, France), and for AQP2 (using a 7.1-kb construct provided by Peter Deen, Nijmegan, Netherlands). TaqMan Probes (Applied Biosystems) were as follows: Nephrin Hs 00190446-m1, podocin Hs 00922492-m1, and AQP Hs 00166640-m1. Data were corrected according to the differences in molecular weight of the cDNAs used for the standard curves so as to be able to express ratios in molar terms (i.e., the MR of nephrin:AQP2 or podocin:AQP2).
Statistical Analysis
Statistical analysis was performed using StatView 5.0 for Windows (SAS Institute, Cary, NC). All results were presented as means ± SE unless otherwise stated. Significance of difference among groups was tested by Kruskal-Wallis test. When the Kruskal-Wallis test was significant, a Scheffe test was carried out for post hoc analysis. P < 0.05 was considered statistically significant. Correlations between several parameters were compared by single regression analysis.
DISCLOSURES
None.
Acknowledgments
We are grateful for support from the National Institute of Diabetes and Digestive and Kidney Diseases branch of the National Institutes of Health (grants DK RO1 46073 and P50 DK39253).
Parts of this work were presented in abstract form at the annual meeting of the American Society of Nephrology: November 1 through 4, 2007, in San Francisco, CA, and November 6 through 9, 2008, in Philadelphia, PA.
We are grateful to Dr. Puneet Garg for help with cDNAs. We acknowledge help from Drs. Larry Holzman, Puneet Garg, David Kershaw, Pandu Rao, and Joseph McCune.
Published online ahead of print. Publication date available at www.jasn.org.
REFERENCES
- 1.Wiggins R: The spectrum of podocytopathies: A unifying view of glomerular diseases. Kidney Int 71: 1205–1214, 2007 [DOI] [PubMed] [Google Scholar]
- 2.Kriz W, Gretz N, Lemley KV: Progression of glomerular diseases: Is the podocyte the culprit? Kidney Int 54: 687–697, 1998 [DOI] [PubMed] [Google Scholar]
- 3.Kim YH, Goyal M, Kurnit DM, Wharram BL, Wiggins JE, Holzman LB, Kershaw DB, Wiggins RC: Podocyte depletion and glomerulosclerosis have a direct relationship in the PAN-treated rat. Kidney Int 60: 957–968, 2001 [DOI] [PubMed] [Google Scholar]
- 4.Kriz W: Podocyte is the major culprit accounting for the progression of chronic renal disease. Microsc Res Tech 57: 189–195, 2002 [DOI] [PubMed] [Google Scholar]
- 5.Kriz W, LeHir M: Pathways to nephron loss starting from glomerular diseases: Insights from animal models. Kidney Int 67: 404–419, 2005 [DOI] [PubMed] [Google Scholar]
- 6.Wharram BL, Goyal M, Wiggins JE, Sanden SK, Hussain S, Filipiak WE, Saunders TL, Dysko RC, Kohno K, Holzman LB, Wiggins RC: Podocyte depletion causes glomerulosclerosis: Diphtheria toxin-induced podocyte depletion in rats expressing human diphtheria toxin receptor transgene. J Am Soc Nephrol 16: 2941–2952, 2005 [DOI] [PubMed] [Google Scholar]
- 7.Matsusaka T, Xin J, Niwa S, Kobayashi K, Akatsuka A, Hashizume H, Wang QC, Pastan I, Fogo AB, Ichikawa I: Genetic engineering of glomerular sclerosis in the mouse via control of onset and severity of podocyte-specific injury. J Am Soc Nephrol 16: 1013–1023, 2005 [DOI] [PubMed] [Google Scholar]
- 8.Pagtalunan ME, Miller PL, Jumping-Eagle S, Nelson RG, Myers BD, Rennke HG, Coplon NS, Sun L, Meyer TW: Podocyte loss and progressive glomerular injury in type II diabetes. J Clin Invest 99: 342–348, 1997 [DOI] [PMC free article] [PubMed] [Google Scholar]
- 9.Meyer TW, Bennett PH, Nelson RG: Podocyte number predicts long-term urinary albumin excretion in Pima Indians with type II diabetes and microalbuminuria. Diabetologia 42: 1341–1344, 1999 [DOI] [PubMed] [Google Scholar]
- 10.Steffes MW, Schmidt D, McCrery R, Basgen JM, International Diabetic Nephropathy Study Group: Glomerular cell number in normal subjects and in type I diabetic patients. Kidney Int 59: 2104–2113, 2001 [DOI] [PubMed] [Google Scholar]
- 11.White KE, Bilous RW, Marshall SM, El Nahas M, Remuzzi G, Piras G, De Cosmo S, Viberti G, European Study for the Prevention of Renal Disease in Type I diabetes (ESPRIT): Podocyte number in normotensive type I diabetic patients with albuminuria. Diabetes 51: 3083–3089, 2002 [DOI] [PubMed] [Google Scholar]
- 12.Dalla Vestra M, Masiero A, Roiter A, Saller A, Crepaldi G, Fioretto P: Is podocyte injury relevant in diabetic nephropathy? Studies in patients with type 2 diabetes. Diabetes 52: 1031–1035, 2003 [DOI] [PubMed] [Google Scholar]
- 13.Lemley KV, Lafayette RA, Safai M, Derby G, Blouch K, Squarer A, Myers BD: Podocytopenia and disease severity in IgA nephropathy. Kidney Int 61: 1475–1485, 2002 [DOI] [PubMed] [Google Scholar]
- 14.Hara M, Yanagihara T, Itoh M, Matsuno M, Kihara I: Immunohistochemical and urinary markers of podocyte injury. Pediatr Nephrol 12: 43–48, 1998 [DOI] [PubMed] [Google Scholar]
- 15.Hara M, Yanagihara T, Takada T, Itoh M, Matsuno M, Yamamoto T, Kihara I: Urinary excretion of podocytes reflects disease activity in children with glomerulonephritis. Am J Nephrol 18: 35–41, 1998 [DOI] [PubMed] [Google Scholar]
- 16.Nakamura T, Ushiyama C, Suzuki S, Hara M, Shimada N, Ebihara I, Koide H: Urinary excretion of podocytes in patients with diabetic nephropathy. Nephrol Dial Transplant 15: 1379–1383, 2000 [DOI] [PubMed] [Google Scholar]
- 17.Hara M, Yanagihara T, Kihara I: Urinary podocytes in primary focal segmental glomerulosclerosis. Nephron 89: 342–347, 2001 [DOI] [PubMed] [Google Scholar]
- 18.Hara M, Yanagihara T, Kihara I, Higashi K, Fujimoto K, Kajita T: Apical cell membranes are shed into urine from injured podocytes: A novel phenomenon of podocyte injury. J Am Soc Nephrol 16: 408–416, 2005 [DOI] [PubMed] [Google Scholar]
- 19.Hara M, Yanagihara T, Kihara I: Cumulative excretion of urinary podocytes reflects disease progression in IgA nephropathy and Schönlein-Henoch purpura nephritis. Clin J Am Soc Nephrol 2: 231–238, 2007 [DOI] [PubMed] [Google Scholar]
- 20.Patari A, Forsblom C, Havana M, Taipale H, Groop PH, Holthofer H: Nephrinuria in diabetic nephropathy of type 1 diabetes. Diabetes 52: 2969–2974, 2003 [DOI] [PubMed] [Google Scholar]
- 21.Vogelmann SU, Nelson WJ, Myers BD, Lemley KV: Urinary excretion of viable podocytes in health and renal disease. Am J Physiol Renal Physiol 285: F40–F48, 2003 [DOI] [PMC free article] [PubMed] [Google Scholar]
- 22.Petermann AT, Pippin J, Krofft R, Blonski M, Griffin S, Durvasula R, Shankland SJ: Viable podocytes detach in experimental diabetic nephropathy: Potential mechanism underlying glomerulosclerosis. Nephron Exp Nephrol 98: e114–e123, 2004 [DOI] [PubMed] [Google Scholar]
- 23.Garovic VD, Wagner SJ, Turner ST, Rosenthal DW, Watson WJ, Brost BC, Rose CH, Gavrilova L, Craigo P, Bailey KR, Achenbach J, Schiffer M, Grande JP: Urinary podocyte excretion as a marker for preeclampsia. Am J Obstet Gynecol 196: 320.e1–320.e7, 2007 [DOI] [PubMed] [Google Scholar]
- 24.Szeto CC, Lai KB, Chow KM, Szeto CY, Yip TW, Woo KS, Li PK, Lai FM: Messenger RNA expression of glomerular podocyte markers in the urinary sediment of acquired proteinuric diseases. Clin Chim Acta 361: 182–190, 2005 [DOI] [PubMed] [Google Scholar]
- 25.Wang G, Lai FM, Tam LS, Li KM, Lai KB, Chow KM, Li KT, Szeto CC: Messenger RNA expression of podocyte-associated molecules in urinary sediment of patients with lupus nephritis. J Rheumatol 34: 2358–2364, 2007 [PubMed] [Google Scholar]
- 26.Wang G, Lai FM, Lai KB, Chow KM, Kwan BC, Li PK, Szeto CC: Urinary messenger RNA expression of podocyte-associated molecules in patients with diabetic nephropathy treated by angiotensin-converting enzyme inhibitor and angiotensin receptor blocker. Eur J Endocrinol 158: 317–322, 2008 [DOI] [PubMed] [Google Scholar]
- 27.Yu D, Petermann A, Kunter U, Rong S, Shankland SJ, Floege J: Urinary podocyte loss is a more specific marker of ongoing glomerular damage than proteinuria. J Am Soc Nephrol 16: 1733–1741, 2005 [DOI] [PubMed] [Google Scholar]
- 28.Brenner BM, Lawler EV, Mackenzie HS: The hyperfiltration theory: A paradigm shift in nephrology. Kidney Int 49: 1774–1777, 1996 [DOI] [PubMed] [Google Scholar]
- 29.Ichikawa I, Ma J, Motojima M, Matsusaka T: Podocyte damage damages podocytes: Autonomous vicious cycle that drives local spread of glomerular sclerosis. Curr Opin Nephrol Hypertens 14: 205–210, 2005 [DOI] [PubMed] [Google Scholar]
- 30.Wiggins RC, Glatfelter A, Kshirsagar B, Beals T: Lipid microvesicles and their association with procoagulant activity in urine and glomeruli of rabbits with nephrotoxic nephritis. Lab Invest 56: 264–272, 1987 [PubMed] [Google Scholar]
- 31.Garovic VD, Wagner SJ, Petrovic LM, Gray CE, Hall P, Sugimoto H, Kalluri R, Grande JP: Glomerular expression of nephrin and synaptopodin, but not podocin, is decreased in kidney sections from women with preeclampsia. Nephrol Dial Transplant 22: 1136–1143, 2007 [DOI] [PubMed] [Google Scholar]
- 32.Wiggins RC, Glatfelter A: Brukman J: Procoagulant activity in normal human urine is associated with subcellular particles. Kidney Int 29: 591–597, 1986 [DOI] [PubMed] [Google Scholar]
- 33.Pisitkun T, Shen RF, Knepper MA: Identification and proteomic profiling of exosomes in human urine. Proc Natl Acad Sci U S A 101: 13368–13373, 2004 [DOI] [PMC free article] [PubMed] [Google Scholar]
- 34.Zhou H, Yuen PS, Pisitkun T, Gonzales PA, Yasuda H, Dear JW, Gross P, Knepper MA, Star RA: Collection, storage, preservation, and normalization of human urinary exosomes for biomarker discovery. Kidney Int 69: 1471–1476, 2006 [DOI] [PMC free article] [PubMed] [Google Scholar]
- 35.Hunter MP, Ismail N, Zhang X, Aguda BD, Lee EJ, Yu L, Xiao T, Schafer J, Lee ML, Schmittgen TD, Nana-Sinkam SP, Jarjoura D, Marsh CB. Detection of microRNA expression in human peripheral blood microvesicles. PLoS ONE 3: e3694, 2008 [DOI] [PMC free article] [PubMed] [Google Scholar]
- 36.Skog J, Würdinger T, van Rijn S, Meijer DH, Gainche L, Curry WT Jr, Carter BS, Krichevsky AM, Breakefield XO: Glioblastoma microvesicles transport RNA and proteins that promote tumour growth and provide diagnostic biomarkers. Nat Cell Biol 10: 1470–1476, 2008 [DOI] [PMC free article] [PubMed] [Google Scholar]
- 37.Sanden SK, Wiggins JE, Goyal M, Riggs LK, Wiggins RC: Evaluation of a thick and thin section method for estimation of podocyte number, glomerular volume, and glomerular volume per podocyte in rat kidney with Wilms’ tumor-1 protein used as a podocyte nuclear marker. J Am Soc Nephrol 14: 2484–2493, 2003 [DOI] [PubMed] [Google Scholar]
- 38.Kershaw DB, Beck SG, Wharram BL, Wiggins JE, Goyal M, Thomas PE, Wiggins RC: Molecular cloning and characterization of human podocalyxin-like protein: Orthologous relationship to rabbit PCLP1 and rat podocalyxin. J Biol Chem 272: 15708–15714, 1997 [DOI] [PubMed] [Google Scholar]
- 39.Boubred F, Buffat C, Feuerstein J-M, Daniel L, Tsimaratos M, Oliver C, Lelievre-Pegorier M, Simeoni U: Effects of early postnatal hypernutrition on nephron number and long term renal function and structure in rats. Am J Physiol Renal Physiol 293: F1944–F1949, 2007 [DOI] [PubMed] [Google Scholar]
- 40.Zambricki EA, D'Alecy LG: Rat sex differences in anesthesia. Comp Med 54: 49–53, 2004 [PubMed] [Google Scholar]


