Abstract
The human cognitive map is known to be hierarchically organized consisting of a set of perceptually clustered landmarks. Patient studies have demonstrated that these cognitive maps are maintained by the hippocampus, while the neural dynamics are still poorly understood. The authors have shown that the neural dynamic “theta phase precession” observed in the rodent hippocampus may be capable of forming hierarchical cognitive maps in humans. In the model, a visual input sequence consisting of object and scene features in the central and peripheral visual fields, respectively, results in the formation of a hierarchical cognitive map for object–place associations. Surprisingly, it is possible for such a complex memory structure to be formed in a few seconds. In this paper, we evaluate the memory retrieval of object–place associations in the hierarchical network formed by theta phase precession. The results show that multiple object–place associations can be retrieved with the initial cue of a scene input. Importantly, according to the wide-to-narrow unidirectional connections among scene units, the spatial area for object–place retrieval can be controlled by the spatial area of the initial cue input. These results indicate that the hierarchical cognitive maps have computational advantages on a spatial-area selective retrieval of multiple object–place associations. Theta phase precession dynamics is suggested as a fundamental neural mechanism of the human cognitive map.
Keywords: Synaptic plasticity, Model, Hippocampus, Episodic memory, Synchronization
Introduction
The cognitive map is a memory of environmental representation. Toleman (1948) originally demonstrated the existence of the cognitive map in rodents by using behavioral experiments. In line with the evidence, O’Keefe and Dostrovsky (1971) found the “place cells” in the hippocampus where the cells are selectively activated to a specific portion of the environment and further pointed out that the population of place cells would represent the cognitive map (O’Keefe and Nadel 1978). According to this cognitive map theory (O’Keefe and Nadel 1978), the rodent hippocampus has been extensively evaluated and shown to include head cells (Taube et al. 1990) and grid cells (Hafting et al. 2005) in relation to theory. Hippocampal lesion studies further demonstrated that the hippocampus plays a critical role on the spatial navigation. These evidences demonstrated that the hippocampus represents the cognitive map of the environment, as proposed as the cognitive map theory (O’Keefe and Nadel 1978).
Among rodent hippocampal neural dynamics, a specific neural dynamics “theta phase precession” is considered to play a fundamental role in the formation of the cognitive map. Theta phase precession was discovered by O’Keefe and Recce (1993) where the phase of the place cell firing to the local field potential (LFP) theta gradually increases as the rat pass through the place field. Importantly, the firing phase was considered to convey the exact place information in addition to the traditional firing rate coding. Skaggs et al. (1996) further showed that place cells show individual phase precession patterns and pointed out that the phase precession could be considered to be a “temporal compression” of the behavioral input sequence. Since the time scale of the phase difference of two place cell firings in neighboring place fields agrees with a time window of spike time dependent plasticity (STDP) (Bi and Poo 1998), the phase precession is expected to contribute the synaptic plasticity in the hippocampus. The computational experiments further demonstrated that theta phase precession could contribute to the formation of the temporal sequence memory (Jensen and Lisman 1996; Levy 1996; Yamaguchi 2003; Sato and Yamaguchi 2003), spatio-temporal pattern memory (Wu and Yamaguchi 2004) and also the cognitive map (Burgess et al. 1994; Wagatsuma and Yamaguchi 2004, 2007).
Like the rodent hippocampus, the human hippocampus has also shown to associate with the cognitive map by using functional imaging (Maguire et al. 1998), and has further shown to include place cells by using an intracranial recording (Ekstrom et al. 2003). Thus, the human hippocampus is considered to have the same neural dynamics with the rodent hippocampus. However, unlike the rodent cognitive map, the human cognitive map has been characterized by a hierarchical structure consisting of sub-grouping of the outside landmarks (Stevens and Coupe 1978) and small objects in the laboratory (McNamara et al. 1989). In relation to the memory of a complex environment, the patient studies have shown that the human hippocampus also maintains the memory of multiple object–place associations (Smith and Milner 1981; Stepankova et al. 2004). The human hippocampus is expected to maintain the cognitive map with a hierarchical structure for multiple object–place associations.
By using computational experiments, the authors have shown that the hierarchical cognitive map for multiple object–place associations can emerge through theta phase precession (Sato and Yamaguchi 2005). According to experimental evidence of primates where the hippocampus receives convergent information regarding objects and space (Mishkin et al. 1997) and shows selective activation with eye fixation location (Rolls 1999), the model assumes to receive a saccadic visual input sequence consisting of the object and scene information respectively in the central and peripheral visual fields. Then the input sequence is translated to a phase precession pattern at the entorhinal cortex and stored into CA3 synaptic weights according to STDP (Fig. 1). It was shown that the difference in temporal evolution between object and scene inputs result in scene–object unidirectional connections leading to a hierarchical cognitive map for object–place associations. Importantly, such a complex information structure can emerge in only a few seconds. However, it remains unclear whether the structure creates advantage in the retrieval of memories.
Fig. 1.
A computational scenario of the formation of the hierarchical cognitive map for object–place associations (Sato and Yamaguchi 2005). Random saccade produces a visual input sequence consisting of the object and scene information respectively in the central and peripheral visual fields. The sequence is translated to theta phase precession at the entorhinal cortex, transmitted to the CA3 and stored into directional connections according to STDP. The difference of temporal evolution between object and scene inputs results in a formation of the hierarchical structure of multiple object–place associations
In this paper, we evaluate memory retrieval in the hierarchical cognitive map for object–place associations formed by theta phase precession. The results will help to prediction to the results of experiments with humans.
Methods
The computational model of object–place memory
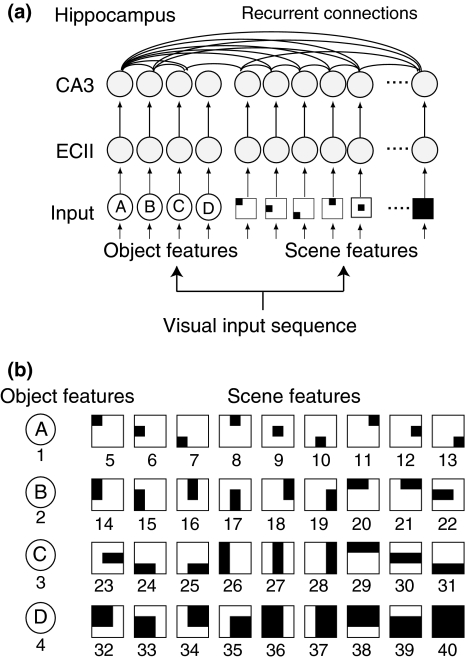
The computational model of object–place memory based on theta phase coding (Sato and Yamaguchi 2005) consists of the visual system and the hippocampal system (Fig. 2a). The visual system produces a visual input sequence with random saccades, where the visual inputs are given by object features in the central visual field as well as scene features in the peripheral visual field. The hippocampal system consists of the ECII layer and the CA3 layer. The ECII layer produces phase precession pattern from the input sequence and the CA3 layer stores the pattern in the recurrent connection weights according to STDP. All model parameters were identical to those of the previous study (Sato and Yamaguchi 2005) except for the object and scene features in the visual system.
Fig. 2.
A computational model for the object–place memory. a Basic construction of the model. The model consists of the input layer including the object and scene units, the ECII layer and the CA3 layer. These three layers are connected in an one-to-one manner. Units in the ECII and CA3 layers are described by phase oscillators. b Four object features and 36 scene features of input unit. Object unit are activated during the fixation of the corresponding object. Scene features are shown by their receptive field in a 3-by-3 grid. When the fixation point enters the receptive field, the corresponding scene inputs are activated
Visual environment and input features
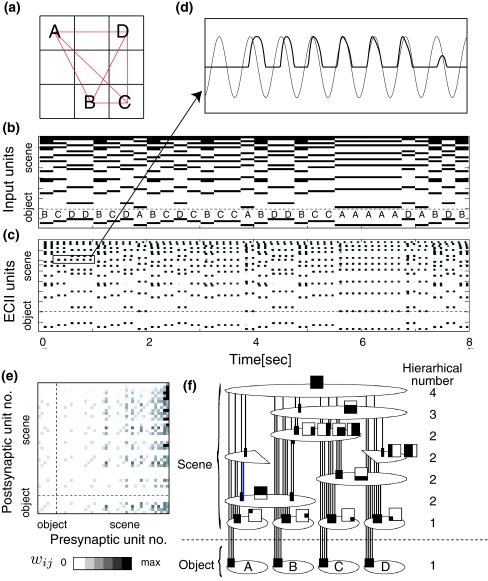
Analogously to the human experiment of object–place memory (Sato and Yamaguchi 2007), the visual environment includes four objects located in a 3-by-3 grid array. This two-dimensional environment is an expansion of the one-dimensional environment used in the previous study (Sato and Yamaguchi 2005). The input layer consists of four object features and 36 scene features, each having multi-scaled receptive fields in the grid (Fig. 2b). The “object” feature, that was originally given by color information at the center of the visual field, is modified to be defined by symbol (A, B, C or D) as a model of specific feature of individual object. The “scene” input feature that was originally defined by the low spatial component of gray-scaled luminance pattern in the peripheral visual field, is simplified to be given by the receptive fields consisting of multiple grids as a model of non-specific feature of the space. According to the eye fixation location in the grid, (x,y), the output of ith unit, Ii(x,y), is given by a binary value (0 or 1). For example, in the case of fixation at a left-upper grid square in Fig. 3a, the input units of object feature 1 and scene features 5, 14, 20, 26, 29, 32, 36, 48 and 40 are activated (indicated by 1) and the rest of the units remain at rest (indicated by 0).
Fig. 3.
Memory encoding. a Visual environment. Eye movement is shown in red lines. b, c Temporal evolution of the input unit and ECII units. d The temporal evolution of an ECII unit and LFP theta. The phase of the ECII unit activation gradually increases. e Resultant CA3 connection matrix after one-trial encoding. f An equivalent graph of the resultant connection matrix. The circle indicates a population of units received the same input sequence. The arrows with square arrowhead indicate directional connections
The ECII layer
The dynamics of the ECII and CA3 layer units are described by the “phase model”, where a single variable of the oscillation phase ϕ(t) (mod 2π) describes either neural oscillation or excitation (Hoppensteadt 1986; Yamaguchi 1996). Output of ith unit with phase ϕi, pi, is given by
 |
1 |
ith ECII unit oscillation is activated by input, Ii, and phase coding is generated by phase locking with the theta rhythm of the local field potential, cos(ω0t). It is assumed that the native frequency, ωi, gradually increases with the activation of the input, Ii (Yamaguchi 2003). The dynamics of the phase of ith unit, ϕECIIi, is given by,
 |
2 |
with
 |
3 |
where w0 is an angular frequency of the theta oscillation with a cycle period T0 = 2π/w0. It is known that the resultant phase of the unit activation is proportional to its native frequency, thus the increase of the native frequency given by Eq. 2 results in the gradual phase advance of the unit activation. Phase precession is realized in the output pECIIi = P(ϕECIIi).
The CA3 layer
The ith CA3 unit receives a single excitatory input from ith ECII unit. The dynamics of the phase of ith unit, ϕECA3i, are given by,
 |
4 |
where CCA3rec and CCA3inh denote coefficients of recurrent connections and the global inhibition, respectively.
During memory encoding, the connection weights from jth to ith units, wij, are formed according to STDP that is described by a delta function. The time evolution of wij is given by,
 |
5 |
where τw and Tw are the time constants of wij and the time window of STDP, respectively.
Computer experiments
The computer experiment includes two stages, the memory encoding stage and the recall stage. The equations explained above are numerically calculated using the Runge–Kutta–Gill method. The model parameters are identical to those of the previous study (Sato and Yamaguchi 2005).
Encoding stage
During the encoding stage, the input sequence with random saccades is encoded in as a one time experience and stored in the CA3 network. The dynamics of the CA3 layer are assumed to be dominated by the dynamics of the ECII layer as pCA3i = pECIIi. Then the model can be determined by six parameters (CECIIexc = 3, CECIItheta = 1, CECII0 = 3, τw = 0.1T0, Tw = 100 T0, Cr = 0.5). The initial state of the connection weights, wij(0), is given by a small value (10−6).
Retrieval stage
During the retrieval stage, an input of the initial cue is given to the CA3 network (100 ms) and the following activation propagation through the resultant connection weights is defined as retrieval pattern. The dynamics of the ECII layer is assumed to be dominated by the input layer, as pECII3i = Ii, and the connection weights are assumed to be fixed  This model can be determined by four parameters (CCA3exc = 1.5, CCA3rec = 3, CCA3inh = 0.1, CCA30 = 1.5).
Decoding of the retrieved pattern
The retrieved pattern is decoded according to the definition of visual features. An object sequence, O(t), is decoded by pCA3i(t) |i=1,…,4 and a scene sequence, S(t), is decoded by pCA3i(t) |i=5,…,40, as given by
 |
6 |
and
 |
7 |
with
 |
where G(x, y, t) indicates sum activation at (X ,Y) given by CA3 activation {pCA3j (t)}. The location of object feature k is given by
 |
8 |
where mode(X) is most frequent value in a function X(t).
Results
Formation of the hierarchical network
Figure 3 shows the temporal evolution of the hierarchical network for object–place associations. Figure 3a and b show a visual environment and a corresponding input sequence where the saccades eye movement randomly catches one of four object at the center of the visual fields. At each time, the object and scene input are determined by the symbol of object (A, B, C or D) at the fixation point and the receptive field of combination of grids, respectively (see Fig. 2b). In the sequence, the object input is found to change frequently at every saccade, while the scene input is found to be able to show a continuous activation along several saccades. In the ECII layer, the input sequence is translated to a phase precession pattern as shown in Fig. 3c, where each unit is activated by receiving the excitatory input and produces an oscillatory activation in which phase gradually increases with time (Fig. 3d). The phase precession pattern is transmitted to the CA3 layer and stored in connection weights according to STDP. Figure 3e shows a resultant CA3 connection weight matrix where the unidirectional connections from scene to object units are shown as the asymmetry along the diagonal line.
To show the information structure of the connection matrix, an equivalent graph is plotted as shown in Fig. 3f. Each circle indicates a population of CA3 units all of which received the same input sequence in a given visual environment. The four columns indicate the activation of the population units during fixating of object A, B, C and D, respectively. For example, the population units in the second circle from the top are activated during fixating objects B, C and D, but are not activated during fixating object A. The vertical location is associated with “the hierarchical number” that is defined by the number of objects that could activate the population units. The arrows with square arrowheads indicate the unidirectional connections. By using this graph, it is clearly demonstrated that the unidirectional connections mostly appear from upper to lower population units: Scene units are unidirectionally connected to object units and the sub populations of scene units form a hierarchical organization among them. Importantly, a complex information structure is formed in several seconds. The current result demonstrates that the hierarchical structure also appears in a two dimensional visual environment in addition to a one dimensional visual environment (Sato and Yamaguchi 2005).
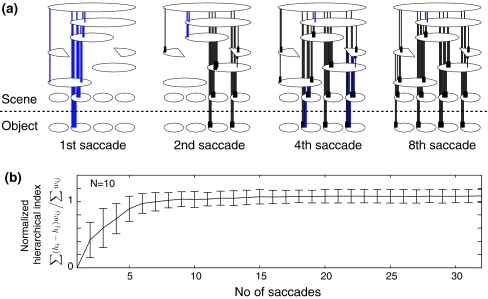
To address questions regarding the time course of the formation of the hierarchical structure, Fig. 4a shows a temporal evolution of the hierarchical structure. At the second saccade, part of the hierarchical structure begins to form and at the 8th saccade and the whole of the structure seems to be completed. This result demonstrates that the formation of the hierarchical structure can be formed in a very short period of time. In order to evaluate the structure quantitatively, a normalized hierarchical index is defined by,
 |
9 |
where hi denotes the hierarchical number of ith unit, and used to show temporal evolution. Figure 4b shows a 10-trials average of the normalized hierarchical indices, where the object arrangement and saccade sequences are randomly generated. In each trial, the hierarchical structure is found to be completed in 10 saccades. The quick formation of the hierarchical network is considered to be a robust property of the object–place memory encoded by theta phase precession.
Fig. 4.
Temporal evolution of the hierarchical network. a The hierarchical structures at the first, second, 4-th and 8-th saccade of which the interval is 250 ms. b 10-trial average of the normalized hierarchical indices. The hierarchical structure is formed in 10 saccades
Memory retrieval in the hierarchical network
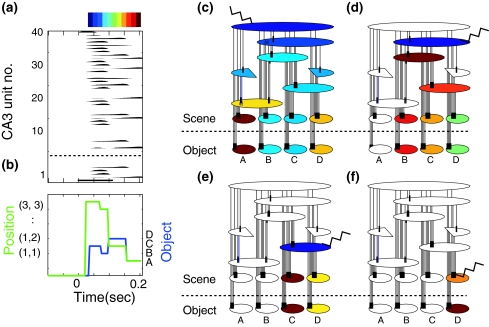
The hierarchical network is evaluated using memory retrieval. Figure 5a shows a retrieved pattern evoked in the CA3 layer with the initial activation of the top unit (covering A, B, C and D). The activity propagation automatically appears in relation to the recurrent connections. Figure 5b shows the decoded object and scene sequences where the synchronous changes are observed between the object and scene decoded sequences. To visualize the activity propagation in the equivalent graph, the time of peak activation of each population unit is colored by a continuos hue color. Figure 5c shows that the activation propagation first appears along column, after which the remaining hierarchical structure is sequentially activated. These results demonstrate that initial unit activation at the top hierarchy results in the retrieval of multiple object–place associations where individual associations are represented one by one.
Fig. 5.
Memory retrieval. a The CA3 unit activations initiated by the unit at the top hierarchy. b Decoded object and scene sequences and object–place associations. c Activity propagation in the hierarchical network initiated by the unit at the top hierarchy. Time of peak activation of the population unit is colored by a hue color from blue to red with respect to time. Jagged line indicates the initial activation. d–g Activity propagation initiated by the initial activation of various hierarchical depth. The coefficient of the recurrent connection, CCA3rec, is changed to 10 for retrieval by 2nd and 3rd hierarchical depth activation and 15 for retrieval by 1st hierarchical depth activation
To investigate which retrievals are produced by the initial input given to the middle of the hierarchical depth we tested the influence of the hierarchical depth of the initial cue on the retrieval (Fig. 5d–f). When the scene unit covering object B, C and D (of which the hierarchical number is 3) is activated, the retrieval pattern includes 3 object–place associations (relating with objects B, C, D). Similarly, the activation of scene units covering C and D (of which hierarchical number is 2) results in a retrieval of 2 object–place associations (relating with objects C and D). This indicates that the hierarchical network can produce a selective retrieval according to the spatial area of the initial cue of the scene feature. This is a important property of the hippocampal memory system that manages a huge amount of memory. Even if the exact object–place association is forgotten, initial input representing abstract information can evoke the corresponded multiple object–place associations in a sequence.
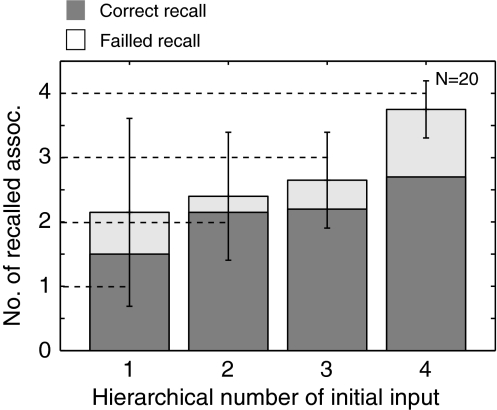
In order to show the robustness of the selective retrieval, the relationship between the recalled number of the object–place associations and the hierarchical number of the initial cue is further evaluated by using a number of encoding–retrieval experiments where the object arrangement and the saccade sequence are randomly determined. Figure 6 shows the relationship between the hierarchical number of the initial cue and the number of retrieved associations (N = 20). The result again shows that the number of retrieved associations are a function of the hierarchical number of the initial cure. The selective retrieval is considered as a robust property of the hierarchical network.
Fig. 6.
Relationship between the number of recalled associations and the hierarchical depth of the initial activation
Discussion
We evaluated the hierarchical cognitive map for object–place associations formed by theta phase precession and STDP. It was demonstrated that the hierarchical structure of the network formed in a few seconds (section “Formation of the hierarchical network”) and the network can produce a spatial-area selective retrieval under the control of the initial cue input (section “Memory retrieval in the hierarchical network”). These advantages of the hierarchical network support the computational theory of theta phase coding in humans. In the following section, we will discuss the robustness of the hierarchical network and the predictions for human experiments.
Mathematical evaluation of the hierarchical network
In the case of the traditional Hebb rule, the resultant connection weights can be expected by the statistical properties of the input sequence, while the connection weights formed by theta phase precession and STDP (Yamaguchi 2003) are difficult to predict without calculating a set of differential equations. In this section, we will discuss the mechanism for the selective retrieval using a simplified equation describing the hierarchical structure.
We have already shown that the connection weights formed by theta phase precession are mathematically described by the statistical properties of the input sequence (Sato and Yamaguchi 2008) (see Appendix for details). The connection weight between ith and jth CA3 units after encoding, Wij, is given by a combination of the raw and low-passed input sequences as follows,
 |
10 |
where PSij denotes the coactivation probability of the ith and jth input units during |ILPj − ILPi| <  θ, the PAij denotes coactivation probability of the ith and jth input units during ILPj − ILPi >
  θ, and Pi and Pj are the ith and jth input unit activation probabilities, respectively, and α and β are constants (α ≫ β). Thus the major factor leading the asymmetric connection is the difference between low-passed sequences of the ith and jth input units in the second term.
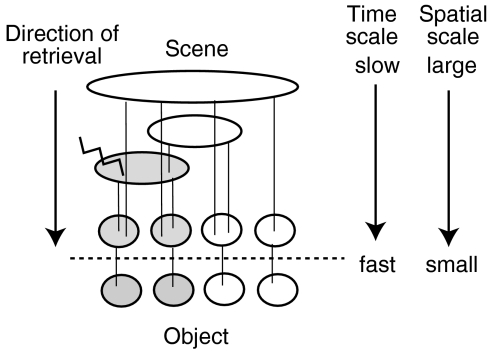
In order to characterize the hierarchal network, the most important factor is the “hierarchical number” of the input unit that is associated with the spatial size of receptive field of the unit (Fig. 7). The input unit of the larger hierarchical number shows the larger total activation  and also has the larger activation in the low-passed input sequence
  When ith input unit has a larger hierarchal number than those of jth input unit, PAij and PAji are always positive and zero, respectively. This is the mechanism which forms the unidirectional connections leading the hierarchical network for object–place associations.
Fig. 7.
The hierarchical network has ability of spatial-area selective retrieval of object–place associations
During the retrieval, the second term of the above equation, PAij, plays a dominant role. When the jth CA3 unit at the middle of the hierarchical depth is activated, the retrieval activation propagation only appears in the CA3 units of which input units have a lower hierarchical number and has simultaneous activation with the jth input unit. Thus, in the equivalent graph representation (Fig. 7), the activity propagation only appears down-stream of the hierarchical structure and is restricted to be within the area included by the initial cue. This retrieval property realizes the spatial-area selective memory retrieval of the object–place associations.
Predictions to the human experiment
The computational model for object–place memory has produced human experimental predictions regarding the neural dynamics during memory encoding. These predictions are successfully evaluated by using scalp electroencephalogram (EEG) (Sato and Yamaguchi 2007) and EEG–fMRI simultaneous measurements (Sato et al. 2008). The current study further develops the predictions regarding the memory retrieval of object–place associations.
First, the retrieval of object–place association is predicted to be easier with a scene cue than retrieval with an object cue. As demonstrated in section “Memory retrieval in the hierarchical network”, the hierarchical retrieval is one of important properties of the hierarchical network, thereby making this a direct evaluation of the computational model.
Second, the detection of multiple object–place associations in a specific area is predicted to be independent of the size of the area. As shown in Fig. 3a–c, in the hierarchical network, the multiple associations are simultaneously activated and the individual association is represented one-by-one with temporal coding. The time scale of the retrieval is almost independent to the hierarchical number of the initial cue input.
Finally, the above behavioral differences are also expected to be reflected in the scalp EEG power, as the EEG theta power during object–place encoding has shown to be correlated with subsequent memory performance (Sato and Yamaguchi 2007). Since larger interaction between the hippocampus and the cortex is expected under difficult retrieval condition, the scalp EEG power is expected to be larger under these circumstances. The above predictions are uniquely produced by the computational model of theta phase precession in humans. The evaluation of the predictions would show fundamental properties of the hierarchical cognitive maps.
Acknowledgments
This work was supported by Grant-in-Aid for Scientific Research (No. 20220003).
Appendix: Relationship between connection weights by theta phase coding and input sequence
The connection weights formed by theta phase precession (Yamaguchi 2003; Sato and Yamaguchi 2003) is elucidated in terms of the statistical property of the input sequence (Sato and Yamaguchi 2008). Theta phase precession is modeled by using a discrete time, td = nTθ, where n denotes is a count of theta cycles. The phase of the ith unit activation at the nth theta cycle, Θi(n), is known to be proportional to the native frequency, ωi. ωi given by Eq. 3 is proportional to a low-pass filtered input sequence, ILPi, of which the transfer function is given by  Thus, Θi is simply given by
 |
11 |
The connection weight between the ith and jth CA3 units, Wij(n), changes according to STDP. In Eq. 5, the increase in connection weight is given by a convolution between a delta function of STDP and half-waves of cosine-shape activation in Eq. 1. The increase of connection weights could be simplified as,
 |
12 |
where  θ denotes a threshold of the phase difference inducing asymmetric connection weights. Then the evolution of connection weights, Wij, is given by
 |
13 |
where β is a constant (≪1) associated with τa and Cw in Eq. 5.
The resultant connection weight after one trial of encoding (of which duration is T) is given by
 |
14 |
When τW ≫ 0, the above equation is transformed to be a function of the parameter of the input sequence, as follows.
 |
15 |
with
 |
where the PSij denotes the coactivation probability of the ith and jth units during |ILPj − ILPi| <  θ, the PAij denotes the coactivation probability of the ith and jth units during ILPj − ILPi >
  θ, and Pi and Pj are the ith and jth unit activation probabilities, respectively. The connection weight does not simply reflect the coactivation of ith and jth units, P(Ii = 1, Ij = 1), but that further depends on the slow component of input sequence represented by ILPj − ILPi. This is considered to be a major effect of theta phase precession on the synaptic plasticity.
References
- Bi GQ, Poo MM (1998) Synaptic modifications in cultured hippocampal neurons: dependence on spike timing, synaptic strength, and postsynaptic cell type. J Neurosci 18:10464–10472 [DOI] [PMC free article] [PubMed]
- Burgess N, Recce M, O’Keefe J (1994) A model of hippocampal function. Neural Netw 7:1065–1081 [DOI]
- Ekstrom AD, Kahana MJ, Caplan JB, Fields TA, Isham EA, Newman EL, Fried I (2003) Cellular networks underlying human spatial navigation. Nature 425:184–187 [DOI] [PubMed]
- Hafting T, Fyhn M, Molden S, Moser MB, Moser EI (2005) Microstructure of a spatial map in the entorhinal cortex. Nature 436:801–806 [DOI] [PubMed]
- Hoppensteadt FC (1986) An introduction to the mathematics of neurons. Cambridge University Press, Cambridge
- Jensen O, Lisman JE (1996) Hippocampal CA3 region predicts memory sequences: accounting for the phase precession of place cells. Learn Mem 3:279–287 [DOI] [PubMed]
- Levy WB (1996) A sequence predicting CA3 is a flexible associator that learns and uses context to solve hippocampal-like tasks. Hippocampus 6(6):579–590 [DOI] [PubMed]
- Maguire EA, Burgess N, Donnett JG, Frackowiak RSJ, Frith CD, O’Keefe J (1998) Knowing where and getting there: a human navigation network. Nature 280:921–924 [DOI] [PubMed]
- McNamara TP, Hardy JK, Hirtle SC (1989). Subjective hierarchies in spatial memory. J Exp Psychol Learn Mem Cogn 15(2):211–227 [DOI] [PubMed]
- Mishkin M, Suzuki WA, Gadian DG, Vargha-Khadem F (1997) Hierarchical organization of cognitive memory. Philos Trans R Soc Lond B Biol Sci 352:1461–1467 [DOI] [PMC free article] [PubMed]
- O’Keefe J, Dostrovsky J (1971) The hippocampus as a spatial map: preliminary evidence from unit activity in the freely moving rat. Brain Res 34:171–175 [DOI] [PubMed]
- O’Keefe J, Nadel L (1978) The hippocampus as a cognitive map. Clarendon Press, Oxford
- O’Keefe J, Recce ML (1993) Phase relationship between hippocampal place units and the EEG theta rhythm. Hippocampus 3:317–330 [DOI] [PubMed]
- Rolls ET (1999) Spatial view cells and the representation of place in the primate hippocampus. Hippocampus 9:467–480 [DOI] [PubMed]
- Sato N, Yamaguchi Y (2003) Memory encoding by theta phase precession in the hippocampal network. Neural Comput 15(10):2379–2397 [DOI] [PubMed]
- Sato N, Yamaguchi Y (2005) On-line formation of a hierarchical cognitive map for object-place association by theta phase coding. Hippocampus 15:963–978 [DOI] [PubMed]
- Sato N, Yamaguchi Y (2007) Theta synchronization networks emerge during human object-place memory encoding. Neuroreport 18(5):419–424 [DOI] [PubMed]
- Sato N, Yamaguchi Y (2008) Relationship between an input sequence and asymmetric connections formed by theta phase precession and STDP. Paper presented at the 15th international conference on neural information processing of the Asia-Pacific Neural Network Assembly (ICONIP2008), Auckland, New Zealand, November 2008
- Sato N, Ozaki T, Someya Y, Anami K, Ogawa S, Mizuhara H, Yamaguchi Y (2008) A cortico-hippocampal network emerging with subsequent memory dependent theta oscillation. In: Human brain mapping 2008, Melbourne, Australia, June 2008
- Skaggs WE, McNaughton BL, Wilson MA, Barnes CA (1996) Theta phase precession in hippocampal neuronal populations and the compression of temporal sequences. Hippocampus 6:149–172 [DOI] [PubMed]
- Smith ML, Milner B (1981) The role of the right hippocampus in the recall of spatial location. Neuropsychologia 19:781–793 [DOI] [PubMed]
- Stepankova K, Fenton AA, Pastalkova E, Kalina M, Bohbot VD (2004) Object-location impairment in patient with thermal lesions to the right or left hippocampus. Neuropsychologia 42:1017–1028 [DOI] [PubMed]
- Stevens A, Coupe P (1978) Distortion in judged spatial relations. Cogn Psychol 10:422–437 [DOI] [PubMed]
- Taube JS, Muller RU, Ranck JB Jr. (1990) Head direction cells recorded from the postsubiculum in freely moving rats. I. Description and quantitative analysis. J Neurosci 10:420–435 [DOI] [PMC free article] [PubMed]
- Tolman EC (1948) Cognitive maps in rats and men. Psychol Rev 40:60–70 [DOI] [PubMed]
- Wagatsuma H, Yamaguchi Y (2004) Cognitive map formation through sequence encoding by theta phase precession. Neural Comput 16(12):2665–2697 [DOI] [PubMed]
- Wagatsuma H, Yamaguchi Y (2007) Neural dynamics of the cognitive map in the hippocampus. Cogn Neurodyn 1:119–141 [DOI] [PMC free article] [PubMed]
- Wu Z, Yamaguchi Y (2004) Input-dependent learning rule for the memory of spatiotemporal sequences in hippocampal network with theta phase precession. Biol Cybern 90(2):113–124 [DOI] [PubMed]
- Yamaguchi Y (1996) Synchronization of theta activities as a supervisory mechanism of the memory formation in a neural network model of the hippocampus. In: Kato N (ed) Functions and clinical relevance of the hippocampus. Elsevier, Amsterdam
- Yamaguchi Y (2003) A theory of hippocampal memory based on theta phase precession. Biol Cybern 89:1–9 [DOI] [PubMed]


