

Abstract
Abnormalities in glutamate neurotransmission are thought to be among the major contributing factors to the pathophysiology of schizophrenia. Although schizophrenia has been regarded mostly as a disorder of higher cortical function, the cortex and thalamus work as a functional unit. Existing data regarding alterations of glutamate receptor subunit expression in the thalamus in schizophrenia remain equivocal. This postmortem study examined mRNA expression of ionotropic glutamate receptor (iGluR) subunits and PSD95 in 5 precisely defined and dissected thalamic subdivisions (medial and lateral sectors of the mediodorsal nucleus; and the ventrolateral posterior, ventral posterior, and centromedian nuclei) of persons with schizophrenia and matched controls using quantitative PCR with normalization to multiple endogenous controls. Among 15 genes examined (NR1 and NR2A-D subunits of NMDA receptor; GluR1-4 subunits of AMPA receptor; GluR5-7 and KA1-2 subunits of kainate receptor; PSD95), all but two (GluR4 and KA1) were expressed at quantifiable levels. Differences in iGluR gene expression were seen between different nuclei but not between diagnostic groups. The relative abundance of transcripts was: NR1≫NR2A>NR2B>NR2D>NR2C for NMDA, GluR2>GluR1>GluR3 for AMPA, and KA2>GluR5>GluR7>GluR6 for kainate receptors. The expression of PSD95 correlated with the expression of NR1, NR2A, NR2B, NR2D and GluR6 in all nuclei. These results provide detailed and quantitative information on iGluR subunit expression in multiple nuclei of the human thalamus but suggest that alterations in their expression are not a prominent feature of schizophrenia.
Keywords: Quantitative real-time PCR, Gene Expression, Laser Capture Microdissection, Thalamus, Schizophrenia, Glutamate Receptors
1. INTRODUCTION
Evidence of glutamatergic abnormalities in schizophrenia (SZ) first emerged from pharmacological studies showing that antagonists of the N-methyl-D aspartate (NMDA) subtype of glutamate receptor (GluR), such as phencyclidine and ketamine, induce both positive and negative symptoms of SZ in normal subjects and exacerbate those symptoms in SZ patients (Javitt and Zukin, 1991; Krystal et al., 1994). Subsequent work using a variety of methodologies suggested abnormalities of glutamatergic function, especially in cortex (Goff and Coyle, 2001; Haroutunian et al., 2003; Harrison, 2004; Meador-Woodruff and Healy, 2000). Although SZ has been widely regarded as a disorder of higher cortical function, most information traveling to or from the cortex is relayed or synaptically gated through the thalamus (Jones, 1985). Moreover, reciprocal glutamatergic projections interconnect the thalamus and cortex in a highly organized topographic fashion such that the thalamus and cortex operate as a functional unit. Thus, an abnormality in the cortex would be expected to influence thalamic function and vice versa. Indeed, a variety of SZ-associated abnormalities, including those of glutamatergic function, have been described in interconnected regions of thalamus and cortex (e.g., mediodorsal thalamic nucleus (MD) (Bruneau et al., 2005; Clinton et al., 2003; Clinton et al., 2006; Kemether et al., 2003; Pakkenberg, 1990)) and prefrontal cortex (PFC) (Dracheva et al., 2001; Dracheva et al., 2005; Selemon et al., 1995; Selemon et al., 1998); anterior thalamic nucleus (Bruneau et al., 2005; Byne et al., 2006; Young et al., 2000) and anterior cingulate cortex (Benes et al., 2001; Dracheva et al., 2006; Haznedar et al., 2004)).
The glutamatergic subcortical and cortical projections to the mammalian thalamus exert their actions through a variety of ionotropic and metabotropic receptors (Jones, 2002). In the present study we focused only on the ionotropic GluRs (iGluRs). iGluRs have been classified into three pharmacologically distinct groups: α-amino-3-hydroxy-5-methyl-4-isoxazole propionic acid (AMPA) receptors, kainate receptors, and NMDA receptors (Dingledine et al., 1999; Mayer, 2005). These receptors are assembled from homo- and hetero-tetromeric combinations of polypeptides. AMPA receptors are composed of combinations of four subunits, GluR1-4, that are encoded by four different genes, GRIA1-4. Kainate receptors are composed of various combinations of five subunits, GluR5-7 and KA1-2, encoded by genes GRIK1-5. NMDA receptors are composed of multiple NR1 subunits (encoded by gene GRIN1) in combination with at least one of four different NR2 subunits, NR2A-D, encoded by genes GRIN2A-D. As each of the constituent subunits confers distinct properties to the receptor assembly, many important functional attributes of the receptors are determined by the expression of the various subunits and isoforms (Hollmann and Heinemann, 1994). Functions influenced by subunit composition include Ca2+ permeability, kinetics, single-channel conductance, pharmacological properties, intracellular trafficking, or coupling to signal transduction pathways.
In the present study, we employed quantitative real time PCR (qPCR) to examine the expression levels of 15 genes that encode all of the above mentioned subunits of the NMDA, AMPA, and kainate receptors in subregions of the thalamus of persons with SZ and normal controls (NCs). The mRNA expression level of postsynaptic density 95 protein (PSD95), which is encoded by the DLG4 gene, was also measured because it plays an important role in the clustering, assembly, and anchoring of the NMDA receptor and in the assembly of its signal transduction complexes (Cattabeni et al., 1999; Christopherson et al., 1999; Ehlers, 1999; Kornau et al., 1995; Sheng and Pak, 1999). PSD95 is exclusively localized within postsynaptic densities of the NMDA receptor and mostly binds to NR2A and NR2B subunits of the NMDA receptor (Kennedy, 1997; Kornau et al., 1995). To avoid confusion, we will refer to the transcripts of all iGluR subunits and PSD95 using only the names of their respective proteins.
We examined 5 subdivisions within the thalamus at the rostrocaudal level of the centromedian nucleus (CM): MD which was subdivided into medial (MDm) and lateral (MDl) portions; ventral lateral posterior (VLp); ventral posterior (VP) which included both its medial (VPm) and lateral (VPl) subdivisions; and CM. Each of these nuclei is functionally distinct and has a unique pattern of efferent and afferent connections. With the exception of VP, all have been implicated in SZ (Byne et al., 2002; Danos et al., 2002; Kemether et al., 2003; Pakkenberg, 1990; Popken et al., 2000; Young et al., 2000). Because of its projections to the PFC, MD has been the most examined nucleus in relation to SZ (Byne et al., 2002; Kemether et al., 2003; Pakkenberg, 1990; Popken et al., 2000; Young et al., 2000) with several recent failures of replication (Cullen et al., 2003; Dorph-Petersen et al., 2004; Young et al., 2004). MDl corresponds closely to the parvocellular division of MD that projects to the dorsolateral PFC (DLPFC) and its neuroanatomic abnormality has been consistently reported in SZ (Andreasen, 2000; Buchsbaum et al., 1992; Gur et al., 2000; Selemon et al., 1998). MDm corresponds closely to the magnocellular division which projects to the medial prefrontal and medial temporal cortex (Goldman-Rakic and Porrino, 1985; Jones, 1985; Ray and Price, 1993). CM is a phylogenetically recent nucleus and is only found in primates ((Murray et al., 2007). It is part of the caudal intralaminar nuclei group which has striatal and widespread cortical projections (Steriade et al., 1997). Similar to its striatal target, CM volume expands with exposure to neuroleptics (Kemether et al., 2003). VLp is an integral part of both the cerebello-thalamocortical and the basal ganglia-thalamocortical circuit, both of which are believed to be involved in the pathophysiology of SZ (Danos et al., 2002). To our knowledge, VP which provides the major relay to somatosensory cortex (Rausell et al., 1992) has not been implicated in SZ.
Our primary aim was to accurately quantify the expression levels of iGluR subunits in precisely defined and dissected thalamic nuclei in the human brain and to determine whether quantitative differences exist in their expression between NCs and persons with SZ in any of the studied subdivisions. A secondary aim was to quantitatively examine differences in the subunit composition of the iGluRs across various thalamic nuclei.
2. RESULTS
Based on the slopes of the standard curves, the efficiencies of the qPCR assays ranged from 70% to 98% for different genes studied. To avoid erroneous interpretation of expression levels due to these differences (Schefe et al., 2006), they were taken into account by the RSCM method of qPCR analyses. With only two exceptions (GluR4, KA1) all target genes were expressed in adequate abundance to permit reliable quantitation using RSCM. No differences were seen between diagnosis groups for the expression level of any gene (Fig. 3A–C); however, significant differences in gene expression were observed across the thalamic nuclei (Figs. 2–4). In the following sections, all references to differences in the levels of expression of different transcripts, whether differences between transcripts or between thalamic nuclei, refer to differences that were statistically significant according to the criteria and Bonferroni corrections described above.
Figure 3.

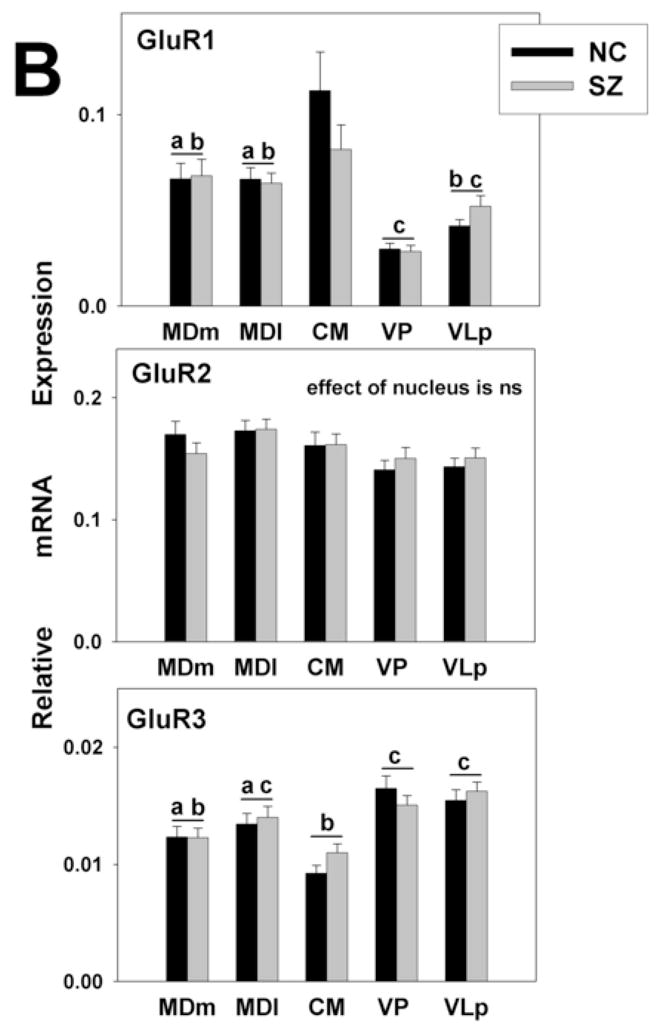

Gene expression analysis by thalamic nucleus and diagnosis. mRNA expression is shown for (A) NMDA (B) AMPA, and (C) kainate receptor subunits. The expression levels for all glutamate receptor subunits detected varied significantly across nuclei. There were no differences between the diagnoses. Histograms represent means and SEMs. For each gene, histograms that do not share the same symbol (a,b,or c) represent means that differ statistically (p<0.005) after Bonferroni correction. ns, not significant.
Figure 2.

Gene expression analysis by thalamic nucleus. mRNA expression levels of NMDA, AMPA, and kainate receptor subunits for the entire cohort are shown.
Figure 4.

Graphic summary of the relative levels of iGluR and PSD95 gene expression in the 5 thalamic nuclei studied. Displayed is the summary of results shown in Figures 2 and 3. RED indicates high expression, BLUE moderate expression, GREEN low expression
2.1. Gene expression levels
Large differences in expression levels of particular genes were observed within each thalamic nucleus (Fig 2). The most dramatic example was the level of the NR1 mRNA, which was at least 10 times higher than that for any other iGluR subunit in all nuclei. Among other NMDA receptor subunits, NR2A, NR2B and NR2D mRNAs were expressed at moderate level. While a previous study failed to detect NR2C message in forebrain (Akbarian et al., 1996), we found it to be expressed at low levels across all thalamic nuclei examined.
Among AMPA receptors, GluR2 was the predominant subunit in all nuclei followed by GluR1. Expression of GluR3 was very low, and GluR4 mRNA was not detected in any of the nuclei studied. Among kainate receptors, KA2 was moderately expressed in all nuclei. The expression levels of GluR5-7 were several times lower than that for KA2, and KA1 was not detected.
2.2. iGluR distribution in thalamic divisions
For all genes examined except GluR2 and NR2C, significant differences were seen in expression levels among thalamic nuclei in the absence of main effects of diagnosis or diagnosis by thalamic nucleus interactions (Fig. 3A, B, C). No genes were differentially expressed between the two divisions of the MD, an association relay nucleus, or between the two specific relay nuclei (e.g. VP and VLp). The expression of NR2A was higher in the specific relay nuclei than in the other nuclei examined. The levels of PSD95 and NR2D were higher in both divisions of the MD than other nuclei. The levels of NR1 and NR2B were lower and the expression of GluR1 was higher in CM, a diffuse projection nucleus, than in either the specific or association relay nuclei. GluR6 and KA2 were more highly expressed in the association relative to the specific relay nuclei. In addition to the precise depiction of iGluRs expression levels shown in Figs. 2 and 3, the expression patterns of the receptor subunits in the thalamic subdivisions are summarized as high, moderate or low in Fig. 4; relative abundances are presented as within nucleus (A) and between nucleus (B) comparisons.
2.3. Correlations between PSD95 and glutamate receptor subunits
No statistically significant correlations were seen in either the NC or the SZ group that were not also apparent in the full sample, nor did the slopes of the regression lines differ between diagnostic groups; therefore, only correlations for the full sample are tabulated (Table 3). PSD95 exhibited multiple correlations with all detected iGluR subunits except NR2C. The strongest correlations were with NMDA receptor subunits: PSD95 correlated with NR1, NR2B and NR2D in all nuclei, and with NR2A in all nuclei but VLp. In addition, PSD95 correlated with GluR6 in all nuclei examined.
Table 3. Correlations between PSD95 and other iGluR transcripts within each thalamic nucleus.
| MDm | MDl | CMN | VP | VLp | ||
|---|---|---|---|---|---|---|
| PSD95 | NR1 | r=0.7255 p=0.0000 |
r=0.7550 p=0.0000 |
r=0.9180 p=0.0000 |
r=0.8491 p=0.0000 |
r=0.7955 p=0.0000 |
| NR2A | r=0.6022 p=0.0009 |
r=0.7361 p=0.0000 |
r=0.7541 p=0.0000 |
r=0.7914 p=0.0000 |
ns | |
| NR2B | r=0.6110 p=0.0007 |
r=0.7297 p=0.0000 |
r=0.8935 p=0.0000 |
r=0.7537 p=0.0000 |
r=0.7676 p=0.0000 |
|
| NR2D | r=0.7501 p=0.0000 |
r=0.7466 p=0.0000 |
r=0.8570 p=0.0000 |
r=0.6105 p=0.0006 |
r=0.7449 p=0.0000 |
|
| GluR1 | ns | r=0.5928 p=0.0011 |
r=0.6516 p=0.0010 |
ns | ns | |
| GluR2 | r=0.6395 p=0.0003 |
ns | r=0.6326 p=0.0012 |
ns | ns | |
| GluR3 | r=0.5583 p=0.0025 |
ns | ns | r=0.5706 p=0.0012 |
ns | |
| GluR5 | ns | ns | r=0.8018 p=0.0000 |
ns | ns | |
| GluR6 | r=0.6422 p=0.0003 |
r=0.6813 p=0.0001 |
r=0.7607 p=0.0000 |
r=0.5364 p=0.0027 |
r=0.6753 p=0.0002 |
|
| GluR7 | r=0.5413 p=0.0035 |
r=0.5613 p=0.0023 |
ns | ns | r=0.6975 p=0.0001 |
|
| KA2 | r=0.6016 p=0.0009 |
ns | ns | ns | ns |
Only correlations significant after Bonferroni correction (p<0.004) are shown.
3. DISCUSSION
The major findings of this study were 1) an absence of between diagnostic group differences in the mRNA expression level of any iGluR in any thalamic nucleus; 2) the presence of between nucleus differences in iGluR gene expression levels; 3) the presence of potentially informative correlations between the expression levels of some of the examined genes.
3.1. Absence of SZ associated differences
Given the role of the cortex in SZ and the fact that cortex and thalamus act as a functional unit (Jones, 1985) with reciprocal glutamatergic connections, it is reasonable to hypothesize that glutamatergic mechanisms within the thalamus may be altered in SZ. In light of the mixed results or previous studies, however, the current negative results are perhaps not surprising. NR1 mRNA has been reported to be decreased or unchanged by two different studies (Clinton and Meador-Woodruff, 2004; Ibrahim et al., 2000), while its protein was reported to be unchanged in another study (Clinton et al., 2006); NR2B mRNA has been reported to be decreased by one study (Ibrahim et al., 2000) and increased by another (Clinton and Meador-Woodruff, 2004); while its protein was found increased in a separate study (Clinton et al., 2006); PSD95 mRNA was found to be increased (Clinton et al., 2003) or decreased (Clinton and Meador-Woodruff, 2004), and its protein was reported to be increased (Clinton et al., 2006). These discrepancies may reflect methodological differences across studies, including differences in the quantitative fidelity, precision of anatomic delineation of the thalamic nuclei, as well as differences in the characteristics of the cohorts studied. Cohort differences include age, antipsychotic medication exposure and disease severity. Compared with in situ hybridization, the qPCR method used in the present study has significant advantages in reliability of quantification (Bonnet et al., 1999; Bustin, 2000; Tyagi and Kramer, 1996). A recent study, that used a similar quantification (qPCR) and normalization (geometric mean of several endogenous controls) approach to assess AMPA receptor subunit and splice variant mRNA expression in the DLPFC, reported no differences between SZ patients and normal subjects in two different cohorts (O’Connor et al., 2007). Similarly to the thalamus, previous studies in the DLPFC that employed in situ hybridization or microarray analysis (Healy et al., 1998; Vawter et al., 2002) or qPCR with a normalization to a single endogenous control (Dracheva et al., 2005), produced discrepant results (e.g., decrease, increase, no change, respectively) in AMPA receptor expression in SZ, underscoring the importance of methodological approaches. Our use of triple gene normalization gives a conservative estimation of between group differences in gene expression, and is, therefore, likely to result in a lower rate of type I errors. Given the discrepancies in the literature, we reasoned that a conservative approach was warranted. While the negative results of the present study suggest that altered iGluR subunit mRNA expression in the thalamus is not a prominent feature of SZ pathology, that interpretation must be viewed cautiously in light of the previous positive findings. Moreover, it remains possible that SZ-associated differences exist in protein expression or post translational modifications of these iGluRs.
As in most postmortem studies of SZ, the majority of specimens in the present study came from subjects who had received antipsychotic medications for many years up until or close to the time of death. This is an important consideration because rodent and primate data suggest that neuroleptics alter iGluRs subunit expression in the brain (Healy and Meador-Woodruff, 1997; Meador-Woodruff et al., 1996; O’Connor et al., 2007; Spurney et al., 1999; Tascedda et al., 1999; Tascedda et al., 2001). In the present study, no correlations were seen between gene expression levels and the duration time off neuroleptics prior to death (range, 0–12 weeks) in persons with SZ. Nevertheless, to the extent that neuroleptics ameliorate symptoms, they may normalize gene expression. All SZ patients used in this study, however, exhibited a preponderance of negative symptoms that were not ameliorated by the antipsychotic medications received. This issue can only be resolved with confidence by studying neuroleptic naïve SZ patients.
3.2. Patterns of the glutamate receptor gene expression in the thalamus
Variation across genes (Fig 2 and Fig 4A)
Similar to observations in nonhuman primates (Jones et al., 1998), the expression of NR1 mRNA in all thalamic nuclei was significantly higher (more than 10 times) than the expression of other iGluRs genes. This is not surprising given that NR1 is an obligatory subunit of the NMDA receptor. In contrast, our finding that GluR2 is the most expressed subunit of AMPA receptors in all nuclei of the human thalamus examined differs from the very low levels of GluR2 detected in the monkey thalamus (Beneyto and Meador-Woodruff, 2004; Jones et al., 1998). The properties of AMPA receptors mostly depend on the presence of the GluR2 subunit, which determines the Ca2+ permeability of the receptor channels (Geiger et al., 1995; Hollmann et al., 1991; Jonas and Burnashev, 1995). AMPA receptors with GluR2 subunits display little calcium permeability, while receptors lacking this subunit are permeable to Ca2+. The presence of GluR2 also influences channel kinetics, conductance, AMPA receptor assembly, forward trafficking from the endoplasmic reticulum (ER) as well as targeting to and from synaptic sites (Lau and Zukin, 2007). Therefore, even a modest alteration in the level of expression of GluR2 can be expected to have profound implications for synaptic efficacy and neuronal survival. Our results imply that, similar to the cerebral cortex and the striatum (Dracheva et al., 2005; Gotz et al., 1997; Jonas and Burnashev, 1995), the nuclei of the human thalamus examined in this study contain mostly Ca2+-impermeable GluR2-containing AMPA receptors, whereas most AMPA receptors in the nonhuman primate thalamus are permeable to Ca2+. The discrepancy may have resulted from the different methods employed: Our human study used qPCR, whereas the monkey studies used either in situ hybridization (Beneyto and Meador-Woodruff, 2004) or a combination of in situ hybridization and immunocytochemistry (Jones et al., 1998). Such a fundamental difference between humans and other primates is unexpected and warrants further study for clarification.
For kainate receptors, the expression pattern (KA2>GluR5>GluR7>GluR6 and non-detected expression of KA1) was similar in all nuclei examined. Based on the reported structure of the functional kainate receptors (Alt et al., 2004; Bleakman et al., 2002), these data suggest that the most abundant kainite receptor assemblies in the human thalamic nuclei examined may be GluR5/KA2 heteromers followed by GluR7/KA2 heteromers. These and similar inferences must be approached with caution, however. In addition to the problems of extrapolating from gene to protein expression, conclusions regarding receptor subunit assembly cannot be drawn from homogenate-based studies since the various subunits could be expressed differently in different cells.
Variations across nuclei
No differences in expression levels were seen for the two subdivisions of MD, and only GluR7 was differentially expressed between the two nuclei of the lateral tier (VLp and VP). In contrast, the majority of genes were differentially expressed between MD and the lateral nuclei, and between the CM and all other nuclei (Fig 3 and Fig 4B). The latter is consistent with a recent microarray finding that CM displays a unique expression profile compared with other thalamic nuclei (Murray et al., 2007). NMDA receptor subunits were expressed at the highest levels within the MD and at the lowest level within the CM consistent with our previous observation that neuronal markers are expressed at lower levels within the CM than other thalamic nuclei (Byne et al., 2008).
Another striking pattern of potential functional significance is the high expression of kainate receptor subunits in the MD, compared to their low expression in VLp and VP. Because kainate receptors are largely presynaptic, this thalamic pattern of gene expression matches the cortical pattern of protein expression observed in the nonhuman primate brain (Carroll et al., 1998) -- higher in the terminal fields of the MD (e.g. BA 32 and 9) than in the terminal fields of VLp and VP (Jones, 1985). It is, therefore, reasonable to speculate that kainate receptors may be especially important to the higher order mental functions associated with MD and its cortical targets as opposed to the motor and somatosensory functions subserved by VLp and VP.
3.3. Correlations between PSD95 and glutamate receptor subunits
Correlations between expression profiles of genes are likely to stem from similar transcriptional control patterns. These, in turn, could reflect the involvement of proteins encoded by these genes in the same pathway(s), their expression in the same cell type, common subcellular or extracellular localization, co-expression of certain genes due to the processes connected to perimortem factors, or any combination of the above. Because of the complexity of the issue, we restricted our analysis to the correlations between iGluR subunits and PSD95, as the latter is known to be expressed only in neurons and to be localized to postsynaptic densities.
In general, the correlations observed in the present study are consistent with PSD95 localization in postsynaptic NMDA receptor-related densities (Kornau et al., 1995). The most striking finding was the strong correlation between PSD95 and the NR2D subunit of the NMDA receptor which was observed in all five nuclei examined. Although there is good evidence that diheteromeric NR2A-, NR2B- and NR2C-containing NMDA receptors participate in synaptic transmission, there has been no evidence for NR1/NR2D-containing receptors at any central synapse, despite the fact that the distinctive single-channel properties of NR1/NR2D receptors have enabled their identification in the extrasynaptic membrane of several cell types (Cull-Candy et al., 2001; Cull-Candy et al., 1998; Momiyama et al., 1996). Although correlational data cannot be viewed as conclusive, our data suggest a synaptic localization of the NR2D-containing NMDA receptors in the thalamus. The NR2D subunit may be present in triheteromeric assemblies (NR1/NR2A(B)/NR2D) at the synapse. These assemblies do not exhibit the slow deactivation of pure NR1/NR2D receptors, and their existence was suggested by immunohistochemical data (Dunah et al., 1998). Another interesting correlation is that between PSD95 and GluR6 in all nuclei examined suggesting a population of synaptic GluR6. This is consistent with a previous demonstration of an interaction between PSD95 and one of the isoforms of GluR6 (GluR6a) (Jaskolski et al., 2005). This interpretation is also strengthened by studies in GluR6-deficient mice showing that GluR6-containing kainate receptors participate in synaptic transmission in the mossy fiber pathway (Mulle et al., 1998).
EXPERIMENTAL PROCEDURES
4.1. Tissue preparation
Subjects
Frozen postmortem brain tissue from the thalamus of subjects diagnosed with SZ and no other psychiatric comorbidities (N=14) by DSM-IV criteria (Harvey et al., 1996; Harvey et al., 1999) and normal elderly controls (NCs) (N=16) was obtained from the Mount Sinai/Bronx Veterans Administration (VA) Medical Center Department of Psychiatry Brain Bank. The mean age, postmortem interval (PMI), tissue pH and sex distributions of the subjects are shown in Table 1. All SZ subjects had been chronically hospitalized at Pilgrim Psychiatric Center (NY) or associated nursing homes for many years. Written informed consent was obtained from the next of kin. All assessment and postmortem procedures were approved by the Institutional Review Boards of Pilgrim Psychiatric Center, Mount Sinai School of Medicine and the Bronx VA Medical Center. NCs had no known history of any psychiatric or neurologic disorder. All patients had thorough neuropathologic characterization to rule out discernable neuropathologies such as Alzheimer’s disease, multi-infarct dementia, etc. (Purohit et al., 1998). All subjects died of natural causes and none had a history of alcoholism and licit or illicit drug abuse.
Table 1. Characteristics of subjects.
Values are listed as Mean (SD).
| N | sex | age | pH | PMI, min |
RIN | |
|---|---|---|---|---|---|---|
| NC | 16 | 9M 7F |
76.6 (11.62) |
6.54 (0.24) |
*510 (399) |
6.83 (0.52) |
| SZ | 14 | 10M 4F |
78.79 (8.59) |
6.53 (0.24) |
934 (516) |
6.71 (0.53) |
M-male; F-female; PMI-postmortem interval; RIN-Agilent RNA integrity number (on a scale 1–10).
PMI for NC subjects significantly shorter than for SZ subjects (p=0.017). After eliminating specimens with gene expression values which were 3 SDs above or below the mean, 10–15 gene expression values were available for each nucleus in NCs and 10–14 values available for SZs.
Cryostat sectioning
Blocks of tissue were sectioned serially in the coronal plane at a thickness of 20 μm on a cryostat. For anatomical localization, the first of each series of 5 sections was mounted onto a regular glass slide, stained with thionin (see below) and cover-slipped. The next set of 4 sections were cut and mounted onto penfoil polymer (PEN) microdissection slides and stored at −80°C until use.
Anatomical parcellation
Our parcellation is illustrated in Fig. 1. The medial border of MD was established by the ventricle and its lateral and superior boundaries by the internal medullary lamina (iml) which extends ventrally to surround the CM. The ventromedial border of the CM is reinforced by fascicles of the prominent fasciculus retroflexus (f) and portions of the parafascicular nucleus (Pf). In these preparations the distinction between the parvocelluar and magnocellular divisions of the MD could not be made definitively on the basis of cytoarchitectonic criteria. The nucleus was, therefore, bisected to give medial and lateral halves. Because of the topography of the MD projection to the PFC, the lateral portion (MDl) projects to the more lateral portion of the PFC, while the more medial portion (MDm) projects more medially(Goldman-Rakic and Porrino, 1985). MDl and MDm correspond approximately to the parvocellar and magnocellular divisions of MD, respectively. The lateral border of the thalamus was taken as the easily discernible external medullary lamina which intervenes between the lateral nuclei and the reticular nucleus. The boundary between VP (which contains both VPl and VPm) and VLp was made on the basis of neuronal orientation. The neurons of VP exhibit a prominent alignment along diagonally oriented fibers, whereas, the neurons of VLp appear more homogenously arranged in the coronal plane. The medial borders of VLp and VP are established by the internal medullary lamina (arrows) that constitutes to lateral border of the MD and CM.
Figure 1.

A) Representative uncoverslipped thionin stained 20 micron coronal frozen section through the middle of the thalamus at the level of the CM. Arrows indicate the internal medullary lamina. Abbreviations: CM centromedian nucleus; f, fasciculus retroflexus ; MDl lateral sector of mediodorsal nucleus; MDm medial sector of medial dorsal nucleus; Pf parafascicular nucleus; VLp ventrolateral posterior nucleus; VP ventral posterior nucleus.
B) Same section as in panel A after laser microdissection of the CM. The dots were placed on the glass side of the Leica microdissection slides to delineate the divisions to be dissected (see Experimental Procedures).
Staining
On the day of microdissection, PEN slides at the anatomical level desired for dissection were identified by reference to nearly adjacent thionin-stained reference sections that had been previously examined by one of the investigators who drew the boundaries of each nucleus onto cover-slips. The identified PEN slides were removed from the freezer, immediately fixed in 100% ethanol for 1 min and then rehydrated in a graded series of ethanol/water (95%, 75%, 50%; each one minute). Sections were then stained for ~ 20 sec in 1% Thionin in 0.05M NaCH3COO buffer, pH 4.5, dehydrated (75%, 95%, 100% ethanols, 1 min each), dried for 1 min and immediately used for microdissection. All solutions were prepared with diethylpyrocarbonate (DEPC)-treated water.
Laser capture microdissection (LCM)
LCM was performed using Leica AS LMD system (Leica Microsystems Inc, Bannockburn, IL). Every effort was made to maintain a near surgical aseptic setting when handling tissue blocks, slides, and tissue sections for LCM to protect against RNA degradation by RNAses. Stained sections were examined using a Leica binocular dissecting scope with zoom magnification (6.3–40×) and the boundaries for each nucleus were outlined onto the bottom of the slides using an ultra-fine point marking pen. The individual thalamic nuclei were then dissected by LCM into multiple collection tubes from 4 adjacent slides per subject (Fig. 1). The amount of dissected tissue varied for different nuclei (30 – 90 mm2) due to the differences between their sizes. Nuclear delineations and dissections were performed blindly relative to the diagnostic and other characteristics of the tissue donors.
4.2. RNA extraction and cDNA synthesis
Total RNA was extracted using the PicoPure RNA isolation Kit (Molecular Devices, Sunnyvale, CA). RNA quality and concentration were evaluated using BioAnalyzer (Agilent Technologies, Santa Clara, CA). Only samples with RNA integrity number (RIN) ≥ 6 were employed (Table 1 and Supplementary Table 1). cDNA was synthesized by reverse transcriptase (RT) reaction using High Capacity cDNA Reverse Transcription Kit (Applied Biosystems, Foster City, CA). Different amounts of isolated RNA were used for RT reactions in each nucleus: 400 ng (MDm), 300 ng (MDl), 250 ng (VLp), 250 ng (VP), and 200 ng (CM). For a given nucleus, equal amounts of RNA were used for each subject.
4.3. Real time quantitative PCR (qPCR)
mRNA expression was measured by qPCR using an ABI Prism 7900 Sequence Detector (Applied Biosystems) and gene-specific TaqMan FAM/MGB assays (Applied Biosystems; Table 2) mostly as previously described (Dracheva et al., 2005; Dracheva et al., 2006). Each 20 μl PCR reaction consisted of 5 μl of the relevant cDNA (diluted 25 times in H2O), a specific TaqMan assay, and 10 μl of the 2xPCR Gold Master Mix (Applied Biosystems), which contained ROX, Aplitag Gold DNA polymerase, AmpErase UNG, dATP, dCTP, dGTP, dUTP, and MgCl2. The thermal cycling program consisted of 2 min at 50°C, 10 min at 95°C, followed by 40 cycles of 15 sec at 95°C and 1 min at 60°C. Only one cDNA was amplified in each PCR (monoplex). The reactions were run in triplicate for each sample. To account for the differences in the amounts of input material between the samples, the expression values of the target genes were normalized to the expression of endogenous controls. Six different endogenous control genes were initially tested (glyceraldehyde-3-phosphate dehydrogenase (GAPDH), beta-2-microglobulin (B2M), beta glucuronidase (GUSB), phosphoglycerate kinase 1 (PGK1) cyclophilin A (PPIA), and large ribosomal protein (RPLPO)). Those were ranked according to their expression stability by computing the average pairwise variation for each control gene paired with all other tested control genes using geNorm software (http://medgen.ugent.be/~jvdesomp/genorm/). PPIA, GUSB, and RPLPO were the most stably expressed genes in these sample sets; therefore, the geometric mean of their expression levels was used for normalization. Averaging of multiple internal control genes that have been empirically selected for their stability has been demonstrated to provide a more accurate normalization of quantitative PCR data than single gene normalization (Vandesompele et al., 2002).
Table 2. Description of TaqMan assays employed.
| Target | TaqMan® Assay ID | Ref Sequence |
|---|---|---|
| NMDA receptor, subunit R1 NR1 (GRIN1) | Hs00609557_m1 | NM_000832, NM_021569, NM_007327 |
| NMDA receptor, subunit 2A NR2A (GRIN2A) | Hs00168219_m1 | NM_000833 |
| NMDA receptor, subunit 2B NR2B (GRIN2B) | Hs00168230_m1 | NM_000834 |
| NMDA receptor, subunit 2C NR2C (GRIN2C) | Hs01016626_m1 | NM_000835 |
| NMDA receptor, subunit 2D NR2D (GRIN2D) | Hs00181352_m1 | NM_000836 |
| AMPA receptor, subunit 1 GluR1 (GRIA1) | Hs00181348_m1 | NM_000827 |
| AMPA receptor, subunit 2 GluR2 (GRIA2) | Hs00181331_m1 | NM_000826 |
| AMPA receptor, subunit 3 GluR3 (GRIA3) | Hs00241485_m1 |
NM_000828 NM_007325 |
| AMPA receptor, subunit 4 GluR4 (GRIA4) | Hs00168163_m1 | NM_000829, NM_001077243 |
| Kainate receptor, subunit 1 GluR5 (GRIK1) | Hs00168165_m1 | NM_175611, NM_000830 |
| Kainate receptor, subunit 2 GluR6 (GRIK2) | Hs00222637_m1 | NM_175768, NM_021956 |
| Kainate receptor, subunit 3 GluR7 (GRIK3) | Hs00168182_m1 | NM_000831 |
| Kainate receptor, subunit 4 KA1 (GRIK4) | Hs00205979_m1 | NM_014619 |
| Kainate receptor, subunit 5 KA2 (GRIK5) | Hs00361590_m1 | NM_002088 |
| Cyclophilin A, PPIA | Endogenous Control Assay | |
| Beta glucuronidase, GUSB | Endogenous Control Assay | |
| Large ribosomal protein, RPLP0 | Endogenous Control Assay |
The relative expression level of target transcripts was determined using Relative Standard Curve Method (RSCM; see Guide to Performing Relative Quantitation of Gene Expression Using Real-Time Quantitative PCR, Applied Biosystems). This approach gives accurate quantitative results since expression values are interpolated from standard curves and, therefore, the differences in the efficiencies of target and control amplifications are accounted for. An additional and significant advantage is that RSCM allows the relative values of different transcripts to be compared with one another. Standard curves were generated for each target assay and for each endogenous control assay by the association between the threshold cycle (Ct) values and different quantities of a “calibrator” cDNA. The “calibrator” was prepared by mixing small quantities of all experimental samples. Using the linear equations of standard curves, the amounts of each target mRNA and each endogenous control mRNA were calculated in each experimental sample. The relative expression level of a target mRNA was computed as the ratio of the target mRNA amount to the geometric mean of the amounts of the three endogenous controls.
4.4. Statistical analysis
Statistical analyses were performed using SPSS 14.0 for Windows (SPSS, Inc., Chicago, IL) and involved ANOVA, ANCOVA and correlational analysis with Bonferroni correction (Myers, 1972) to control for multiple comparisons. ANOVA with diagnosis and thalamic nucleus as classification variables was employed to assess main effects of diagnosis and thalamic nucleus as well as diagnosis by thalamic nucleus interactions. Post hoc analyses were done by Bonferroni-corrected t-tests. Age, PMI and pH were considered as potential covariates: Only age and PMI exhibited significant correlations with any dependent variable. ANCOVAs for the expression level of each gene within each thalamic nucleus were, therefore, run with diagnosis as a classification variable and age and/or pH included as a covariate if significant and if the slope of the regression on the dependent variable did not differ between diagnostic groups. Bonferroni corrections were performed as follows: For differences between diagnostic groups, 5 comparisons were made for each gene (one comparison for each of 5 nuclei), differences were considered statistically significant for ps< .05/5=.01. For each potential covariate, 13 correlations (one per each detected gene) were examined per thalamic nucleus. Thus, the criterion for significance was p< .05/13=.004. For each gene, 10 between thalamic nucleus comparisons were made in each ANOVA and ANCOVA. The criterion for significance was, therefore, p<.05/10=.005. In addition, correlations among the expression levels of PSD95 with the other 12 detected genes were examined within each thalamic division. Separate analyses were conducted for the full sample and for each diagnostic group. Among the genes within each nucleus, 12 correlations were examined giving a criterion for significance of p<.05/12=.004.
Supplementary Material
Acknowledgments
This work was supported by: MH064673 and VA Merit (VH) and MH066392
Footnotes
Abbreviations: AMPA, α-amino-3-hydroxy-5-methyl-4-isoxazole propionic acid; CM, centromedian nucleus; DLPFC, dorsolateral prefrontal cortex; iGluR, ionotropic glutamate receptor; LCM, Laser Capture Microdissection; MD, mediodorsal nucleus; MDl, lateral sector of mediodorsal nucleus; MDm, medial sector of medial dorsal nucleus; NC, normal control; NMDA, N-methyl-D aspartate; PEN, penfoil polymer (polyethylene naphthalate); PFC, prefrontal cortex; PSD95, postsynaptic density 95 protein; qPCR, quantitative real time PCR; RIN, RNA integrity number; RSCM, Relative Standard Curve Method; RT, reverse transcriptase; SZ, schizophrenia; VLp, ventrolateral posterior nucleus; VP, ventral posterior nucleus;
Publisher's Disclaimer: This is a PDF file of an unedited manuscript that has been accepted for publication. As a service to our customers we are providing this early version of the manuscript. The manuscript will undergo copyediting, typesetting, and review of the resulting proof before it is published in its final citable form. Please note that during the production process errors may be discovered which could affect the content, and all legal disclaimers that apply to the journal pertain.
Reference List
- Akbarian S, Sucher NJ, Bradley D, Tafazzoli A, Trinh D, Hetrick WP, Potkin SG, Sandman CA, Bunney WE, Jr, Jones EG. Selective alterations in gene expression for NMDA receptor subunits in prefrontal cortex of schizophrenics, J Neurosci. 1996;16:19–30. doi: 10.1523/JNEUROSCI.16-01-00019.1996. [DOI] [PMC free article] [PubMed] [Google Scholar]
- Alt A, Weiss B, Ogden AM, Knauss JL, Oler J, Ho K, Large TH, Bleakman D. Pharmacological characterization of glutamatergic agonists and antagonists at recombinant human homomeric and heteromeric kainate receptors in vitro, Neuropharmacology. 2004;46:793–806. doi: 10.1016/j.neuropharm.2003.11.026. [DOI] [PubMed] [Google Scholar]
- Andreasen NC. Schizophrenia: the fundamental questions. Brain Res Brain Res Rev. 2000;31:106–112. doi: 10.1016/s0165-0173(99)00027-2. [DOI] [PubMed] [Google Scholar]
- Benes FM, Vincent SL, Todtenkopf M. The density of pyramidal and nonpyramidal neurons in anterior cingulate cortex of schizophrenic and bipolar subjects, Biol Psychiatry. 2001;50:395–406. doi: 10.1016/s0006-3223(01)01084-8. [DOI] [PubMed] [Google Scholar]
- Beneyto M, Meador-Woodruff JH. Expression of transcripts encoding AMPA receptor subunits and associated postsynaptic proteins in the macaque brain. J Comp Neurol. 2004;468:530–554. doi: 10.1002/cne.10981. [DOI] [PubMed] [Google Scholar]
- Bleakman D, Gates MR, Ogden AM, Mackowiak M. Kainate receptor agonists, antagonists and allosteric modulators. Curr Pharm Des. 2002;8:873–885. doi: 10.2174/1381612024607108. [DOI] [PubMed] [Google Scholar]
- Bonnet G, Tyagi S, Libchaber A, Kramer FR. Thermodynamic basis of the enhanced specificity of structured DNA probes. Proc Natl Acad Sci U S A. 1999;96:6171–6176. doi: 10.1073/pnas.96.11.6171. [DOI] [PMC free article] [PubMed] [Google Scholar]
- Bruneau EG, McCullumsmith RE, Haroutunian V, Davis KL, Meador-Woodruff JH. Increased Expression of Glutaminase and Glutamine Synthetase mRNA in the Thalamus in Schizophrenia. Schizophrenia Res. 2005;75:27–34. doi: 10.1016/j.schres.2004.12.012. [DOI] [PubMed] [Google Scholar]
- Buchsbaum MS, Haier RJ, Potkin SG, Nuechterlein K, Bracha HS, Katz M, Lohr J, Wu J, Lottenberg S, Jerabek PA, et al. Frontostriatal disorder of cerebral metabolism in never-medicated schizophrenics, Arch Gen Psychiatry. 1992;49:935–42. doi: 10.1001/archpsyc.1992.01820120023005. [DOI] [PubMed] [Google Scholar]
- Bustin SA. Absolute quantification of mRNA using real-time reverse transcription polymerase chain reaction assays. J Mol Endocrinol. 2000;25:169–193. doi: 10.1677/jme.0.0250169. [DOI] [PubMed] [Google Scholar]
- Byne W, Buchsbaum MS, Mattiace LA, Hazlett EA, Kemether E, Elhakem SL, Purohit DP, Haroutunian V, Jones L. Postmortem assessment of thalamic nuclear volumes in subjects with schizophrenia, Am J Psychiatry. 2002;159:59–65. doi: 10.1176/appi.ajp.159.1.59. [DOI] [PubMed] [Google Scholar]
- Byne W, Dracheva S, Chin B, Schmeidler JM, Davis KL, Haroutunian V. Schizophrenia and Sex Associated Differences in the Expression of Neuronal and Oligodendrocyte Specific Genes in Individual Thalamic Nuclei. Schizo Res. 2008;98:118–128. doi: 10.1016/j.schres.2007.09.034. [DOI] [PMC free article] [PubMed] [Google Scholar]
- Byne W, Tatusov A, Kidkarndee S, Yiannoulos G, Haroutunian V. Schizophrenia-associated reduction of oligodendrocytes in anterior thalamic nucleus. Schizo Res. 2006;85:245–253. doi: 10.1016/j.schres.2006.03.029. [DOI] [PubMed] [Google Scholar]
- Carroll FY, Finkelstein DI, Horne MK, Lawrence AJ, Crawford D, Paxinos G, Beart PM. Regional distribution of low affinity kainate receptors in brain of Macaca fascicularis determined by autoradiography using [3H](2S,4R)-4-methylglutamate. Neurosci Lett. 1998;255:71–74. doi: 10.1016/s0304-3940(98)00720-4. [DOI] [PubMed] [Google Scholar]
- Cattabeni F, Gardoni F, Di Luca M. Pathophysiological implications of the structural organization of the excitatory synapse. Eur J Pharmacol. 1999;375:339–347. doi: 10.1016/s0014-2999(99)00299-x. [DOI] [PubMed] [Google Scholar]
- Christopherson KS, Hillier BJ, Lim WA, Bredt DS. PSD-95 assembles a ternary complex with the N-methyl-D-aspartic acid receptor and a bivalent neuronal NO synthase PDZ domain. J Biol Chem. 1999;274:27467–27473. doi: 10.1074/jbc.274.39.27467. [DOI] [PubMed] [Google Scholar]
- Clinton SM, Haroutunian V, Davis KL, Meador-Woodruff JH. Altered transcript expression of NMDA receptor-associated postsynaptic proteins in the thalamus of subjects with schizophrenia, Am J Psychiatry. 2003;160:1100–9. doi: 10.1176/appi.ajp.160.6.1100. [DOI] [PubMed] [Google Scholar]
- Clinton SM, Haroutunian V, Meador-Woodruff JH. Up-regulation of NMDA receptor subunit and post-synaptic density protein expression in the thalamus of elderly patients with schizophrenia. J Neurochem. 2006 2006 Jun 6;98:1114–1125. doi: 10.1111/j.1471-4159.2006.03954.x. [DOI] [PubMed] [Google Scholar]
- Clinton SM, Meador-Woodruff JH. Thalamic dysfunction in schizophrenia: neurochemical, neuropathological, and in vivo imaging abnormalities. Schizophr Res. 2004;69:237–253. doi: 10.1016/j.schres.2003.09.017. [DOI] [PubMed] [Google Scholar]
- Cull-Candy S, Brickley S, Farrant M. NMDA receptor subunits: diversity, development and disease. Curr Opin Neurobiol. 2001;11:327–335. doi: 10.1016/s0959-4388(00)00215-4. [DOI] [PubMed] [Google Scholar]
- Cull-Candy SG, Brickley SG, Misra C, Feldmeyer D, Momiyama A, Farrant M. NMDA receptor diversity in the cerebellum: identification of subunits contributing to functional receptors. Neuropharmacology. 1998;37:1369–1380. doi: 10.1016/s0028-3908(98)00119-1. [DOI] [PubMed] [Google Scholar]
- Cullen TJ, Walker MA, Parkinson N, Craven R, Crow TJ, Esiri MM, Harrison PJ. A postmortem study of the mediodorsal nucleus of the thalamus in schizophrenia, Schizophr Res. 2003;60:157–66. doi: 10.1016/s0920-9964(02)00297-9. [DOI] [PubMed] [Google Scholar]
- Danos P, Baumann B, Bernstein HG, Stauch R, Krell D, Falkai P, Bogerts B. The ventral lateral posterior nucleus of the thalamus in schizophrenia: a post-mortem study, Psychiatry Res. 2002;114:1–9. doi: 10.1016/s0925-4927(01)00131-7. [DOI] [PubMed] [Google Scholar]
- Dingledine R, Borges K, Bowie D, Traynelis SF. The glutamate receptor ion channels. Pharmacol Rev. 1999;51:7–61. [PubMed] [Google Scholar]
- Dorph-Petersen KA, Pierri JN, Sun Z, Sampson AR, Lewis DA. Stereological analysis of the mediodorsal thalamic nucleus in schizophrenia: volume, neuron number, and cell types. J Comp Neurol. 2004;472:449–462. doi: 10.1002/cne.20055. [DOI] [PubMed] [Google Scholar]
- Dracheva S, Davis KL, Chin B, Woo DA, Schmeidler J, Haroutunian V. Myelin-associated mRNA and protein expression deficits in the anterior cingulate cortex and hippocampus in schizophrenia. Neurobiol Dis. 2006;79:157–173. doi: 10.1016/j.nbd.2005.08.012. [DOI] [PubMed] [Google Scholar]
- Dracheva S, Marras SA, Elhakem SL, Kramer FR, Davis KL, Haroutunian V. N-methyl-D-aspartic acid receptor expression in the dorsolateral prefrontal cortex of elderly patients with schizophrenia, Am J Psychiatry. 2001;158:1400–10. doi: 10.1176/appi.ajp.158.9.1400. [DOI] [PubMed] [Google Scholar]
- Dracheva S, McGurk SR, Haroutunian V. mRNA expression of AMPA receptors and AMPA receptor binding proteins in the cerebral cortex of elderly schizophrenics. J Neurosci Res. 2005;79:868–878. doi: 10.1002/jnr.20423. [DOI] [PubMed] [Google Scholar]
- Dunah AW, Luo J, Wang YH, Yasuda RP, Wolfe BB. Subunit composition of N-methyl-D-aspartate receptors in the central nervous system that contain the NR2D subunit. Mol Pharmacol. 1998;53:429–437. doi: 10.1124/mol.53.3.429. [DOI] [PubMed] [Google Scholar]
- Ehlers MD. Synapse structure: glutamate receptors connected by the shanks. Curr Biol. 1999;9:R848–R850. doi: 10.1016/s0960-9822(00)80043-3. [DOI] [PubMed] [Google Scholar]
- Geiger JR, Melcher T, Koh DS, Sakmann B, Seeburg PH, Jonas P, Monyer H. Relative abundance of subunit mRNAs determines gating and Ca2+ permeability of AMPA receptors in principal neurons and interneurons in rat CNS, Neuron. 1995;15:193–204. doi: 10.1016/0896-6273(95)90076-4. [DOI] [PubMed] [Google Scholar]
- Goff DC, Coyle JT. The emerging role of glutamate in the pathophysiology and treatment of schizophrenia. AmJPsychiat. 2001;158:1367–1377. doi: 10.1176/appi.ajp.158.9.1367. [DOI] [PubMed] [Google Scholar]
- Goldman-Rakic PS, Porrino LJ. The primate mediodorsal nucleus and its projections to the frontal lobe, Journal of Comparative Neurology. 1985;242:535–560. doi: 10.1002/cne.902420406. [DOI] [PubMed] [Google Scholar]
- Gotz T, Kraushaar U, Geiger J, Lubke J, Berger T, Jonas P. Functional properties of AMPA and NMDA receptors expressed in identified types of basal ganglia neurons. J Neurosci. 1997;17:204–215. doi: 10.1523/JNEUROSCI.17-01-00204.1997. [DOI] [PMC free article] [PubMed] [Google Scholar]
- Gur RE, Cowell PE, Latshaw A, Turetsky BI, Grossman RI, Arnold SE, Bilker WB, Gur RC. Reduced dorsal and orbital prefrontal gray matter volumes in schizophrenia, Arch Gen Psychiatry. 2000;57:761–8. doi: 10.1001/archpsyc.57.8.761. [DOI] [PubMed] [Google Scholar]
- Haroutunian V, Dracheva S, Davis KL. Neurobiology of glutamatergic abnormalities in schizophrenia, Clinical Neuroscience Research. 2003;3:67–76. [Google Scholar]
- Harrison PJ. The hippocampus in schizophrenia: a review of the neuropathological evidence and its pathophysiological implications, Psychopharmacology (Berl) 2004;174:151–162. doi: 10.1007/s00213-003-1761-y. [DOI] [PubMed] [Google Scholar]
- Harvey PD, Lombardi J, Leibman M, White L, Parrella M, Powchik P, Davidson M. Cognitive impairment and negative symptoms in geriatric chronic schizophrenic patients: a follow-up study. Schizophr Res. 1996;22:223–231. doi: 10.1016/s0920-9964(96)00075-8. [DOI] [PubMed] [Google Scholar]
- Harvey PD, Silverman JM, Mohs RC, Parrella M, White L, Powchik P, Davidson M, Davis KL. Cognitive decline in late-life schizophrenia: a longitudinal study of geriatric chronically hospitalized patients, Biol. Psychiatry. 1999;45:32–40. doi: 10.1016/s0006-3223(98)00273-x. [DOI] [PubMed] [Google Scholar]
- Haznedar MM, Buchsbaum MS, Hazlett EA, Shihabuddin L, New A, Siever LJ. Cingulate gyrus volume and metabolism in the schizophrenia spectrum. Schizophr Res. 2004;71:249–262. doi: 10.1016/j.schres.2004.02.025. [DOI] [PubMed] [Google Scholar]
- Healy DJ, Haroutunian V, Powchik P, Davidson M, Davis KL, Watson SJ, Meador-Woodruff JH. AMPA receptor binding and subunit mRNA expression in prefrontal cortex and striatum of elderly schizophrenics, Neuropsychopharmacology. 1998;19:278–86. doi: 10.1016/S0893-133X(98)00014-1. [DOI] [PubMed] [Google Scholar]
- Healy DJ, Meador-Woodruff JH. Clozapine and haloperidol differentially affect AMPA and kainate receptor subunit mRNA levels in rat cortex and striatum, Brain Res Mol Brain Res. 1997;47:331–8. doi: 10.1016/s0169-328x(97)00064-8. [DOI] [PubMed] [Google Scholar]
- Hollmann M, Hartley M, Heinemann S. Ca2+ permeability of KA-AMPA--gated glutamate receptor channels depends on subunit composition, Science. 1991;252:851–853. doi: 10.1126/science.1709304. [DOI] [PubMed] [Google Scholar]
- Hollmann M, Heinemann S. Cloned Glutamate Receptors. In: Cowan W, Shooter E, Stevens C, Thompson R, editors. Annual Review of Neuroscience. Annual Reviews Inc.; Palo Alto: 1994. pp. 31–108. [DOI] [PubMed] [Google Scholar]
- Ibrahim HM, Hogg AJ, Jr, Healy DJ, Haroutunian V, Davis KL, Meador-Woodruff JH. Ionotropic glutamate receptor binding and subunit mRNA expression in thalamic nuclei in schizophrenia, Am J Psychiatry. 2000;157:1811–23. doi: 10.1176/appi.ajp.157.11.1811. [DOI] [PubMed] [Google Scholar]
- Jaskolski F, Coussen F, Mulle C. Subcellular localization and trafficking of kainate receptors. Trends Pharmacol Sci. 2005;26:20–26. doi: 10.1016/j.tips.2004.11.008. [DOI] [PubMed] [Google Scholar]
- Javitt D, Zukin S. Recent Advances in the Phencyclidine Model of Schizophrenia, Am J Psychiatry. 1991;148:1301–1308. doi: 10.1176/ajp.148.10.1301. [DOI] [PubMed] [Google Scholar]
- Jonas P, Burnashev N. Molecular mechanisms controlling calcium entry through AMPA-type glutamate receptor channels, Neuron. 1995;15:987–990. doi: 10.1016/0896-6273(95)90087-x. [DOI] [PubMed] [Google Scholar]
- Jones EG. The Thalamus. Plenum Press; New York: 1985. [Google Scholar]
- Jones EG. Thalamic circuitry and thalamocortical synchrony. Philos Trans R Soc Lond B Biol Sci. 2002;357:1659–1673. doi: 10.1098/rstb.2002.1168. [DOI] [PMC free article] [PubMed] [Google Scholar]
- Jones EG, Tighilet B, Tran BV, Huntsman MM. Nucleus- and cell-specific expression of NMDA and non-NMDA receptor subunits in monkey thalamus, J Comp Neurol. 1998;397:371–393. doi: 10.1002/(sici)1096-9861(19980803)397:3<371::aid-cne5>3.0.co;2-#. [DOI] [PubMed] [Google Scholar]
- Kemether EM, Buchsbaum MS, Byne W, Hazlett EA, Haznedar M, Brickman AM, Platholi J, Bloom R. Magnetic resonance imaging of mediodorsal, pulvinar, and centromedian nuclei of the thalamus in patients with schizophrenia, Arch Gen Psychiatry. 2003;60:983–91. doi: 10.1001/archpsyc.60.9.983. [DOI] [PubMed] [Google Scholar]
- Kennedy MB. The postsynaptic density at glutamatergic synapses. Trends Neurosci. 1997;20:264–268. doi: 10.1016/s0166-2236(96)01033-8. [DOI] [PubMed] [Google Scholar]
- Kornau HC, Schenker LT, Kennedy MB, Seeburg PH. Domain interaction between NMDA receptor subunits and the postsynaptic density protein PSD-95, Science. 1995;269:1737–1740. doi: 10.1126/science.7569905. [DOI] [PubMed] [Google Scholar]
- Krystal JH, Karper LP, Seibyl JP, Freeman GK, Delaney R, Bremmer JD, Heninger GR, Bowers MB, Charney DS. Subanesthetic effects of the noncompetitive NMDA antagonist, ketamine, in humans: psychotomimetic, perceptual, cognitive and neuroendocrine responses. Arch Gen Psychiatry. 1994;51:199–214. doi: 10.1001/archpsyc.1994.03950030035004. [DOI] [PubMed] [Google Scholar]
- Lau CG, Zukin RS. NMDA receptor trafficking in synaptic plasticity and neuropsychiatric disorders. Nat Rev Neurosci. 2007;8:413–426. doi: 10.1038/nrn2153. [DOI] [PubMed] [Google Scholar]
- Mayer ML. Glutamate receptor ion channels. Curr Opin Neurobiol. 2005;15:282–288. doi: 10.1016/j.conb.2005.05.004. [DOI] [PubMed] [Google Scholar]
- Meador-Woodruff JH, Healy DJ. Glutamate receptor expression in schizophrenic brain. Brain Res Brain Res Rev. 2000;31:288–294. doi: 10.1016/s0165-0173(99)00044-2. [DOI] [PubMed] [Google Scholar]
- Meador-Woodruff JH, King RE, Damask SP, Bovenkerk KA. Differential regulation of hippocampal AMPA and kainate receptor subunit expression by haloperidol and clozapine, Mol Psychiatry. 1996;1:41–53. [PubMed] [Google Scholar]
- Momiyama A, Feldmeyer D, Cull-Candy SG. Identification of a native low-conductance NMDA channel with reduced sensitivity to Mg2+ in rat central neurones. J Physiol. 1996;494:479–492. doi: 10.1113/jphysiol.1996.sp021507. [DOI] [PMC free article] [PubMed] [Google Scholar]
- Mulle C, Sailer A, Perez-Otano I, Dickinson-Anson H, Castillo PE, Bureau I, Maron C, Gage FH, Mann JR, Bettler B, Heinemann SF. Altered synaptic physiology and reduced susceptibility to kainate-induced seizures in GluR6-deficient mice. Nature. 1998;392:601–605. doi: 10.1038/33408. [DOI] [PubMed] [Google Scholar]
- Murray KD, Choudary PV, Jones EG. Nucleus- and cell-specific gene expression in monkey thalamus. Proc Natl Acad Sci U S A. 2007;104:1989–1994. doi: 10.1073/pnas.0610742104. [DOI] [PMC free article] [PubMed] [Google Scholar]
- Myers JL. Fundamentals of experimental design. Allyn and Bacon; Boston: 1972. [Google Scholar]
- O’Connor JA, Muly EC, Arnold SE, Hemby SE. AMPA receptor subunit and splice variant expression in the DLPFC of schizophrenic subjects and rhesus monkeys chronically administered antipsychotic drugs. Schizophr Res. 2007;90:28–40. doi: 10.1016/j.schres.2006.10.004. [DOI] [PMC free article] [PubMed] [Google Scholar]
- Pakkenberg B. Pronounced reduction of total neuron number in mediodorsal thalamic nucleus and nucleus accumbens in schizophrenics. Arch Gen Psychiatry. 1990;47:1023–1028. doi: 10.1001/archpsyc.1990.01810230039007. [DOI] [PubMed] [Google Scholar]
- Popken GJ, Bunney WE, Jr, Potkin SG, Jones EG. Subnucleus-specific loss of neurons in medial thalamus of schizophrenics, Proc Natl Acad Sci U S A. 2000;97:9276–80. doi: 10.1073/pnas.150243397. [DOI] [PMC free article] [PubMed] [Google Scholar]
- Purohit DP, Perl DP, Haroutunian V, Powchik P, Davidson M, Davis KL. Alzheimer disease and related neurodegenerative diseases in elderly patients with schizophrenia: a postmortem neuropathologic study of 100 cases, Arch Gen Psychiatry. 1998;55:205–11. doi: 10.1001/archpsyc.55.3.205. [DOI] [PubMed] [Google Scholar]
- Rausell E, Bae CS, Vinuela A, Huntley GW, Jones EG. Calbindin and parvalbumin cells in monkey VPL thalamic nucleus: distribution, laminar cortical projections, and relations to spinothalamic terminations. J Neurosci. 1992;12:4088–4111. doi: 10.1523/JNEUROSCI.12-10-04088.1992. [DOI] [PMC free article] [PubMed] [Google Scholar]
- Ray JP, Price JL. The organization of projections from the mediodorsal nucleus of the thalamus to orbital and medial prefrontal cortex in macaque monkeys, J Comp Neurol. 1993;337:1–31. doi: 10.1002/cne.903370102. [DOI] [PubMed] [Google Scholar]
- Schefe JH, Lehmann KE, Buschmann IR, Unger T, Funke-Kaiser H. Quantitative real-time RT-PCR data analysis: current concepts and the novel “gene expression’s CT difference” formula. J Mol Med. 2006;84:901–910. doi: 10.1007/s00109-006-0097-6. [DOI] [PubMed] [Google Scholar]
- Selemon LD, Rajkowska G, Goldman-Rakic PS. Abnormally high neuronal density in the schizophrenic cortex. A morphometric analysis of prefrontal area 9 and occipital area 17, Arch Gen Psychiatry. 1995;52:805–18. doi: 10.1001/archpsyc.1995.03950220015005. [DOI] [PubMed] [Google Scholar]
- Selemon LD, Rajkowska G, Goldman-Rakic PS. Elevated neuronal density in prefrontal area 46 in brains from schizophrenic patients: application of a three-dimensional, stereologic counting method, J Comp Neurol. 1998;392:402–12. [PubMed] [Google Scholar]
- Sheng M, Pak DT. Glutamate receptor anchoring proteins and the molecular organization of excitatory synapses. Ann N Y Acad Sci. 1999;868:483–493. doi: 10.1111/j.1749-6632.1999.tb11317.x. [DOI] [PubMed] [Google Scholar]
- Spurney CF, Baca SM, Murray AM, jaskiw GE, Kleinman JE, Hyde TM. Differential effects of haloperidol and clozapine on ionotropic glutamate receptors in rats, Synapse. 1999;34:266–76. doi: 10.1002/(SICI)1098-2396(19991215)34:4<266::AID-SYN3>3.0.CO;2-2. [DOI] [PubMed] [Google Scholar]
- Steriade M, Jones EG, McCormick DA. The Thalamus. Elsevier; Oxford, UK: 1997. [Google Scholar]
- Tascedda F, Blom JM, Brunello N, Zolin K, Gennarelli M, Colzi A, Bravi D, Carra S, Racagni G, Riva MA. Modulation of glutamate receptors in response to the novel antipsychotic olanzapine in rats, Biol. Psychiatry. 2001;50:117–122. doi: 10.1016/s0006-3223(01)01135-0. [DOI] [PubMed] [Google Scholar]
- Tascedda F, Lovati E, Blom JM, Muzzioli P, Brunello N, Racagni G, Riva MA. Regulation of ionotropic glutamate receptors in the rat brain in response to the atypical antipsychotic seroquel (quetiapine fumarate), Neuropsychopharmacology. 1999;21:211–217. doi: 10.1016/S0893-133X(99)00034-2. [DOI] [PubMed] [Google Scholar]
- Tyagi S, Kramer FR. Molecular beacons: probes that fluoresce upon hybridization. Nat Biotechnol. 1996;14:303–308. doi: 10.1038/nbt0396-303. [DOI] [PubMed] [Google Scholar]
- Vandesompele J, De Preter K, Pattyn F, Poppe B, Van Roy N, De Paepe A, Speleman F. Accurate normalization of real-time quantitative RT-PCR data by geometric averaging of multiple internal control genes. Genome Biol. 2002;3:RESEARCH0034. doi: 10.1186/gb-2002-3-7-research0034. [DOI] [PMC free article] [PubMed] [Google Scholar]
- Vawter MP, Crook JM, Hyde TM, Kleinman JE, Weinberger DR, Becker KG, Freed WJ. Microarray analysis of gene expression in the prefrontal cortex in schizophrenia: a preliminary study, Schizophr Res. 2002;58:11–20. doi: 10.1016/s0920-9964(01)00377-2. [DOI] [PubMed] [Google Scholar]
- Young KA, Holcomb LA, Yazdani U, Hicks PB, German DC. Elevated neuron number in the limbic thalamus in major depression. Am J Psychiatry. 2004;161:1270–1277. doi: 10.1176/appi.ajp.161.7.1270. [DOI] [PubMed] [Google Scholar]
- Young KA, Manaye KF, Liang C, Hicks PB, German DC. Reduced number of mediodorsal and anterior thalamic neurons in schizophrenia, Biol Psychiatry. 2000;47:944–953. doi: 10.1016/s0006-3223(00)00826-x. [DOI] [PubMed] [Google Scholar]
Associated Data
This section collects any data citations, data availability statements, or supplementary materials included in this article.