

Abstract
Considerable evidence based on the study of post-mortem brain tissue suggests deficits in both neuronal and myelin systems in schizophrenia (SZ). To date, most (may be “the majority of the”?) biochemical and molecular biological studies have focused on the cerebral cortex. Most information traveling to or from the cortex is relayed or synaptically gated through the thalamus, and numerous studies suggest structural and functional abnormalities in interconnected regions of the thalamus and cortex in SZ. The present study extends our gene expression studies of neuronal and myelin systems to the thalamus. Quantitative PCR was employed to assess the expression of 10 genes in 5 divisions of the thalamus which were precisely harvested using laser capture microdissection. The divisions studies were present on coronal sections at the level of the centromedian nucleus (CMN) taken from 14 schizophrenic and 16 normal control postmortem brains. The genes examined were specific for oligodendrocytes (MAG, CNP, MBP), neurons (ENO2), glutamatergic neurons (VGlut1, VGlut-2, PV, CB) or GABAergic neurons (GAD65, GAD67). Expression levels for each of these markers were quantitated and compared between diagnoses, between sexes, and across nuclei. CB was much more highly expressed in the CMN in SZs compared to NCs. No other diagnosis related differences in gene expression were observed. The expression levels of CNP and MAG, but not MBP, were highly correlated with one another and both, but not MBP, were much more highly expressed in females than in males in all thalamic divisions examined. All markers were differentially expressed across nuclei.
Keywords: Schizophrenia, Thalamus, Neurons, Oligodendrocytes, Gene Expression
1. INTRODUCTION
The thalamus is of interest in psychiatric disorders because its component nuclei provide links for multiple functional circuits that convey information to and from most regions of the cerebral cortex. Because pathology in a particular brain region may induce both structural and functional abnormalities in its fields of projection (Bleier 1969), thalamic pathology might be expected to accompany disorders, including schizophrenia (SZ), that involve cortical anomalies. Structural and functional abnormalities have been described in multiple cortical regions in SZ, particularly in the prefrontal cortex (Benes et al. 1991;Gur et al. 2000;Heckers et al. 2000;Lehrer et al. 2005;Lewis et al. 2001;Selemon et al. 1995;Selemon et al. 1998) and in the anterior cingulate cortex (Benes et al. 1991;Dracheva et al. 2006;Haznedar et al. 2004;Stark et al. 2004). Abnormalities have also been described in prefrontally projecting thalamic nuclei in SZ by studies that employed a variety of postmortem and in vivo anatomical and functional techniques (Popken et al. 2000;Buchsbaum et al. 1996;Danos et al. 2003;Gilbert et al. 2001;Hazlett et al. 2004;Highley et al. 2003;Young et al. 2000;Byne et al. 2001;Byne et al. 2006;Danos et al. 1998;Danos et al. 2002;Pakkenberg 1992). Interpretation of these positive findings, however, is complicated by failures of replication (Dorph-Petersen et al. 2004;Young et al. 2004;Cullen et al. 2003). Gene expression studies offer another avenue for probing the thalamus for SZ-related abnormalities. Such studies are potentially informative with respect to disorder-associated variation in thalamic cell function as well as to variation in the relative numbers of various cell types.
In the present study, we employed quantitative real time PCR (qPCR) to examine expression levels of seven neuronal genes (neuronal enolase 2 gamma (ENO2), two vesicular glutamate transporters (VGlut1, VGlut2), two glutamate decarboxylases (GAD65, GAD67), parvalbumin (PV) and calbindin (CB)) and three oligodendrocyte genes (2′,3′-cyclic nucleotide 3′-phosphodiesterase (CNP), myelin-associated glycoprotein (MAG), myelin basic protein (MBP)) in the thalamus. The genes investigated were chosen to differentiate between oligodendrocytes (CNP, MAG, MBP) and neurons (ENO2), and to further differentiate neurons between glutamatergic (VGlut1, VGlut2) and GABAergic (GAD65, GAD67) types. Two additional markers, parvalbumin (PV) and calbindin (CB) were investigated because their expression is believed to differentiate between categories of glutamatergic projection neurons that differ with respect to their function and pattern of projections to cortex. Specifically, neurons immunoreactive for PV give rise to the specific thalamocortical projection, whereas those immunoractive for CB give rise to the nonspecific projection (Jones 1998).
We examined the expression of these genes in five thalamic divisions present on coronal blocks taken from the middle of the thalamus in the anterior to posterior plane. The regions dissected represent four functional divisions of the thalamus: motor (dorsal posterior; DP), somatosensory (ventral posterior; VP), intralaminar (centromedian, CM) and associational (mediodorsal, MDN) (Fig. 1). Our parcellation follows the standardized parcellation and nomenclature of Feremutsch and Simma (Dewulf 1971). The MDN, which has been extensively studied in SZ (Popken et al. 2000;Buchsbaum et al. 1996;Cullen et al. 2003;Danos et al. 1998;Danos et al. 2002;Danos et al. 2003;Gilbert et al. 2001;Hazlett et al. 2004;Highley et al. 2003;Young et al. 2000;Young et al. 2004;Byne et al. 2000;Byne et al. 2006;Dorph-Petersen et al. 2004;Pakkenberg 1992), was subdivided into medial (MDm) and lateral (MDl) divisions which project, respectively, to medial and lateral prefrontal cortices (Goldman-Rakic and Porrino 1985) (Fig. 1).
Figure 1.
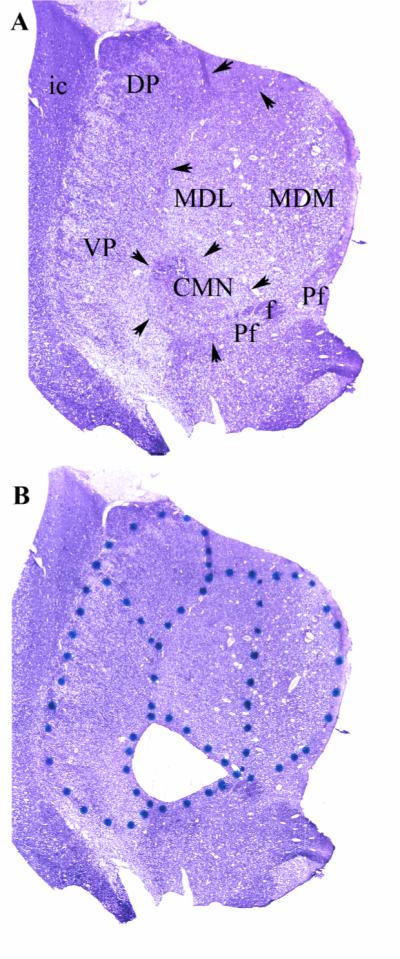
Figure 1: A) Representative uncoverslipped thionin stained 20 micron coronal frozen section through the middle of the thalamus at the level of the CMN. Arrows indicate the internalmedullary lamina which surrounds the CMN and forms the lateral and dorsal borders of the MDN. The ventromedial border of the CMN is reinforced by fascicles of the prominent fasciculus retroflexus (f) and portions of the parafascicular nucleus (Pf). In these preparations the distinction between the parvocelluar and magnocellular divisions of the MD could not be made definitively on the basis of cytoarchitectonic criteria. The nucleus was, therefore, bisected to give medial and lateral halves. Because of the topography of the MD projection to prefrontal cortex, the lateral portion (MDL) projects to the more lateral portion of the prefrontal cortex, while the more medial portion (MDM) projects more medially(Goldman-Rakic and Porrino 1985). MDL and MDM correspond approximately to the parvocellar and magnocellular divisions of MD, respectively. The lateral border of the thalamus is the easily discernible external medullary lamina which intervenes between the reticular nucleus and the internal capsule (ic). The boundary between VP (which contains both VPL and VPM) and DP was made on the basis of neuronal orientation. The neurons of VP exhibit a prominent alignment along diagonally oriented fibers, whereas, the neurons of DP are more homogenously arranged. The medial borders of DP and VP are established by the internal medullary lamina (arrows) that constitutes to lateral border of the MD and CMN.
B) Same section as in panel A after laser microdissection of the CMN. The dots were placed on the glass side of the Leica microdissection slides to delineate the divisions to be dissected (see Methods).
2. METHODS
2.1 Tissue Preparation
2.1.1. Subjects
Frozen postmortem brain tissue from the thalamus of subjects diagnosed with SZ (N=14) by DSM-IV criteria and normal elderly controls (NCs) (N=16) were obtained from the Mount Sinai/Bronx Veterans Administration (VA) Medical Center Department of Psychiatry Brain Bank. The mean age, postmortem interval (PMI), tissue pH and sex distributions of the subjects are shown in Table 1. All SZ subjects had been chronically hospitalized at Pilgrim Psychiatric Center (NY) or associated nursing homes for many years. Written Informed Consents were obtained from the next of kin. All assessment and postmortem procedures were approved by the Institutional Review Boards of Pilgrim Psychiatric Center, Mount Sinai School of Medicine and the Bronx VA Medical Center. All patients had thorough neuropathologic characterization to rule out discernable neuropathologies such as Alzheimer's disease, multi-infarct dementia, etc. (Purohit et al. 1998). NCs had no known history of any psychiatric or neurologic disorders and no discernable neuropathologic lesions. All subjects died of natural causes. The majority of the specimens used in this study were derived from donors who contributed cortical specimens for our previously published gene expression studies of oligodendrocyte and ionotropic glutamate receptor gene expression(Dracheva et al. 2006;Haroutunian et al. 2006;Dracheva et al. 2005).
Table 1. Characteristics of subjects.
Values are listed as Mean (SD). M-male; F-female; PMI-postmortem interval; RIN-Agilent RNA integrity number (on a scale 1−10).
| N | sex | age | pH | PMI, min | RIN | |
|---|---|---|---|---|---|---|
| NC | 16 | 9M 7F | 76.6 (11.62) | 6.54 (0.24) | *510 (399) | 6.83 (0.52) |
| SZ | 14 | 10M 4F | 78.79 (8.59) | 6.53 (0.24) | 934 (516) | 6.71 (0.53) |
PMI for NC subjects were significantly shorter than for SZ subjects (p=0.017).
2.1.2. Cryostat Sectioning
A Leica Laser Capture Microdissection (LCM) system was employed in this study. The system requires the tissue sections to be mounted on special slides covered with an inert penfoil polymer (PEN). Every effort was made to maintain a near surgical aseptic setting when handling tissue blocks, slides, and tissue sections for LCM to protect against RNA degradation by RNAses. Blocks of tissue were sectioned serially in the coronal plane (∼ −15°C) at a thickness of 20 μm on a cryostat dedicated to this purpose. For anatomical localization, the first of each series of 5 sections was mounted onto glass slides, stained with thionin (see below) and cover-slipped. The next set of 4 sections were cut and mounted onto PEN microdissection slides and were stored at −80°C until used.
2.1.3. Staining and Laser Capture Microdissection (LCM)
On the day of the microdissection the PEN slides at the anatomical levels desired for dissection were identified by reference to nearly adjacent thionin-stained sections that had thalamic subdivisions drawn onto their cover-slips. Our parcellation is illustrated and described in Figure 1. The identified PEN slides were removed from the freezer, immediately fixed in 100% ethanol for 1 min and then rehydrated in ethanol/water graded series (95%, 75%, 50%r; each one minute). Sections were then stained for ∼ 30 sec in 1% Thionin in 0.05M NaCH3COO buffer, pH 4.5, washed in water for 30 sec, dehydrated (75%, 95%, 100% ethanols, 1 min each), dried for 1 min and immediately used for microdissection. All solutions were prepared with DEPC-treated water. The sections were then examined using a Leica binocular dissecting scope with zoom magnification and the boundaries for each nucleus were outlined onto the bottom of the slides using an ultra-fine point marking pen. The individual thalamic nuclei were then dissected by LCM into multiple collection tubes from 4 adjacent slides per subject (Fig. 1). The amount of dissected tissue varied for different nuclei (30 − 90 mm2). Every effort was made to maintain consistency of anatomical level of dissection across subjects. Dissections were performed blindly relative to the diagnostic and other characteristics of the tissue donors.
2.2. RNA Extraction and cDNA Synthesis
Total RNA was extracted using the PicoPure RNA isolation Kit (Arcturus). RNA quality and concentration were evaluated using Agilent BioAnalyzer. Only samples with RNA integrity number (RIN) ≥ 6 were employed (Table 1). cDNA was synthesized by reverse transcriptase reaction (RT) using High Capacity cDNA Reverse Transcription Kit (Applied Biosystems). Equal amounts of isolated RNA were used for the RT reactions for each subject and for each nucleus. The amounts of RNA used in the RT reactions differed for different nuclei: 400 ng, 300 ng, 250 ng, 250 ng, and 200 ng for MDm, MDl, DP, VP, and CM, respectively.
2.3. Real time quantitative PCR (qPCR)
mRNA expression was measured by qPCR using an ABI Prism 7900 Sequence Detector (Applied Biosystems) and gene-specific TaqMan FAM/MGB assays that contain both PCR primers and fluorophore-labeled fluorescent probes (Applied Biosystems; Table 2). Each 20 μl PCR reaction consisted of 5 μl of the relevant cDNA (diluted 25 times in H2O), a specific TaqMan assay, and 10 μl of the 2xPCR Gold Master Mix (Applied Biosystems), which contained ROX, Aplitag Gold DNA polymerase, AmpErase UNG, dATP, dCTP, dGTP, dUTP, and MgCl2. The thermal cycling program consisted of 2 min at 50°C, 10 min at 95°C, followed by 40 cycles of 15 sec at 95°C and 1 min at 60°C. Only one cDNA was amplified in each PCR (monoplex). The reactions were run in triplicate for each sample. To account for the differences in the amounts of input material between the samples, the expression values of the target genes were normalized to the expression of endogenous controls. Six different endogenous control genes were initially tested (glyceraldehyde-3-phosphate dehydrogenase (GAPDH), beta-2-microglobulin (B2M), beta glucuronidase (GUSB), phosphoglycerate kinase 1 (PGK1) cyclophilin A (PPIA), and large ribosomal protein (RPLPO)). Those were ranked according to their expression stability by computing the average pairwise variation for each control gene paired with all other tested control genes using geNorm software (http://medgen.ugent.be/~jvdesomp/genorm/) PPIA, GUSB, and RPLPO were the most stably expressed genes in this cohort and, therefore, the most suitable to use as endogenous control genes. The geometric mean of their expression levels was used for normalization. The averaging of multiple internal control genes has recently been demonstrated to provide accurate normalization of quantitative PCR data (Vandesompele et al. 2002).
Table 2.
Description of TaqMan assays employed.
| Target | TaqMan® Assay ID | Ref Sequence | Assay Location |
|---|---|---|---|
| Myelin basic protein, MBP | Hs00922788_m1 |
NM_001025090 NM_001025092 NM_001025094 NM_001025098 NM_001025101 |
268 268 268 268 840 |
| Myelin associated glycoprotein, MAG | Hs00159000_m1 |
NM_080600 NM_002361 |
1381 1381 |
| 2', 3'-cyclic nucleotide 3' phosphodiesterase, CNP | Hs00263981_m1 | NM_033133 | 820 |
| Solute carrier family 17, VGLUT1 (SLC17A7) | Hs00220404_m1 | NM_020309 | 211 |
| Solute carrier family 17, VGLUT2 (SLC17A6) | Hs00220439_m1 | NM_020346 | 501 |
| Enolase 2 (gamma, neuronal), Eno2 | Hs00157360_m1 | NM_001975 | 887 |
| Parvalbumin, PV | Hs00161045_m1 | NP_002845 | 352 |
| Calbindin1, 28kDa,CB | |||
| Glutamate decarboxylase 1, GAD67 | Hs00241471_m1 | NM_006272 | 1607 |
| Glutamate decarboxylase 2, GAD65 | Hs00609529_m1 | NM_000818 | 1239 |
| Cyclophilin A, PPIA | Endogenous Control Assay | ||
| Beta glucuronidase, GUSB | Endogenous Control Assay | ||
| Large ribosomal protein, RPLP0 | Endogenous Control Assay |
The relative expression level of target transcripts is commonly computed using the Comparative Ct Method (ΔΔCt Method; Ct, threshold cycle). However, valid ΔΔCt calculations require the efficiencies of the target amplification and the reference amplification (endogenous control(s)) to be approximately equal since even small differences between these efficiencies may render significant errors in comparing groups (see Guide to Performing Relative Quantitation of Gene Expression Using Real-Time Quantitative PCR, Applied Biosystems). Therefore, in this study we employed an alternative Relative Standard Curve Methodology (RSCM; see the same Guide). This approach gives more accurate quantitative results since expression values are interpolated from a standard curve(s) and, therefore, the efficiencies of target and control amplifications do not have to be equivalent. An additional and significant advantage is that this RSCM method allows the relative values of different transcripts to be compared with one another.
Standard curves were generated for each target assay and for each endogenous control assay by the association between the Ct values and different quantities of a “calibrator” cDNA. The “calibrator” was prepared by mixing small quantities of all experimental samples. Using the linear equations of standard curves, the amounts of each target mRNA and each endogenous control mRNA were calculated in each experimental sample. The relative expression level of a target mRNA was computed as the ratio of the target mRNA amount to the geometric mean of the amounts of the three endogenous controls.
2.4. Statistical Analysis
Analysis of the data proceeded in several steps, all of which were accomplished using Statistica 6.0 and the Bonferroni method to adjust for multiple comparisons (Myers 1972). First, independent t-tests were done to examine differences between diagnostic groups in the expression level of each gene in each thalamic division. Because 5 between group comparisons were made for each gene (one comparison for each of 5 divisions), differences were considered statistically significant for ps< .05/5=.01. Next, differences in expression levels among thalamic divisions and diagnosis by division interactions were tested by ANOVAs with diagnostic group as a classification variable and thalamic division as a repeated measure. The ANOVA for each gene was considered to represent one experiment with 5 comparisons between diagnostic groups (one for each thalamic division) and 10 comparisons between thalamic divisions. Main effects were considered significant for p≤05/5=.01 for between diagnostic group comparisons and p<.05/10=.005 for between thalamic regions comparisons.
Next, the continuous variables (age, PMI, pH, and RIN) were considered as potential covariates. The possibility of relationships between each of these variables and gene expression levels were examined by correlational analysis. Because age could potentially affect NCs and SZs differently, and because PMIs differed significantly between groups, correlations for these variables were examined separately for each diagnostic group and for the entire sample. For each potential covariate, 10 correlations (one per gene) were examined per thalamic division. Thus, the criterion for significance was p< .05/10=.005. Only one correlation was significant: RIN with MBP in the CMN (r=−.620,p=.002) in the full sample. A negative correlation of similar magnitude approached significance when tested within each diagnostic group. Analyses involving MBP expression in the CMN were, therefore, run with and without RIN as a covariate. In no case did inclusion of this covariate affect the statistical significance of the contrast. Potential effects of sex were examined by employing sex as a categorical variable alone or in combination with diagnosis in analyses parallel to those described above.
Correlations among the expression levels of the 10 genes were examined within each thalamic division. Separate analyses were conducted for each diagnostic group in addition to the entire sample. Among the genes within each nucleus 36 correlations were examined giving a criterion for significance of p<.05/36=.0014.
3. RESULTS
3.1. Thalamic Gene Expression
mRNA expression of 10 target genes (CNP, MAG, MBP, GAD67, GAD65, ENO2, VGlut1, VGlut2, CALB, PV) were measured in 5 thalamic nuclei. All target genes except VGlut1 could be reliably quantitated in each nucleus using Relative Standard Curve Method. In accordance with previously published reports (Fremeau, Jr. et al. 2004;Smith et al. 2001), VGlut1 expression level was below detection in all thalamic nuclei. As illustrated below (Fig. 2), in addition to differences in the expression of the markers between nuclei, large differences in expression levels between different genes were observed within each nucleus. The most dramatic example of this is the difference in mRNA expression levels between PV and CB, with PV mRNA being much more highly expressed. Similarly, among the three oligodendrocyte-specific markers studied, the levels of MBP mRNA were at least 10 times higher than those for CNP or MAG, consistent with the much higher protein expression of MBP compared to CNP and MAG (Baumann and Pham-Dinh 2001).
Figure 2. Gene expression analysis by thalamic region.

The expression levels for both the neuronal and the oligodendrocyte genes varied significantly across regions. Histograms represent means and SEMs. For each gene, histograms that do not share the same symbol represent means that differ statistically (p<.005) after Bonferroni correction. With thalamic region as a repeated measure, there was a significant main effect of region for each gene (p<.00001, each test) examined but no diagnosis by region interactions.
3.2. Effects of Diagnosis
Only CB exhibited a significant difference in expression level between diagnostic groups and this was seen only in the CMN (Figure 3) where it was more highly expressed in SZs than in normal controls (t19=−2.31, p=.004).
Figure 3. CB mRNA expression increased in SZ only in CMN.

Data are means and SEMs. * p=.004.
3.3. Effects of Sex
No sex differences were observed for any neuronal marker; however, two of the oligodendrocyte markers (CNP and MAG) were more highly expressed in females than males across all nuclei as evidenced by main effects of sex in the absence of a sex by thalamic division interaction (Figure 4).
Figure 4. Increased CNP and MAG mRNA expression in women compared to men in all thalamic regions.

Data are means and SEMs. For both genes there was a main effect of sex ((F1,19=13.95, p= .0014 for CNP; F1,19=12.10, p=.0023, for MAG) in the absence of a sex by region interaction.
3.4. Effects of Thalamic Division
Consistent with functional differences between thalamic divisions, highly significant main effects were seen in gene expression for thalamic division for all markers. No interactions of division with diagnosis and/or sex were seen (Figure 1). In general, glutamatergic markers were more highly expressed in the medial and lateral tier nuclei than in the CMN, while GABAergic markers tended to be more highly expressed in the medial nuclei. Although the CMN expressed low levels of most neuronal markers, it exhibited high levels of oligodendrocyte markers. The two divisions of the MDN differed significantly for expression of GABAergic markers (GAD67 and GAD65) with both being more highly expressed in the lateral portion of the nucleus.
3.5. Correlations Between Markers
No significant correlations were seen in either the NC or the SZ group that were not also seen in the full sample, reflecting the greater statistical power obtained with the full sample. In no case did the slope of the regression lines differ between diagnostic groups; therefore, only correlations for the full sample are tabulated (Table 3). The neuronal marker, ENO2, exhibited multiple strong and highly significant correlations with markers associated with glutamatergic thalamic neurons (VGlut2, PV) but not with GABAergic neuron markers (GAD65, GAD67). As ENO2 is expressed by all neurons, this finding probably reflects the fact that, as reported in previous studies, in most nuclei glutamatergic neurons greatly outnumber GABAergic neurons (Spreafico et al. 1983). ENO2 and VGlut2 were both highly correlated with PV in all nuclei examined. In contrast, ENO2 exhibited only one statistically significant correlation with CB and VGlut2 exhibited none. This pattern of correlations is consistent with the much higher expression of PV compared to CB in all nuclei.
Table 3. Correlations among the transcripts within each thalamic region.
Only correlations significant after Bonferroni correction (p<.0014) are shown.
| |
|
MDm |
MDl |
CMN |
VP |
DP |
|---|---|---|---|---|---|---|
| Eno2 | VGlut | r=.8406 | r=.7594 | r=.8671 | r=.7650 | r=.8248 |
| p=.0000 | p=.0000 | p=.0000 | p=.0000 | p=.0000 | ||
| PV | r=.8780 | r=.8911 | r=.7512 | r=.8742 | r=.8517 | |
| p=.0000 | p=.0000 | p=.0001 | p=.0000 | p=.0000 | ||
| CB | ns | r=.5970 | ns | ns | ns | |
| |
|
|
p=.0010 |
|
|
|
| VGlut2 | PV | r=.7787 | r=.7945 | r=.6583 | r=.7806 | r=.7860 |
| |
|
p=.0000 |
p=.0000 |
p=.0011 |
p=.0000 |
p=.0000 |
| GAD65 | GAD67 | r=.7162 | r=.9163 | r=.8660 | r=.8639 | r=.9163 |
| |
|
p=.0000 |
p=.0000 |
p=.0000 |
p=.0000 |
p=.0000 |
| CNP | MAG | r=.8726 | r=.8435 | r=.8847 | r=.8553 | r=.8344 |
| p=.0000 | p=.0000 | p=.0000 | p=.0000 | p=.0000 | ||
| MBP | r=.6864 | ns | ns | ns | ns | |
| p=.0001 |
The two GABAergic markers were highly correlated with one another across all divisions, but exhibited no correlations with any other markers. The oligodendrocyte markers exhibited no correlations with any of the neural markers. CNP was highly correlated with MAG across all divisions but with MBP only in the two divisions of the MDN. MAG and MBP exhibited no significant correlations.
4. DISCUSSION
This is the first study to carry out highly quantitative measurements of gene expression in precisely dissected thalamic nuclei of the human brain. This was accomplished by the combination of laser capture microdissection with real time quantitative PCR. The major findings of the present study are 1) the increased CB expression in SZs relative to NCs in the CMN and 2) the prominent sex difference in the expression of CNP and MAG but not of MBP in all nuclei examined. These findings will be discussed in turn.
4.1. Increased Expression of CB in the CMN of SZs
The only diagnosis-associated effect observed was that CB mRNA expression in the CMN was higher in SZs relative to NCs. This difference is consistent with either an increase in the number of CB-expressing neurons in the CMN or an increase in CB gene expression per neuron. The present study cannot distinguish between those possibilities; therefore, we can only speculate regarding an explanation. Immunocytochemical studies have shown that PV and CB are expressed by separate populations of neurons (Munkle et al. 2000) with different patterns of projections to cortex (Jones 1998). PV expressing neurons project to focal cortical regions and terminate predominately within one cortical column, primarily within laminae III and IV (Jones 1998). In contrast, CB expressing neurons project more diffusely and terminate within lamina VI and on the horizontal processes of lamina. Thus, compared with PV-expressing neurons, the firing of CB-expressing neurons produces more diffuse cortical activation. An increase in the number of CB-expressing neurons or an increase in the ratio of CB- to PV- expressing neurons in SZ might thus result in anomalous patterns of cortical activation. One can speculate as to how such an increase in CB neurons might occur. Possibilities include an anomaly at the stage of neuronal differentiation that determines whether a given neuron ultimately expresses CB or PV, or differential susceptibility to cell death. Another possibility would be an anomaly of migration that results in more CB cells within the CMN in SZ. The majority of neurons within the CMN express PV; however, the CMN is surrounded by the internal medullary lamina in which numerous CB-expressing neurons are embedded (Munkle et al. 2000). CB-expressing neurons within the CMN tend to occur as clusters in close proximity to the lamina and have the appearance of cell rests that “belong” to the lamina. If such cells are indeed rests, the present finding would be consistent with a neurodevelopmental defect in SZ that results in an increased number of such cells that come to finally reside outside of the lamina rather than within it. We carefully avoided including the lamina itself with our CMN dissections; however, the clusters of CB cells in close proximity to but not within the lamina were included.
Alternatively, if NCs and SZs have the same number of CB-expressing cells in the CMN, the present results would suggest that CB expression is up-regulated in SZ. The calcium binding proteins including PV and CB participate in the transport and buffering of Ca2+ in addition to regulation of various enzyme systems (Heizmann 1992). Several lines of evidence suggest that altered Ca2+ signaling and/or homeostasis is central to the pathology of SZ (Lidow 2003). The increase in CB gene expression observed in this study, therefore, may reflect a compensatory response to SZ-associated disregulation of Ca2+ homeostasis in the CMN.
As in most postmortem studies of SZ, the majority of specimens in the present study came from subjects who received neuroleptics for many years up until or close to the time of death. It is, therefore, possible that our observation in the CMN is due to neuroleptic exposure rather than to SZ, per se. Work done in both, animals (Cohen et al. 2003) and humans (Kemether et al. 2003) suggests that the CMN responds to neuroleptics, but how this response might influence CB expression is not clear. In a large imaging study that included both medicated and medication-naïve SZs, CMN volume was decreased in SZs relative to controls; however, within SZs the volume was increased among those with a history of neuroleptic exposure (Kemether et al. 2003).
4.2. Sex Differences in Expression of MAG and CNP but not MAG
In a previous study of cortical gene expression we suggested that the expression of CNP and MAG is coregulated whereas the expression of MBP is governed by different transcriptional regulators (Dracheva et al. 2006). The findings of the present study are consistent with that interpretation. Specifically, in all thalamic regions examined CNP and MAG expression were highly correlated. On the other hand, MBP was never correlated with CNP and was correlated with MAG in only one thalamic division. Compared to males, the expression of CNP and MAG was higher in females across all thalamic divisions in the absence of a sex difference in MBP expression. The fact that MAG and CNP but not MBP, in addition to being correlated, also vary by sex suggests that the transcriptional regulation of CNP and MAG, but not MBP is influenced by sex.
Work done in rats suggests that oligodendrocytes turnover more rapidly in females than in males in all regions of the CNS examined (corpus callossum, fornix, spinal cord) and that this difference is due to androgens slowing turnover (Cerghet et al. 2006). Our present findings might, therefore, reflect increased turnover of oligodendrocytes in women. The sex differences we observed in the expression of oligodendrocyte genes may have bearing on women's increased susceptibility to particular demyelinating diseases as well as their less favorable responses to therapeutic interventions for these disorders (Voskuhl 2002;Keegan et al. 2002). In addition sex differences in oligodendrocyte functions, including myelination, could play a role in the sex differences that have been well documented in schizophrenia including differences in age at onset, symptom profiles, clinical course and neuroleptic responsiveness (Seeman 2000). In this regard, it is of note that we have previously described a diagnosis by sex interaction for the anterior principal thalamic nucleus (not examined in the present study) such that oligodendrocyte number was decreased relative to controls to a much greater extent in male than in female SZs.
4.3. Between nucleus differences
Consistent with their different functional roles, the various divisions of the thalamus exhibited different patterns of gene expression. The trend for higher expression of GABAergic markers in the MDN compared to the other nuclei may suggest the presence of more GABAergic interneurons in this associational nucleus as opposed to the more laterally situated motor (DP) and sensory relay nuclei (VP) and the CMN which plays a role in motor functions and nonspecific cortical activation (Kemether et al. 2003;McLardy 1984). Whether or not GABAergic marker expression means more interneurons, it means more inhibitory tone. Increased GABAergic marker expression may, therefore, reflect the need for fine tuned regulation of the higher order cognitive functions subserved by the MDN.
Given that the thalamus has been implicated in SZ by multiple modalities of research, the absence of more SZ-associated differences in the present study may seem surprising. Although some of the genes we examined have been reported to exhibit SZ-associated differences in expression in thalamus (Smith et al. 2001) or other brain regions e.g. (Chance et al. 2005;Hakak et al. 2001;Torrey et al. 2005;Hashimoto et al. 2003;Akbarian and Huang 2006;Dracheva et al. 2004;Heckers et al. 2002;Volk et al. 2000;Eastwood and Harrison 2005;Dracheva et al. 2006;Tkachev et al. 2003), previous studies in the thalamus did not employ rigorously quantitative methods such as qPCR and did not combine qPCR with detailed exacting anatomical dissections. The modest disease associated findings in the current study does not diminish the potential for thalamic involvement in SZ, however. Several functional imaging studies suggest metabolic dysregulation in the thalamus. Those differences are probably paralleled by alterations of gene expression; however, the expression of metabolic genes is likely to be very sensitive to the variations in physiological state associated with mode of death and postmortem tissue conditions. Thus, reliable assessment of those genes would require large sample sizes. For the present study, we, therefore, chose to assess cell-type specific genes. Neuronal and oligodendrocyte deficits have been described by stereological studies of the thalamus (Young et al. 2000;Byne et al. 2006;Popken et al. 2000;Pakkenberg and Gundersen 1988;Pakkenberg 1990). In general, cell densities tended to be lower in SZs in most studies including our own, only differences in numbers, not densities, were statistically significant. If the NCs and SZs have the same number of cells per unit volume, one would not necessarily expect to see differences in normalized gene expression. Moreover, small deficits in cell density could be off set by compensatory upregulation of gene expression in the remaining cells. This possibility will be addressed in future studies that examine correlations between gene expression and cell counts done in adjacent tissue sections from the same samples as well as in studies that examine gene expression in homogeneous pools of individually microdissected cells. In a recent study (Byne et al. 2006) we found a reduction of the oligodendrocyte to neuron ratio in the anterior principle nucleus of the thalamus. That nucleus was not examined in the present study because very little of it was present at the thalamic level we examined. Other studies have implicated aspects of the glutamatergic system in SZ that were not directly assessed in the current study (Clinton et al. 2006;Huerta et al. 2006;Bruneau et al. 2005). The expression of these genes within the thalamus will also be addressed in future studies.
Acknowledgments
Support: Supported by MH064673 (VH), MH066392 (KLD), Veterans Administration MIRECC and Merit Reviews (VH, SD, and WB).
Footnotes
Publisher's Disclaimer: This is a PDF file of an unedited manuscript that has been accepted for publication. As a service to our customers we are providing this early version of the manuscript. The manuscript will undergo copyediting, typesetting, and review of the resulting proof before it is published in its final citable form. Please note that during the production process errors may be discovered which could affect the content, and all legal disclaimers that apply to the journal pertain.
Reference List
- Akbarian S, Huang HS. Molecular and cellular mechanisms of altered GAD1/GAD67 expression in schizophrenia and related disorders. Brain Res Rev. 2006;52:293–304. doi: 10.1016/j.brainresrev.2006.04.001. [DOI] [PubMed] [Google Scholar]
- Baumann N, Pham-Dinh D. Biology of oligodendrocyte and myelin in the mammalian central nervous system. Physiol Rev. 2001;81:871–927. doi: 10.1152/physrev.2001.81.2.871. [DOI] [PubMed] [Google Scholar]
- Benes FM, McSparren J, Bird ED, SanGiovanni JP, Vincent SL. Deficits in small interneurons in prefrontal and cingulate cortices of schizophrenic and schizoaffective patients. Arch Gen Psychiatry. 1991;48:996–1001. doi: 10.1001/archpsyc.1991.01810350036005. [DOI] [PubMed] [Google Scholar]
- Bleier R. Retrograde transsynaptic cellular degeneration in mammillary and ventral tegmental nuclei following limbic decortication in rabbits of various ages. Brain Res. 1969;15:365–393. doi: 10.1016/0006-8993(69)90162-0. [DOI] [PubMed] [Google Scholar]
- Bruneau EG, McCullumsmith RE, Haroutunian V, Davis KL, Meador-Woodruff JH. Increased Expression of Glutaminase and Glutamine Synthetase mRNA in the Thalamus in Schizophrenia. Schizophrenia Res. 2005;75:27–34. doi: 10.1016/j.schres.2004.12.012. [DOI] [PubMed] [Google Scholar]
- Buchsbaum M, Someya T, Teng C, Abel L, Chin S, Najafi A, Haier R, Wu J, Bunney W. PET and MRI of the Thalamus in Never-Medicated Patients with Schizophrenia. Am J Psychiatry. 1996;153:191–199. doi: 10.1176/ajp.153.2.191. [DOI] [PubMed] [Google Scholar]
- Byne W, Buchsbaum MS, Kemether E, Hazlett EA, Shinwari A, Mitropoulou V, Siever LJ. Magnetic resonance imaging of the thalamic mediodorsal nucleus and pulvinar in schizophrenia and schizotypal personality disorder. Arch Gen Psychiatry. 2001;58:133–40. doi: 10.1001/archpsyc.58.2.133. [DOI] [PubMed] [Google Scholar]
- Byne W, Stamu C, White L, Parrella M, Harvey PD, Davis KL. Prevalence and correlates of parkinsonism in an institutionalized population of geriatric patients with chronic schizophrenia. Int J Geriatr Psychiatry. 2000;15:7–13. doi: 10.1002/(sici)1099-1166(200001)15:1<7::aid-gps69>3.0.co;2-z. [DOI] [PubMed] [Google Scholar]
- Byne W, Tatusov A, Kidkarndee S, Yiannoulos G, Haroutunian V. Schizophrenia-associated reduction of oligodendrocytes in anterior thalamic nucleus. Schizo Res. 2006;85:245–253. doi: 10.1016/j.schres.2006.03.029. [DOI] [PubMed] [Google Scholar]
- Cerghet M, Skoff RP, Bessert D, Zhang Z, Mullins C, Ghandour MS. Proliferation and death of oligodendrocytes and myelin proteins are differentially regulated in male and female rodents. J Neurosci. 2006;26:1439–1447. doi: 10.1523/JNEUROSCI.2219-05.2006. [DOI] [PMC free article] [PubMed] [Google Scholar]
- Chance SA, Walker M, Crow TJ. Reduced density of calbindin-immunoreactive interneurons in the planum temporale in schizophrenia. Brain Res. 2005;1046:32–37. doi: 10.1016/j.brainres.2005.03.045. [DOI] [PubMed] [Google Scholar]
- Clinton SM, Haroutunian V, Meador-Woodruff JH. Up-regulation of NMDA receptor subunit and post-synaptic density protein expression in the thalamus of elderly patients with schizophrenia. J Neurochem. 2006 Jun 6;98:1114–1125. doi: 10.1111/j.1471-4159.2006.03954.x. 2006. [DOI] [PubMed] [Google Scholar]
- Cohen BM, Cherkerzian S, Ma J, Ye N, Wager C, Lange N. Cells in midline thalamus, central amygdala, and nucleus accumbens responding specifically to antipsychotic drugs. Psychopharmacology (Berl) 2003;167:403–410. doi: 10.1007/s00213-003-1423-0. [DOI] [PubMed] [Google Scholar]
- Cullen TJ, Walker MA, Parkinson N, Craven R, Crow TJ, Esiri MM, Harrison PJ. A postmortem study of the mediodorsal nucleus of the thalamus in schizophrenia. Schizophr Res. 2003;60:157–66. doi: 10.1016/s0920-9964(02)00297-9. [DOI] [PubMed] [Google Scholar]
- Danos P, Baumann B, Bernstein HG, Franz M, Stauch R, Northoff G, Krell D, Falkai P, Bogerts B. Schizophrenia and anteroventral thalamic nucleus: selective decrease of parvalbumin-immunoreactive thalamocortical projection neurons. Psychiatry Res. 1998;82:1–10. doi: 10.1016/s0925-4927(97)00071-1. [DOI] [PubMed] [Google Scholar]
- Danos P, Baumann B, Bernstein HG, Stauch R, Krell D, Falkai P, Bogerts B. The ventral lateral posterior nucleus of the thalamus in schizophrenia: a post-mortem study. Psychiatry Res. 2002;114:1–9. doi: 10.1016/s0925-4927(01)00131-7. [DOI] [PubMed] [Google Scholar]
- Danos P, Baumann B, Kramer A, Bernstein HG, Stauch R, Krell D, Falkai P, Bogerts B. Volumes of association thalamic nuclei in schizophrenia: a postmortem study. Schizophr Res. 2003;60:141–55. doi: 10.1016/s0920-9964(02)00307-9. [DOI] [PubMed] [Google Scholar]
- Dewulf A. Anatomy of the Normal Human Thalamus Topometry and Standardized Nomenclature. 1971:VII–196. [Google Scholar]
- Dorph-Petersen KA, Pierri JN, Sun Z, Sampson AR, Lewis DA. Stereological analysis of the mediodorsal thalamic nucleus in schizophrenia: volume, neuron number, and cell types. J Comp Neurol. 2004;472:449–462. doi: 10.1002/cne.20055. [DOI] [PubMed] [Google Scholar]
- Dracheva S, Davis KL, Chin B, Woo DA, Schmeidler J, Haroutunian V. Myelin-associated mRNA and protein expression deficits in the anterior cingulate cortex and hippocampus in schizophrenia. Neurobiology of Disease. 2006;79:157–173. doi: 10.1016/j.nbd.2005.08.012. [DOI] [PubMed] [Google Scholar]
- Dracheva S, Elhakem SL, McGurk SR, Davis KL, Haroutunian V. GAD67 and GAD65 mRNA and protein expression in cerebrocortical regions of elderly patients with schizophrenia. J Neurosci Res. 2004;76:581–92. doi: 10.1002/jnr.20122. [DOI] [PubMed] [Google Scholar]
- Dracheva S, McGurk SR, Haroutunian V. mRNA expression of AMPA receptors and AMPA receptor binding proteins in the cerebral cortex of elderly schizophrenics. Journal of Neuroscience Research. 2005;79:868–878. doi: 10.1002/jnr.20423. [DOI] [PubMed] [Google Scholar]
- Eastwood SL, Harrison PJ. Decreased expression of vesicular glutamate transporter 1 and complexin II mRNAs in schizophrenia: further evidence for a synaptic pathology affecting glutamate neurons. Schizophr Res. 2005;73:159–172. doi: 10.1016/j.schres.2004.05.010. [DOI] [PubMed] [Google Scholar]
- Fremeau RT, Jr., Voglmaier S, Seal RP, Edwards RH. VGLUTs define subsets of excitatory neurons and suggest novel roles for glutamate. Trends Neurosci. 2004;27:98–103. doi: 10.1016/j.tins.2003.11.005. [DOI] [PubMed] [Google Scholar]
- Gilbert AR, Rosenberg DR, Harenski K, Spencer S, Sweeney JA, Keshavan MS. Thalamic volumes in patients with first-episode schizophrenia. Am J Psychiatry. 2001;158:618–24. doi: 10.1176/appi.ajp.158.4.618. [DOI] [PubMed] [Google Scholar]
- Goldman-Rakic PS, Porrino LJ. The primate mediodorsal nucleus and its projections to the frontal lobe. Journal of Comparative Neurology. 1985;242:535–560. doi: 10.1002/cne.902420406. [DOI] [PubMed] [Google Scholar]
- Gur RE, Cowell PE, Latshaw A, Turetsky BI, Grossman RI, Arnold SE, Bilker WB, Gur RC. Reduced dorsal and orbital prefrontal gray matter volumes in schizophrenia. Arch Gen Psychiatry. 2000;57:761–8. doi: 10.1001/archpsyc.57.8.761. [DOI] [PubMed] [Google Scholar]
- Hakak Y, Walker JR, Li C, Wong WH, Davis KL, Buxbaum JD, Haroutunian V, Fienberg AA. Genome-wide expression analysis reveals dysregulation of myelination-related genes in chronic schizophrenia. Proc Natl Acad Sci U S A. 2001;98:4746–51. doi: 10.1073/pnas.081071198. [DOI] [PMC free article] [PubMed] [Google Scholar]
- Haroutunian V, Katsel P, Dracheva S, Davis KL. The Human Homolog of QKI Gene Affected in the Severe Dysmyelination ”Quaking” Mouse Phenotype is Downregulated in Multiple Brain Regions in Schizophrenia. Am J Psychiat. 2006;163:1834–1837. doi: 10.1176/ajp.2006.163.10.1834. [DOI] [PubMed] [Google Scholar]
- Hashimoto T, Volk DW, Eggan SM, Mirnics K, Pierri JN, Sun Z, Sampson AR, Lewis DA. Gene expression deficits in a subclass of GABA neurons in the prefrontal cortex of subjects with schizophrenia. J Neurosci. 2003;23:6315–26. doi: 10.1523/JNEUROSCI.23-15-06315.2003. [DOI] [PMC free article] [PubMed] [Google Scholar]
- Hazlett EA, Buchsbaum MS, Kemether E, Bloom R, Platholi J, Brickman AM, Shihabuddin L, Tang C, Byne W. Abnormal glucose metabolism in the mediodorsal nucleus of the thalamus in schizophrenia. Am J Psychiatry. 2004;161:305–14. doi: 10.1176/appi.ajp.161.2.305. [DOI] [PubMed] [Google Scholar]
- Haznedar MM, Buchsbaum MS, Hazlett EA, Shihabuddin L, New A, Siever LJ. Cingulate gyrus volume and metabolism in the schizophrenia spectrum. Schizophr Res. 2004;71:249–262. doi: 10.1016/j.schres.2004.02.025. [DOI] [PubMed] [Google Scholar]
- Heckers S, Curran T, Goff D, Rauch SL, Fischman AJ, Alpert NM, Schacter DL. Abnormalities in the thalamus and prefrontal cortex during episodic object recognition in schizophrenia. Biol Psychiatry. 2000;48:651–657. doi: 10.1016/s0006-3223(00)00919-7. [DOI] [PubMed] [Google Scholar]
- Heckers S, Stone D, Walsh J, Shick J, Koul P, Benes FM. Differential hippocampal expression of glutamic acid decarboxylase 65 and 67 messenger RNA in bipolar disorder and schizophrenia. Arch Gen Psychiatry. 2002;59:521–9. doi: 10.1001/archpsyc.59.6.521. [DOI] [PubMed] [Google Scholar]
- Heizmann CW. Calcium-binding proteins: basic concepts and clinical implications. Gen Physiol Biophys. 1992;11:411–425. [PubMed] [Google Scholar]
- Highley JR, Walker MA, Crow TJ, Esiri MM, Harrison PJ. Low medial and lateral right pulvinar volumes in schizophrenia: a postmortem study. Am J Psychiatry. 2003;160:1177–9. doi: 10.1176/appi.ajp.160.6.1177. [DOI] [PubMed] [Google Scholar]
- Huerta I, McCullumsmith RE, Haroutunian V, Gimenez-Amaya JM, Meador-Woodruff JH. Expression of Excitatory Amino Acid Transporter Interacting Protein Transcripts in the Thalamus in Schizophrenia. Synapse. 2006;59:394–402. doi: 10.1002/syn.20250. [DOI] [PubMed] [Google Scholar]
- Jones EG. A new view of specific and nonspecific thalamocortical connections. Adv Neurol. 1998;77:49–71. discussion 72−3., 49−71. [PubMed] [Google Scholar]
- Keegan M, Pineda AA, McClelland RL, Darby CH, Rodriguez M, Weinshenker BG. Plasma exchange for severe attacks of CNS demyelination: predictors of response. Neurology. 2002;58:143–146. doi: 10.1212/wnl.58.1.143. [DOI] [PubMed] [Google Scholar]
- Kemether EM, Buchsbaum MS, Byne W, Hazlett EA, Haznedar M, Brickman AM, Platholi J, Bloom R. Magnetic resonance imaging of mediodorsal, pulvinar, and centromedian nuclei of the thalamus in patients with schizophrenia. Arch Gen Psychiatry. 2003;60:983–91. doi: 10.1001/archpsyc.60.9.983. [DOI] [PubMed] [Google Scholar]
- Lehrer DS, Christian BT, Mantil J, Murray A, Buchsbaum BR, Oakes TR, Byne W, Buchsbaum MS. Thalamic and prefrontal FDG uptake in never-medicated patients with schizophrenia. Am J Psychiat. 2005;162:931–938. doi: 10.1176/appi.ajp.162.5.931. [DOI] [PubMed] [Google Scholar]
- Lewis DA, Cruz DA, Melchitzky DS, Pierri JN. Lamina-specific deficits in parvalbumin-immunoreactive varicosities in the prefrontal cortex of subjects with schizophrenia: evidence for fewer projections from the thalamus. Am J Psychiatry. 2001;158:1411–1422. doi: 10.1176/appi.ajp.158.9.1411. [DOI] [PubMed] [Google Scholar]
- Lidow MS. Calcium signaling dysfunction in schizophrenia: a unifying approach. Brain Res Brain Res Rev. 2003;43:70–84. doi: 10.1016/s0165-0173(03)00203-0. [DOI] [PubMed] [Google Scholar]
- McLardy T. Thalamic attention circuitry normal and psychotic. Med Hypotheses. 1984;15:231–239. doi: 10.1016/0306-9877(84)90016-1. [DOI] [PubMed] [Google Scholar]
- Munkle MC, Waldvogel HJ, Faull RL. The distribution of calbindin, calretinin and parvalbumin immunoreactivity in the human thalamus. J Chem Neuroanat. 2000;19:155–173. doi: 10.1016/s0891-0618(00)00060-0. [DOI] [PubMed] [Google Scholar]
- Myers JL. Fundamentals of experimental design. 2. Allyn and Bacon; Boston: 1972. [Google Scholar]
- Pakkenberg B. Pronounced reduction of total neuron number in mediodorsal thalamic nucleus and nucleus accumbens in schizophrenics. Arch Gen Psychiatry. 1990;47:1023–1028. doi: 10.1001/archpsyc.1990.01810230039007. [DOI] [PubMed] [Google Scholar]
- Pakkenberg B. The volume of the mediodorsal thalamic nucleus in treated and untreated schizophrenics. Schizophr Res. 1992;7:95–100. doi: 10.1016/0920-9964(92)90038-7. [DOI] [PubMed] [Google Scholar]
- Pakkenberg B, Gundersen H. Total number of neurons and glial cells in human brain nuclei estimatd by the disector and the fractionator. Journal of Microscopy. 1988;150:1–20. doi: 10.1111/j.1365-2818.1988.tb04582.x. [DOI] [PubMed] [Google Scholar]
- Popken GJ, Bunney WE, Jr., Potkin SG, Jones EG. Subnucleus-specific loss of neurons in medial thalamus of schizophrenics. Proc Natl Acad Sci U S A. 2000;97:9276–80. doi: 10.1073/pnas.150243397. [DOI] [PMC free article] [PubMed] [Google Scholar]
- Purohit DP, Perl DP, Haroutunian V, Powchik P, Davidson M, Davis KL. Alzheimer disease and related neurodegenerative diseases in elderly patients with schizophrenia: a postmortem neuropathologic study of 100 cases. Arch Gen Psychiatry. 1998;55:205–11. doi: 10.1001/archpsyc.55.3.205. [DOI] [PubMed] [Google Scholar]
- Seeman MV. Women and schizophrenia. Medscape Womens Health. 2000;5:2. [PubMed] [Google Scholar]
- Selemon LD, Rajkowska G, Goldman-Rakic PS. Abnormally high neuronal density in the schizophrenic cortex. A morphometric analysis of prefrontal area 9 and occipital area 17. Arch Gen Psychiatry. 1995;52:805–18. doi: 10.1001/archpsyc.1995.03950220015005. [DOI] [PubMed] [Google Scholar]
- Selemon LD, Rajkowska G, Goldman-Rakic PS. Elevated neuronal density in prefrontal area 46 in brains from schizophrenic patients: application of a three-dimensional, stereologic counting method. J Comp Neurol. 1998;392:402–12. [PubMed] [Google Scholar]
- Smith RE, Haroutunian V, Davis KL, Meador-Woodruff JH. Expression of excitatory amino acid transporter transcripts in the thalamus of subjects with schizophrenia. Am J Psychiatry. 2001;158:1393–9. doi: 10.1176/appi.ajp.158.9.1393. [DOI] [PubMed] [Google Scholar]
- Spreafico R, Schmechel DE, Ellis LC, Jr., Rustioni A. Cortical relay neurons and interneurons in the N. ventralis posterolateralis of cats: a horseradish peroxidase, electron-microscopic, Golgi and immunocytochemical study. Neuroscience. 1983;9:491–509. doi: 10.1016/0306-4522(83)90168-9. [DOI] [PubMed] [Google Scholar]
- Stark AK, Uylings HB, Sanz-Arigita E, Pakkenberg B. Glial cell loss in the anterior cingulate cortex, a subregion of the prefrontal cortex, in subjects with schizophrenia. Am J Psychiatry. 2004;161:882–8. doi: 10.1176/appi.ajp.161.5.882. [DOI] [PubMed] [Google Scholar]
- Tkachev D, Mimmack ML, Ryan MM, Wayland M, Freeman T, Jones PB, Starkey M, Webster MJ, Yolken RH, Bahn S. Oligodendrocyte dysfunction in schizophrenia and bipolar disorder. Lancet. 2003;362:798–805. doi: 10.1016/S0140-6736(03)14289-4. [DOI] [PubMed] [Google Scholar]
- Torrey EF, Barci BM, Webster MJ, Bartko JJ, Meador-Woodruff JH, Knable MB. Neurochemical markers for schizophrenia, bipolar disorder, and major depression in postmortem brains. Biol Psychiatry. 2005;57:252–260. doi: 10.1016/j.biopsych.2004.10.019. [DOI] [PubMed] [Google Scholar]
- Vandesompele J, De Preter K, Pattyn F, Poppe B, Van Roy N, De Paepe A, Speleman F. Accurate normalization of real-time quantitative RT-PCR data by geometric averaging of multiple internal control genes. Genome Biol. 2002;3:RESEARCH0034. doi: 10.1186/gb-2002-3-7-research0034. [DOI] [PMC free article] [PubMed] [Google Scholar]
- Volk DW, Austin MC, Pierri JN, Sampson AR, Lewis DA. Decreased glutamic acid decarboxylase67 messenger RNA expression in a subset of prefrontal cortical gamma-aminobutyric acid neurons in subjects with schizophrenia. Arch Gen Psychiatry. 2000;57:237–245. doi: 10.1001/archpsyc.57.3.237. [DOI] [PubMed] [Google Scholar]
- Voskuhl RR. Gender issues and multiple sclerosis. Curr Neurol Neurosci Rep. 2002;2:277–286. doi: 10.1007/s11910-002-0087-1. [DOI] [PubMed] [Google Scholar]
- Young KA, Holcomb LA, Yazdani U, Hicks PB, German DC. Elevated neuron number in the limbic thalamus in major depression. Am J Psychiatry. 2004;161:1270–1277. doi: 10.1176/appi.ajp.161.7.1270. [DOI] [PubMed] [Google Scholar]
- Young KA, Manaye KF, Liang C, Hicks PB, German DC. Reduced number of mediodorsal and anterior thalamic neurons in schizophrenia. Biol Psychiatry. 2000;47:944–953. doi: 10.1016/s0006-3223(00)00826-x. [DOI] [PubMed] [Google Scholar]