

Summary
Anti-predator behaviour is vital for most animals, and calls for accurate timing and swift motion. While fast reaction times [1] and predictable, context-dependent, escape initiation distances [2] are common features of most escape systems, previous work has highlighted the need for unpredictability in escape directions, in order to prevent predators from learning a repeated, fixed pattern [3–5]. Ultimate unpredictability would result from random escape trajectories. Although this strategy would deny any predictive power to the predator, it would also result in some escape trajectories towards the threat. Previous work has shown that escape trajectories are in fact generally directed away from the threat, although with a high variability [5–8]. However, the rules governing this variability are largely unknown. Here, we demonstrate tha t individual cockroaches (Periplaneta americana, a much studied model prey species [9–14]) keep each escape unpredictable by running along one of a set of preferred trajectories at fixed angles from the direction of the threatening stimulus. These results provide a new paradigm for understanding the behavio ural strategies for escape responses, underscoring the need to revisit the neural mechanisms controlling escape directions in the cockroach and similar animal models, and the evolutionary forces driving unpredictable, or “protean” [3], anti-predator behaviour.
Results and Discussion
When cockroaches (Periplaneta americana) encounter a sudden air movement, such as that generated by an approaching predator, they show an escape response using a large range of turning angles from their original body orientation [6, 10], in line with observations on animals from other taxa [7]. Here we test which of the following patterns of variability is observed in the trajectories of cockroach escape responses: (a) a wide unimodal distribution, (b) a random distribution, or (c) a multi–peak distribution of preferred escape trajectories.
The first series of experiments tested which of these three distribution patterns of escape trajectories occurs at the individual level. Five individual cockroaches (Periplaneta americana) were startled 75–93 times each by using a wind stimulus and their escape responses were video-recorded (see Supplemental Experimental Procedures). Wind stimuli were delivered from a variety of directions, resulting in even distributions of wind angle (defined as the angle between the direction of the wind stimulus and the orientation of the cockroach one frame before their escape response; Fig. 1A) (see Experimental Procedures). Responses to left and right stimuli were pooled as if all stimuli were from the right, i.e. all wind angles were between 0–180°. Cockroaches reacted to the wind stimulus by turning, followed by forward motion. Escape trajectories (ETs) were calculated as the angle between wind direction and the direction of motion of the cockroach at the end of the turning component of the escape response (Fig. 1A,B) and were treated as a circular variable [see Experimental Procedures, [15]]. While previous work [e.g. [6, 10]] was commonly analyzed using x-y linear plots of body turn against wind angle, this representation of the data reflects the assumption that the cockroach’s escape is a ‘hard-wired’, reflexive body turn that is directly related to the wind angle it detects. However, this type of analysis does not allow a direct test of the hypothesis that cockroaches may escape at fixed directions relative to the stimulus, in contrast to a circular analysis which does.
Fig. 1. Individual cockroaches tested in repeated trials show similar, striking multimodal distributions of ETs.

(A) Diagram of the sequence of movements in a typical cockroach escape response. The cockroach is walking from the left to the right of the picture. Grey arrow indicates stimulus direction. Wind angle (wind) at the time of stimulation, body turn (turn) and escape trajectory (ET) are shown. (B) Diagram illustrating the definition of escape trajectory (ET) and the way it is plotted in all subsequent figures. Escape trajectory (continuous arc) is defined as the angle between wind direction (grey arrow) and the direction of motion (black arrow) of the escaping cockroach (black cockroach). Left and right stimuli were pooled as if each stimulus was always on the right side of the animal. C, D, E, F, G show the frequency distributions of five individual cockroaches tested in repeated trials. Numbers of responses are 93 (C), 93 (D), 89 (E), 81 (F), 75 (G). The asterisk in C represents the trajectory of the escape response drawn in B. Best- fit distributions in C, D, E, F, G are shown as multimodal curves. The statistics for the fitted curves are (C): Akaike weight = 0.91, χ2 =14.77, P=0.254, d.f. = 12; (D): Akaike weight = 0.93, χ2 =19.87, P=0.099, d.f.=13; (E): Akaike weight = 0.85, χ2 =8.98, P=0.623, d.f.=11; (F): Akaike weight = 0.51, χ2 =10.48, P=0.399, d.f. = 10; (G): Akaike weight = 0.67, χ2 =4.76, P=0.854, d.f.=9. For all panels, concentric circles represent a frequency interval of 2, bin intervals are 5°, arrowheads indicate peaks, defined as those that contribute at least 5% to the best- fit curve.
Despite some small individual variation, the ET distributions of each animal are multimodal, with at least four peaks at approximately 90°, 120°, 150° and 180°, suggesting that cockroaches do indeed have preferred ETs (Fig. 1C–G). The distributions of these ETs are not significantly different among individuals (χ2 = 27.75; P>0.1; d.f.=20; Fig. 1). To determine quantitatively the angular position and the number of ET peaks, mixtures of multiple Gaussian curves were fitted to the unbinned data using a maximum likelihood method (see Supplemental Experimental Procedures), using the constraints of equally-spaced peaks with equal widths in order to minimize the number of parameters.
In four out of five cases (Figs. 1C, D, E, G), four ET peaks were detected in the approximate range 90–180° (Akaike weights 0.67 – 0.93, χ2 test comparing the theoretical and the experimental distributions show no significant differences with P ranging from 0.10 – 0.85). In a fifth case (Fig. 1F), the four observable peaks for this individual appear similar, in terms of their angular positions, to the other individuals and the distributions are not different statistically. However, the peaks in Fig. 1F are less well defined, and, although a multi-peak fit has a higher likelihood, it is rejected as too complex using the more parsimonious corrected Akaike Information Criterion (AICc). Overall, the fact that almost identical peaks can be detected independently in 4 out of 5 separate animals provides very convincing evidence for the existence of a multiple-ET escape strategy.
Because the distributions of the ETs are not significantly different, all the data were pooled as a single data-set (“5i”: Fig. 2A). The pooled data are significantly different from a uniform distribution both within 360° [15] (U2 test; P<0.005; n=431) and within an arc containing 99% of the data (see Supplemental Experimental Procedures) (χ2 = 243.10; P<0.001; d.f.=15), and differ from a von Mises distribution (normal circular) (U2 test; P <0.005; n=431). The best-fit curve with the maximum likelihood method is a multi-peak curve with peaks at 96.9°, 123.6°, 150.3°, and 177.0°.
Fig. 2. The ET distribution of 5 individuals tested in repeated trials and 86 singletons tested each once only are not significantly different from each other.
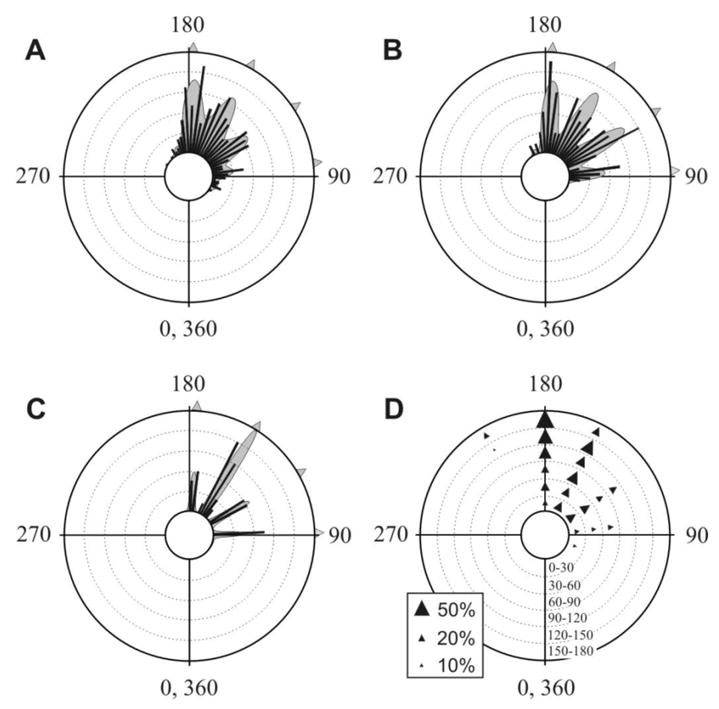
(A) Frequency histograms of data set 5i (pooling 5 individuals from Fig. 1). Total number of responses = 431, concentric circles represent a frequency of 10. Bin intervals are 5°. The best- fit curve Akaike weight >0.99, χ2 =23.71, P=0.536, d.f.=25. (B) Frequency histograms of singletons. Total number of responses = 86, concentric circles represent a frequency of 2. Bin interva ls are 5°. The best- fit curve Akaike weight = 0.74, χ2 =5.48, P=0.906, d.f. = 11. (C) The distribution of wind angles in escape responses (data-set 5i) that showed little or no body turns (0–10°; number of responses =38). Concentric circles represent a frequency of 2. Bin intervals are 5°. The wind angles show 4 peaks as in the preferred ETs found in A and B; see text for details. The best- fit curve Akaike weight = 0.83, χ2 = 0.38, P=0.943, d.f.=3. For all panels, best- fit distributions are shown as multimodal curves and arrowheads indicate peaks, defined as those that contribute at least 5% to the best fit curve. (D) The effect of wind direction on ETs. Diagrammatic representation of the effect of wind angle on ET probability for the five individuals (data set 5i). Stimulus wind angle is indicated by the radial scale. The different ET peaks determined above for the 5i data are indicated by arrowheads at the appropriate angular positions, with the width of the arrowhead indicating the percentage contribution of that particular peak to the ET distribution at that particular wind angle. For scale, arrowheads are shown corresponding to 10%, 20% and 50% contributions (inset). Peaks with a contribution of less than 5% are not shown. As wind angles increase, the lower value ET peaks disappear and a larger 204° peak appears.
To determine whether the individual patterns observed above are representative of the variability in the population as a whole, we carried out a second series of experiments, in which 86 individuals were used, each startled only once (“singletons”: Fig. 2B). Again, the wind angles used were uniformly distributed (see Supplemental Experimental Procedures). The ET distribution of singletons (Fig. 2B) and that of the 5i data-set (Fig. 2A) are not significantly different from each other (χ2 = 5.25; P>0.25; d.f.=5; Fig. 2). The singleton data differ from a uniform distribution both within 360° (U2 test; P<0.005; n=86) and within an arc containing 99% of the data (see Supplemental Experimental Procedures) (χ2 = 29.49; P<0.005; d.f.=11). Like the 5i data-set, the singleton data differ from a von Mises distribution (U2 test; P <0.025; n=86) and are also best fitted by a curve with peaks similar to those of the 5i data-set, i.e. 93.3°, 120.8°, 148.4°, and 175.9° (Fig. 2B). These results show that preferred ETs are not by-products of different individual preferences within the population, but are a shared characteristic of all animals from our inbred colony.
Analysis of the distributions of body turn angles (within the range 0–120°, see Experimental Procedure) shows that they are uniformly distributed (singletons, χ2 = 7.07; P>0.5; d.f.=11; data set 5i, χ2 = 13.98; P>0.1; d.f.=11). Since the distribution of wind angles is also uniform, and ET is the sum of wind angle plus the body turn (see Fig. 1A), the multimodal ETs cannot be due to any constraints (mechanical or neural) that restrict the cockroach to performing turns only at certain fixed angles relative to its body. This is confirmed by the distribution of the wind angles that elicit negligible turning (0–10° body turn) (Fig. 2C). If cockroaches indeed prefer to escape along ETs at approximately 90°, 120°, 150° and 180° as we assert above, then these peaks should be found in the wind angles of escape responses in which cockroaches make little or no turning manoeuvre. Our results show that cockroaches escape approximately in line with their body direction only when stimulated at the predicted wind angles (91.7°, 119.7°, 147.7°, and 175.7°; Fig. 2C), i.e. when they are already positioned along one of their preferred ETs (comparison between distributions in Figs. 2A and 2C, χ2 = 2.80, P >0.5, d.f. = 4; comparison between distributions in Figs.2B and 2C; χ2 = 1.78, P >0.75, d.f.=4).
To investigate any effect of wind angle on escape trajectory, the 5i data-set was divided into escape responses elicited by six different 30° sectors of wind angle; the 0–30° sector includes the most frontal stimulations, while the 150–180° sector corresponds to the most posterior stimuli. The distributions of ETs divided into these six wind angle sectors are significantly different from each other (χ2=104.45, P<0.001; d.f. =20; Fig. 2D), showing that wind angle does have an effect on ET. The first 4 peaks present in Fig. 2A reappear here for small wind angles, i.e. <90° (wind directed towards the head). However, as wind angles increase, the lower peaks disappear and an upper peak (at 204°) appears so that, for wind directed at the rear of the animal, only 3 peaks are present (Fig. 2D). In other words, because most escape responses are a turn away from the stimulus [6], the angles of ETs are almost always larger than those of wind angle. As a consequence, small ETs are used only when cockroaches are stimulated at small wind angles, while larger ETs (e.g. 177°) are used at all wind angles. Accordingly, the peaks occur with different frequencies (χ2=65, P<0.001; d.f.=3; Fig. 2A).
Our pooled data from the five individuals (data-set 5i, Fig. 2A) were compared to data from previous studies [6, 10] of cockroach escape behaviour with high sample sizes, originally analyzed using linear x-y plots of body turn against wind angle, but re-analyzed here using circular statistics (see Supplemental Experimental Procedure). Our analyses show that the circular distributions of these previous data are non-uniform both within 360° (Fig 3A, U2 test; P<0.005, n=161; Fig 3B, U2 test; P<0.005, n=253) and within an arc containing 99% of the data (see Supplemental Experimental Procedure) (Fig 3A, χ2 = 87.36; P<0.001; d.f. = 28; Fig 3B, χ2 = 159.92; P<0.001; d.f.=27), and different from a von Mises distribution (Fig. 3A, U2 test; P<0.01, n=161; Fig 3B, U2 test; P<0.01, n=253). These data are also best fitted by curves with multiple, equally-spaced peaks of equal width, at 31°, 61°, 92°, 122°, 152°, 183° and 206° (Fig. 3A) and at 50°, 88°, 126°, 164° and 201° (Fig. 3B). Therefore, by reanalyzing these data as escape trajectories relative to the stimulus, the unpredictable, yet non-random, nature of this behaviour emerges. The multiple ET strategy provides an explanation for the wide range of body turns seen in x- y plots, which has to date been explained by postulating a large amount of random “noise” in the system [16].
Fig. 3. Re-analysis of cockroach escape-behavio ur data from the published literature reveals hitherto undetected patterns of ET distributions.
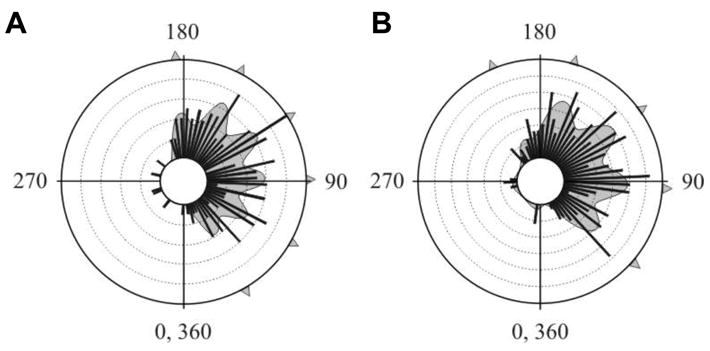
(A) Concentric circles represent a frequency of 2. Bin intervals are 5°. Number of responses=161. Based on published data [6]. Akaike weight 0.68, χ2 = 13.06, P=0.907, d.f.=21. (B) Concentric circles represent a frequency of 2.5. Bin intervals are 5°. Number of responses=253. Based on published data [10]. Akaike weight 0.76, χ2 = 27.19, P=0.709, d.f.=32. For both panels, the best-fit distribution is shown as a multimodal curve and arrowheads indicate peaks, defined as those that contribute at least 5% to the best-fit curve.
Comparison of the data obtained in the present study (Fig. 2A) with the previous studies [6, 10] (Fig. 3) shows that the distributions of multiple peaks of ETs are significantly different (comparison with Fig. 3A, χ2 = 136; d.f.=8; P<0.001; comparison with Fig. 3B, χ2 = 160.1; d.f.=9; P<0.001). However, all three distributions do show multiple peaks of ETs; it is possible that different ET peaks occur in cockroaches from different laboratory colonies. Variation in the distributions could also be due to methodological differences of the behavio ural experiment (size of arena, characteristics of the wind stimulus, walking vs. standing still etc). Some of the difference between our data and previous work can be ascribed to differences in wind angle; while in our study wind angles are uniformly distributed, in previous work [6, 10] they are non-uniform (see Supplemental Experimental Procedure) with a high proportion of stimulations towards the head. This would result in a higher proportion of ETs at smaller angles (see Fig. 2D), as observed in previous work [6, 10] compared to our own. Notably, most ETs observed in Figs. 2 and 3 are within the 90–180° sector, which corresponds to the theoretically optimum range [17, 18].
The finding that cockroaches show multiple, discrete, ETs has implications both in terms of the neural mechanisms which generate them and the resultant adaptive significance of multiple ETs. Adult cockroaches possess hundreds of wind-sensory hairs on their paired abdominal cerci which detect the direction of hair movements [6, 19–21]. The sensory neurons of these hairs input to giant interneurons (GIs) in the terminal ganglion, each with its own directional selectivity to wind [22]. A relatively small number of GIs convey this information to the thoracic ganglia which produce the body turns [22]. The angular resolution of the sensory system must have a limit; however, this will simply add to the width of the peaks in the ET distribution. A poor resolution of wind direction would thus tend to smooth out, rather than sharpen, ET peaks.
Our results suggest that ETs are generated by a geocentric mechanism, i.e. where the trajectories are fixed relative to an external reference (the stimulus), rather than by an egocentric mechanism where trajectories are generated relative to a body reference (i.e. by fixed body-turn angles). The neural mechanism for generating these multiple ETs is completely unknown, although it could involve the many thoracic interneurons that are interposed between the GIs and the motorneurons [23, 24], dorsal GIs, or even other wind-sensitive interneurons. Clearly, the finding of preferred ETs underscores the need to revisit the neural mechanisms controlling escape directions in the cockroach and other similar animal models. In addition, the experimental approach used here could be applied to animals from other taxa since high variability in escape directions is a common feature of many escape systems [3]. This would allow the construction of a more general theory of how animal generate unpredictable escape trajectories.
Independently of how the multiple ETs are generated, what matters in terms of adaptive significance is that the resultant escape behavio ur is sufficiently unpredictable [i.e. protean [3]] to predators that a selective advantage is achieved. It is unlikely that there is any particular fitness significance for any specific ET, i.e. escaping at 120° or 150°, but not at 135°. While each peak must emerge from the neuronal computation of the escape-behavio ur circuit, the evolutionary significance of the multiple ETs is likely to lie in the overall multimodal pattern, which allows an animal to generate the variability necessary to keep the predator ‘guessing’.
Experimental procedures
Experimental measurements
Animal keeping and the experimental apparatus are described in the Supplemental Experimental Procedures. Wind angles were measured with respect to the animal’s midline in the frame preceding the onset of the wind stimulus. All individuals were walking at the time of stimulation. Escapes from left and right stimuli were pooled as if the stimuli were always from the right; no asymmetries were present in the 5i data-set when this was divided into escapes that were stimulated from the left and right sides of the animals (χ2 =6.01; P >0.25; d.f.= 6; data not shown). Thus wind angle spanned 0–180°, where head-on stimulations were designated as 0° and stimulations directly from the rear corresponded to 180°. Escape trajectories (ETs) were defined as the angle between the direction of motion at the end of the turning component of the escape and the direction of the stimulus (Fig. 1A). ETs therefore correspond to the sum of the wind angle and the body turn by the cockroach (defined as the angle between the body’s midline before stimulation and its direction of motion at the end of the response), where body turns away from the stimulus bear a positive sign, and body turn towards the stimulus bear a negative sign. Therefore, ETs in a direction directly away from the stimulus were at 180°. ETs >180° indicated that animals had turned through a greater angle than was required to face directly away from the stimulus (see Fig. 1). ETs potentially spanned 360° and were treated as a circular variable [15].
Statistics
Goodness-of-fit tests against uniform and von Mises [normal circular [15]] distributions for ET data were carried out using U2 tests [15] using Oriana circular statistics software. χ2 tests were used to compare distributions [25] using data divided into bins. Wind angle data were divided into nine 20° bins (0–20°; 20–40° and so on). ETs data were divided into eighteen 20° bins, centred at 0°, 20°, 40° etc. Any bin with expected frequencies <5 was pooled with the adjacent bin until an expected frequency >5 was reached [25]. Uniformity of distribution in the body-turn angles was analysed in singletons and data-set 5i using χ2 tests. Body-turn data were divided into 10° bins. To avoid low frequencies at the tail end of the distribution, body-turn data were analysed within the range 0–120°, which comprised 86.8% of all turns for data-set 5i, and 96.25% for the singletons. Wind angle distribution and additional statistics are described in the Supplemental Experimental Procedures.
Supplementary Material
Acknowledgments
This study was supported by grants from the CNR – Italian National Research Council (to PD), a BBSRC Studentship (to DB), NIH-SCORE S06 GM0088224 and RCMI G12 RR03051 (to JMB), and a BBSRC grant (to JPB). We thank U. Muller, R. Blanco, C. Comer, D. Osorio and T. Collett for helpful comments.
Footnotes
Publisher's Disclaimer: This is a PDF file of an unedited manuscript that has been accepted for publication. As a service to our customers we are providing this early version of the manuscript. The manuscript will undergo copyediting, typesetting, and review of the resulting proof before it is published in its final citable form. Please note that during the production process errors may be discovered which could affect the content, and all legal disclaimers that apply to the journal pertain.
References
- 1.Bullock TH. Comparative neuroethology of startle, rapid escape and giant fiber-mediated responses. In: Eaton RC, editor. Neural Mechanisms of Startle Behaviour. New York: Plenum Press; 1984. pp. 1–13. [Google Scholar]
- 2.Ydenberg RC, Dill LM. The economics of fleeing from predators. Advances in the Study of Behaviour. 1986;16:229–249. [Google Scholar]
- 3.Humphries DA, Driver PM. Protean defence by prey animals. Oecologia. 1970;5:285–302. doi: 10.1007/BF00815496. [DOI] [PubMed] [Google Scholar]
- 4.Driver PM, Humphries DA. Protean Behaviour: The Biology of Unpredictability. Oxford: Clarendon; 1988. [Google Scholar]
- 5.Godin J-GJ. Evading predators. In: Godin J-GJ, editor. Behavioural Ecology of Teleost Fishes. Oxford: Oxford University Press; 1997. pp. 191–236. [Google Scholar]
- 6.Camhi JM, Tom W. The escape behaviour of the cockroach Periplaneta americana. 1. Turning response to wind puffs. J Comp Physiol A. 1978;128:193–201. [Google Scholar]
- 7.Eaton RC, Lavender WA, Wieland CM. Identification of Mauthner initiated response patterns in goldfish: evidence from simultaneous cinematography and electrophysiology. J comp Physiol A. 1981;144:521–531. [Google Scholar]
- 8.Domenici P, Blake RW. Escape trajectories in angelfish (Pterophyllum eimekei) J Exp Biol. 1993;177:253–272. [Google Scholar]
- 9.Camhi JM. Neuroethology: nerve cells and the natural behavior of animals. Sunderland: Sinauer; 1983. [Google Scholar]
- 10.Comer CM, Dowd JP. Escape turning behaviour of the cockroach. Changes in directionality induced by unilateral lesions of the abdominal nervous system. J Comp Physiol. 1987;160:571–583. [Google Scholar]
- 11.Ritzmann RE, Pollack AJ. Wind-activated thoracic interneurons of the cockroach: II. Patterns of connection from ventral giant interneurons. J Neurobiol. 1988;19:589–611. doi: 10.1002/neu.480190703. [DOI] [PubMed] [Google Scholar]
- 12.Stierle IE, Getman M, Comer CM. Multisensory control of escape in the cockroach Periplaneta Americana. 1. Initial evidence from patterns of wind-evoked behaviour. J Comp Physiol. 1994;174:1–11. [Google Scholar]
- 13.Stern M, Ediger VL, Gibbon CR, Blagburn JM, Bacon JP. Regeneration of cercal filiform hair sensory neurons in the first- instar cockroach restores escape behavior. J Neurobiol. 1997;33:439–458. [PubMed] [Google Scholar]
- 14.Rinberg D, Davidowitz H. Do cockroaches ‘know’ about ?uid dynamics? Nature. 2000;405:756. doi: 10.1038/35015677. [DOI] [PubMed] [Google Scholar]
- 15.Fisher NI. Statistical Analysis of Circular Data. Cambridge: Cambridge University Press; 1993. [Google Scholar]
- 16.Ezrachi EA. Computational model of the cockroach escape behavior: winner and losers in a population code. Biol Cybern. 2003;88:33–45. doi: 10.1007/s00422-002-0343-0. [DOI] [PubMed] [Google Scholar]
- 17.Weihs D, Webb PW. Optimal avoidance and evasion tactics in predator–prey interactions. J Theor Biol. 1984;106:189–206. [Google Scholar]
- 18.Domenici P. The visually- mediated escape response in fish: Predicting prey responsiveness and the locomotor behaviour of predators and prey. Mar Freshw Behav Physiol. 2002;35:87–110. [Google Scholar]
- 19.Westin J. Responses to wind recorded from the cercal nerve of the cockroach Periplaneta americana. I Response properties of single sensory neurons. J comp Physiol A. 1979;133:97–102. [Google Scholar]
- 20.Thompson KSJ, Blagburn JM, Gibbon CR, Bacon JP. Correlation of filiform hair position with sensory afferent morphology and synaptic connections in the second instar cockroach. J Comp Neurol. 1992;320:213–227. doi: 10.1002/cne.903200206. [DOI] [PubMed] [Google Scholar]
- 21.Kondoh Y, Arima T, Okuma J, Hasegawa Y. Filter characteristics of cercal afferents in the cockroach. J Comp Physiol [A] 1991;169:653–662. doi: 10.1007/BF00194894. [DOI] [PubMed] [Google Scholar]
- 22.Kolton L, Camhi JM. Cartesian representation of stimulus direction: parallel processing by two sets of giant interneurons in the cockroach. J Comp Physiol (A) 1995;176:691–702. [PubMed] [Google Scholar]
- 23.Westin J, Ritzmann RE, Goddard DJ. Wind-activated thoracic interneurons of the cockroach: I. Responses to controlled wind stimulation. J Neurobiol. 1988;19:573–588. doi: 10.1002/neu.480190702. [DOI] [PubMed] [Google Scholar]
- 24.Ritzmann RE, Pollack AJ. Parallel motor pathways from thoracic interneurons of the ventral giant interneuron system of the cockroach, Periplaneta americana. J Neurobiol. 1990;21:1219–1235. doi: 10.1002/neu.480210807. [DOI] [PubMed] [Google Scholar]
- 25.Batschelet E. Circular Statistics in Biology. New York: Academic Press; 1981. [Google Scholar]
Associated Data
This section collects any data citations, data availability statements, or supplementary materials included in this article.