

Abstract
T-type Ca2+ channels (TTCCs) are expressed in the developing heart, are not present in the adult ventricle, and are reexpressed in cardiac diseases involving cardiac dysfunction and premature, arrhythmogenic death. The goal of this study was to determine the functional role of increased Ca2+ influx through reexpressed TTCCs in the adult heart. A mouse line with cardiac-specific, conditional expression of the α1G-TTCC was used to increase Ca2+ influx through TTCCs. α1G hearts had mild increases in contractility but no cardiac histopathology or premature death. This contrasts with the pathological phenotype of a previously studied mouse with increased Ca2+ influx through the L-type Ca2+ channel (LTCC) secondary to overexpression of its β2a subunit. Although α1G and β2a myocytes had similar increases in Ca2+ influx, α1G myocytes had smaller increases in contraction magnitude, and, unlike β2a myocytes, there were no increases in sarcoplasmic reticulum Ca2+ loading. Ca2+ influx through TTCCs also did not induce normal sarcoplasmic reticulum Ca2+ release. α1G myocytes had changes in LTCC, SERCA2a, and phospholamban abundance, which appear to be adaptations that help maintain Ca2+ homeostasis. Immunostaining suggested that the majority of α1G-TTCCs were on the surface membrane. Osmotic shock, which selectively eliminates T-tubules, induced a greater reduction in L-versus TTCC currents. These studies suggest that T- and LTCCs are in different portions of the sarcolemma (surface membrane versus T-tubules) and that Ca2+ influx through these channels induce different effects on myocyte contractility and lead to distinct cardiac phenotypes.
Keywords: T-type Ca2+ channels, myocyte death, EC coupling
Ca2+ influx through voltage-regulated ion channels is essential for initiating and regulating cardiac function.1,2 Changes in cytosolic [Ca2+] also influence a variety of signaling pathways,3,4 regulate normal cardiac metabolism,5 and cause both physiological and pathological hypertrophy.6-9 The primary pathway for Ca2+ influx in the adult heart is via the L-type Ca2+ channel (LTCC). This Ca2+ influx pathway is essential for triggering sarcoplasmic reticulum (SR) Ca2+ release and is the major source of Ca2+ to load the SR.10 Excess Ca2+ influx through LTCCs has been linked to necrotic myocyte death, cardiac dysfunction, and premature death.11
Ca2+ can also enter cardiac myocytes through the voltage-operated T-type Ca2+ channel (TTCC). These channels are expressed throughout cardiac development until the end of the fetal/neonatal period.12-14 TTCC expression decreases soon after birth, with little or no expression in normal adult ventricular myocytes (VMs). TTCCs are reexpressed when the heart is subjected to pathological stressors that induce cardiac hypertrophy and failure15-19 and are associated with depressed cardiac function and sudden death.20 However, the functional significance of TTCC reexpression in adult VMs has not been established and is the focus of this study. Our major goal was to determine whether Ca2+ influx through T-and L-type Ca2+ channels induce different cardiac phenotypes.
Three TTCC genes have been identified, but only 2, Cav3.1 (α1G) and Cav3.2 (α1H), have been found in the heart.12,21,22 All TTCCs have similar biophysical properties, including activation at more negative voltages and faster inactivation than LTCCs. Based on studies in Purkinje cells and guinea pig VMs, TTCC current (ICa,T) appears to be less efficient than LTCC current (ICa,L) in excitation–contraction (EC) coupling.23,24 Electrophysiological assessment of ICa,T is technically difficult because of its small amplitude. Additionally, it is difficult to extrapolate findings in Purkinje cells to VMs because of the limited T-tubule and ryanodine receptor (RyR) organization of Purkinje cells.25
α1G and α 1H are reexpressed in the adult ventricle under pathological stress,15-19 but the involvement of these channels in cardiac dysfunction, pathological remodeling and arrhythmias is not known. To understand the function of these channels in the myocardium, we generated mice with inducible, cardiac-specific expression of the α1G-TTCC. Increased Ca2+ influx through TTCCs should augment myocyte contractility and activate Ca2+ regulated signaling pathways. Recently, we showed that increasing Ca2+ influx through LTCCs, by overexpressing its β2a subunit, increased myocyte contractility but eventually induced SR Ca2+ overload and Ca2+-mediated myocyte necrosis, leading to heart failure and premature death.11 In the present study, we asked whether excess Ca2+ influx via TTCCs also causes alterations in contractility, cardiac dysfunction, and premature death.
Our experiments show that mice with cardiac-specific α1G-TTCC expression have increased Ca2+ influx through functional TTCCs. Hearts from α1G animals were mildly hypercontractile, but there was no cardiac pathology or premature death. Myocytes isolated from α1G hearts had increased Ca2+ influx, contractions, and systolic [Ca2+]i transients, but the SR Ca2+ load was not increased. The duration of the [Ca2+]i transient and contractions were shortened, secondary to what appears to be adaptive changes in Ca2+ regulatory proteins. Experiments with electrophysiological and immunostaining approaches suggest that α1G-TTCCs are more highly concentrated in the surface membrane than in T-tubules and their associated junctional SR. These findings explain why ICa,T is an inefficient trigger for SR Ca2+ release and an inefficient source of Ca2+ to load the SR. These studies also show that unlike LTCCs, Ca2+ influx through TTCCs does not induce Ca2+-mediated cardiac pathologies or arrhythmogenic sudden death. Taken together, our new findings suggest that the source of the Ca2+ influx pathway can be a critical determinant of the induced cardiac phenotype.
Materials and Methods
All experiments involving animals were approved by the Institutional Animal Care and Use Committee of Temple University.
Mice
Transgenic mice with conditional and cardiac-specific expression of mouse α1G subunit or rat β2a subunit were generated using a modified murine α-myosin heavy chain (α-MHC) promoter expression vector.11,26 Animals between 10 to 16 weeks of age were used for experiments.
Echocardiography
Whole heart morphology and function were assessed via echocardiography. Hearts were viewed in short-axis and analyzed in M-mode.
Histology
Hearts from animals (9 months old) were fixed in formalin, and longitudinal sections were evaluated for gross morphology and fibrosis.
Western Blot Analysis
Abundance/phosphorylation status of Ca2+ regulatory proteins in ventricular tissue was assessed as described previously.27
Electrophysiology
[Ca2+]i transients (Fluo-3 epifluorescence), fractional shortening, and SR Ca2+ content of isolated VMs were assessed at 0.5 Hz, 35°C.28 Thapsigargin (1 μmol/L) was used to inhibit SR function and assess net Ca2+ influx. Action potentials (APs), Ca2+ currents, and Na+/Ca2+ exchange (NCX) currents were measured via a Axopatch 2B voltage-clamp amplifier as described previously.11,29
Immunostaining
Isolated VMs were fixed, permeabilized, and stained to assess membrane localization of α1G, α1C, or RyR2.
Detubulation
Isolated VMs were incubated in a formamide solution (1.5 mol/L) for 15 minutes. Cells were quickly transferred to a formamide-free Tyrode’s solution to induce detubulation.
An expanded Materials and Methods section can be found in the online data supplement at http://circres.ahajournals.org.
Results
Phenotype of Adult Mice With α1G-TTCC Overexpression
Previously11 we showed that inducible, cardiac-specific overexpression of the β2a subunit of the LTCC increases Ca2+ influx and myocyte contractility but eventually leads to depressed pump function, fibrosis, myocyte necrosis, cardiac hypertrophy, and premature death.11 In the present study, we asked whether increases in Ca2+ influx of a similar magnitude through TTCCs, a class of Ca2+ channels reexpressed during cardiac disease, produced a similar excess Ca2+ phenotype. Mice with cardiac-specific, inducible α1G expression were generated to define the functional role of these channels in the myocardium. A bitransgenic system was used in which a standard α-MHC promoter-driven expression of tTA (regulated by doxycycline) is coupled to a modified α-MHC promoter containing the tet-operon for regulated expression of the α1G cDNA (Figure 1A). α1G mice, unlike the β2a mice,11 had no premature death during the first 12 months of life. Similarly, there were no signs of histopathology (Figure 1B), cardiac dysfunction (Figure 1C), ventricular remodeling, or increases in myocyte death. For comparison, β2a hearts showed robust histopathology by 5 months of age (Figure 1B), as well as premature lethality.11 Provocatively, not only were α1G mice without disease, they also showed enhanced ventricular performance (fractional shortening) compared with control animals (Figure 1D). These data show that expression of α1G-TTCCs induces a fundamentally different cardiac phenotype from overexpression of LTCC-β2a subunit.11
Figure 1. Properties of mice with α1G-TTCC overexpression.

A, Schematic of the bitransgenic system for cardiac-specific α1G overexpression. tTA is the tetracycline-controlled transactivator system. B, Histology of α1G mice was not different than control. C, Representative M-mode echo recording in control and α1G mice. D, Fractional shortening (FS) and ejection fraction (EF) were greater in α1G vs control mice at comparable heart rates. *P<0.05.
Ca2+ Influx via T- and LTCCs in α1G Mice
One possible explanation for the pathological phenotype of β2a versus α1G mice is that Ca2+ influx is increased to a greater extent in β2a than α1G myocytes, resulting in Ca2+-mediated myocyte death. To address this possibility, we measured total Ca2+ influx in myocytes from α1G and β2a myocytes. ICa,T and ICa,L were measured (Figures 2 and 3) using standard biophysical conditions. Control VMs had no ICa,T, as expected, but ICa,T was present in every α1G VM. Peak ICa,T density (Figure 2B) was similar to peak ICa,L density in the β2a mice (Figure 3B). The voltage dependence of ICa,T was similar to published values observed in wild-type channels, with a peak near −30 mV (Figure 2B). ICa,T also had normal recovery from inactivation, with 80% of TTCCs fully recovered within 100 ms (Figure 2C). Therefore, at the normal heart rates of α1G mice, TTCCs will be fully available for activation. ICa,T was less sensitive to Ca2+ than ICa,L and was blocked by Ni2+ (Figure 2D), consistent with the known properties of wild-type α1G-TTCCs. These results show that the expressed α1G has functional and pharmacological properties like native ICa,T.
Figure 2. Ca2+ influx in α1G and β2α myocytes.
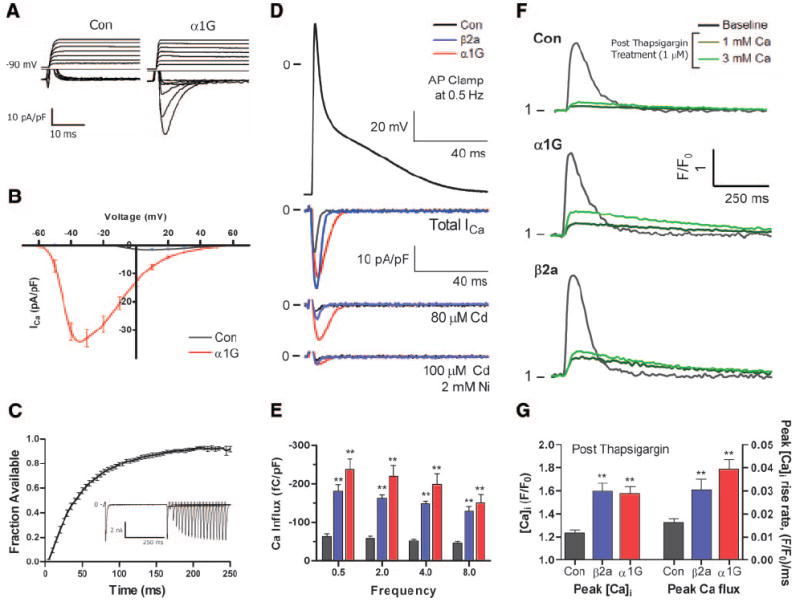
A, Representative ICa,T (ICa,L from −50 mV holding potential was subtracted from total Ca2+ current recorded from −90 mV holding potential) in control and α1G VMs. B, Voltage–current relationship of ICa,T (subtraction as in A) in control (n=10) and α1G (n=15) myocytes. C, Time course of ICa,T recovery from inactivation (n=7) and representative example of ICa,T recovery from inactivation (inset). D, Representative example of total Ca2+ currents under AP voltage clamp in control, β2a, and α1G VMs at 0.5 Hz. E, Integral of total Ca2+ current (without drugs) at different pacing frequencies in control (n=6), β2a (n=8), and α1G VMs (n=6). F, Representative example of [Ca2+]i transients at baseline and after thapsigargin application (1 μmol/L) at 1 mmol/L and 3 mmol/L bath Ca2+. G, Peak [Ca2+]i transient and rise rate of the [Ca2+]i transient after thapsigargin treatment (in 3 mmol/L Ca) in control (n=20), β2a (n=20), and α1G VMs (n=25).
Figure 3. ICa,L density in control, α1G, and β2a VMs.

A, Representative examples of ICa,L in control, α1G, and β2a VMs. B and C, Voltage–current relationships (B) and peak ICa,L (C) in control (n=11), α1G (n=15), and β2a VMs (n=10). D and E, Voltage dependence of ICa,L activation (D) and average half-activation potential (V0.5) (E) in control (n=11), α1G (n=15), and β2a VMs (n=8). *P<0.05, **P<0.01.
AP voltage clamp was used to measure and compare the total Ca2+ influx through both T- and LTCCs during a mouse AP (Figure 2D). Net Ca2+ influx during an AP was similar in α1G and β2a VMs and 3-fold greater than in control VMs (Figure 2E). These studies show that the amount of excess Ca2+ entry via TTCCs in α1G mice is approximately equal to the excess Ca2+ entry via LTCCs in the β2a mice.
Differences in Ca2+ influx in control, β2a, and α1G VMs were also compared by measuring the field-stimulated [Ca2+]i transient after inhibition of SR function with thapsigargin (1 μmol/L) (Figure 2F and 2G). Peak [Ca2+]i transients after thapsigargin treatment were similar in α1G and β2a VMs and significantly greater than control VMs. Peak rising rate of the [Ca2+]i transient, which is an index of Ca2+ flux, was also similar in α1G and β2a VMs and greater than control VMs. Collectively, these results show that Ca2+ entry is increased to a similar extent in α1G and β2a mice. Therefore, differences in Ca2+ influx magnitude do not explain the different phenotypes of α1G and β2a mice.
ICa,L density was significantly smaller in α1G versus control myocytes (Figure 3A through 3C), and its voltage dependence of activation was shifted in the depolarized direction (Figure 3D and 3E). These changes may be a compensation (reduced Ca2+ influx via the normal influx pathway) for the increased Ca2+ influx through α1G-TTCCs.
AP, Contractions, and [Ca2+]i Transients in α1G Myocytes
We have previously shown that excess Ca2+ influx through the LTCC increases myocyte contractions and [Ca2+]i transients.11 α1G VMs had longer AP durations at 50%, 70%, and 90% repolarization and a more prominent plateau phase than control VMs (Figure 4A and 4B). Peak systolic [Ca2+]i transients were greater in α1G versus control myocytes, and the rate of [Ca2+]i transient decay was accelerated (Figure 4C and 4D). Contraction magnitude of α1G myocytes was significantly greater than control myocytes. The duration of contraction was significantly shorter, and relengthening kinetics were accelerated in α1G versus control VMs (Figure 4E and 4F). These results show that increases in Ca2+ influx through α1G induces an increase in [Ca2+]i transient and myocyte contraction but also suggest substantial changes in fundamental aspects of Ca2+ handling in α1G myocytes. The increased [Ca2+]i transient and contractility in α1G myocytes was significantly smaller than in β2a myocytes (Figure 4).11 One possible explanation for these results is that increased Ca2+ entry through TTCCs induces adaptations in myocyte Ca2+ handling such as reducing Ca2+ influx through the LTCCs (see above).
Figure 4. APs, contractions, and cytosolic [Ca2+]i transients are altered in α1G VMs.

A, Representative example of APs in control and α1G VMs. B, Average AP durations (APDs) at 50%, 70%, and 90% repolarization in control (n=9) and α1G (n=11) VMs. C and E, Representative example of [Ca2+]i transients (C) and contractions (E) from control, β2a, and α1G VMs. D, Peak [Ca2+]i transients and ô (Tau) of control (n=10), β2a (n=19), and α1G VMs (n=17). F, Average fractional shortening (FS) in control (n=10), β2a (n=19), and α1G VMs (n=17). *P<0.05, **P<0.01. See text for discussion.
SR Calcium Load and INCX
Our data suggest that excess Ca2+ entry through TTCCs causes a much more modest increase in contractility than a similar increase in Ca2+ entry through LTCCs. One possible explanation is that the 2 sources of Ca2+ entry cause different degrees of SR Ca2+ loading. To test this idea, we measured SR Ca2+ content, defined as the caffeine-induced [Ca2+]i transient. SR Ca2+ content was not different in α1G versus control VMs (Figure 5A and 5B), whereas SR Ca2+ content was increased significantly in β2a myocytes (Figure 5A and 5B). The decay phase of the caffeine-induced [Ca2+]i transient primarily results from NCX-mediated Ca2+ efflux and was not different between control and α1G VMs. INCX measured at +60 mV and −80 mV (Figure 5C and 5D) was also similar in α1G and control myocytes. These results suggest that there are no significant changes in the density or [Ca2+]-dependent activity of the NCX in α1G myocytes, unlike what we have observed in β2a myocytes.11 These results suggest that increased Ca2+ influx through T- and LTCCs are not equivalent in their respective abilities to load the SR.
Figure 5. SR Ca2+ content and NCX current are increased in β2a but not in α1G VMs.

A, Representative example of caffeine-induced [Ca2+]i transients in control, β2a, and α1G VMs. B, Average data of peak caffeine-induced [Ca2+]i transients and ô of decay in control (n=15), β2a (n=13), and α1G VMs (n=17). C, Representative example of INCX from control and α1G VMs. D, Peak INCX at +60 mV and −80 mV in control (n=16) and α1G VMs (n=17).
Ca2+ Regulatory Proteins in α1G Hearts
The rate of decay of the systolic [Ca2+]i transient and its duration were significantly shorter in α1G versus control VMs, suggesting significant alterations in myocyte Ca2+ handling. To address this possibility, we measured Ca2+ regulatory protein abundance and phosphorylation state in control and α1G hearts. Western blot analysis of ventricular tissue confirmed expression of α1G-TTCCs in α1G hearts and found no detectable α1G protein in control tissue (Figure 6A). α1G expression was associated with reduced α1C protein abundance, consistent with reduced ICa,L amplitude (see Figure 3).
Figure 6. Western blot analysis of Ca2+ regulatory proteins in control and α1G hearts.

A, Representative Western blots of Ca2+ regulatory proteins from control (n=7) and α1G (n=6) hearts. B, Analysis of Ca2+ regulatory protein abundance normalized to GAPDH. RyR and PLB phosphorylation levels normalized to total RyR and PLB, respectively. R.U. indicates relative units. *P<0.05, **P<0.01.
SERCA2a abundance was significantly greater, and phospholamban (PLB) abundance was reduced with increased phosphorylation of PLB-Ser16 and PLB-Thr17 in α1G versus control ventricles (Figure 6A and 6B). These changes in SR protein abundance and phosphorylation can account for the enhanced rate of relaxation and more rapid decay of the [Ca2+]i transient in α1G myocytes. No differences in RyR abundance or RyR-Ser2808 phosphorylation were observed in α1G hearts. NCX abundance was slightly but significantly greater in α1G versus control ventricles.
ICa,T and EC Coupling
We next studied whether Ca2+ influx through both T- and LTCCs were equally effective triggers of SR Ca2+ release. [Ca2+]i transients and contractions induced by ICa,L and ICa,T in α1G VMs were measured in Na+- and K+-free conditions to eliminate Na+ and NCX currents and to minimize loss of voltage control. Voltage steps from −90 to −40 mV resulted in an ICa,T with a 3-fold larger amplitude than the ICa,L induced by voltage steps from −50 to +10 mV (Figure 7). However, ICa,T induced significantly smaller [Ca2+]i transients than ICa,L (Figure 7C), and these transients had a slower rate of rise than those induced by ICa,L (Figure 7F). Contractions induced by ICa,T were smaller than those induced by ICa,L, and the kinetics of contractions were slower (Figure 7D and 7G). EC coupling gain (the ratio of peak [Ca2+]i transient to peak Ca2+ current) was nearly 3-fold smaller for ICa,T versus ICa,L (Figure 7E). Similar experiments in control VMs showed no ICa,T, [Ca2+]i transients, or contractions with voltage steps from −90 to −40 mV, whereas ICa,L induced [Ca2+]i transients and contractions from −50 to +10 mV (data not shown). These findings show that Ca2+ influx through α1G-TTCCs is not an effective trigger of SR Ca2+ release, at least under our conditions.
Figure 7. ICa,T is less effective than ICa,L in inducing SR Ca2+ release (n=10).

A, Representative example of peak ICa,L and ICa,T and their corresponding [Ca2+]i transients and contractions. B, Average ICa,L (at + 10 mV) and ICa,T (at −40 mV), as measured in 1 mmol/L bath Ca2+. C and D, Peak [Ca2+]i transients (C) and peak contractions (D) triggered by ICa,L and ICa,T. E, EC coupling gain, determined as the ratio of peak [Ca2+]i transients/peak current for ICa,L and ICa,T. F, Maximum rate of rise of the [Ca2+]i transient induced by ICa,L and ICa,T. G, Maximum rate of contraction attributable to ICa,L and ICa,T. **P<0.01.
TTCC Membrane Localization
One reason why α1G-TTCCs may be ineffective triggers of SR Ca2+ release is that these channels are not localized to regions of the sarcolemma near the junctional SR. Localization of α1G on the VM membrane was determined using an α1G-specific antibody validated in previous studies.12 This antibody labeled α1G-TTCCs that were primarily on the surface sarcolemma of VMs, with less staining within the T-tubules (Figure 8A). By comparison, the staining pattern of α1C, the pore-forming subunit of the LTCC, was primarily within the T-tubules, producing a similar pattern of coincident localization as RyR2 (Figure 8C and 8D). Membrane localization of T- and LTCCs was performed using confocal imaging at the level of the nucleus to ensure that similar intracellular and membrane surface regions were examined in every myocyte. This staining pattern supports the idea that ICa,T is an ineffective trigger of SR Ca2+ release because TTCCs are concentrated in the surface membrane away from the Ca2+ release channels (RyR2).
Figure 8. TTCC localization to surface sarcolemma away from the junctional SR.

A, TTCC staining pattern (red) in α1G VMs at the level of the nucleus (blue) using an α1G-specific antibody. B, Background α1G staining pattern (red) in control VMs. C, LTCC staining pattern (red) using an α1C-specific antibody. D, RyR staining pattern using a RyR2-specific antibody. E and F, Membrane staining with di-8-ANEPPS (green) showing extensive T-tubular system in normal α1G VMs (E) and lack of T-tubules in detubulated α1G VMs (F) at the level of the nucleus (blue). G, Representative example of peak ICa,L and ICa,T in detubulated α1G VMs. H, Comparison of peak ICa,L and ICa,T before (n=15) and after (n=7) detubulation in α1G VMs. **P<0.01.
Using antibodies to define membrane localization of ion channels can produce variable results.31 Therefore, we used another independent technique to confirm that TTCCs are more concentrated in the surface membrane than in the T-tubules of α1G VMs. Formamide-induced osmotic shock produces rapid changes in cellular volume that causes T-tubules to detach from the surface membrane.30 This detubulation technique has been used to confirm the principal localization of LTCCs within the T-tubule system.30 We used this approach to examine the idea that TTCCs are not in high density within the T-tubules. Membrane staining with di-8-ANEPPS confirmed the presence and loss of T-tubules in normal and detubulated α1G VMs, respectively (Figure 8E and 8F). Voltage-clamp techniques were then used to measure ICa,L and ICa,T in α1G VMs with and without detubulation (Figure 8G). Detubulation in α1G myocytes was associated with a 72% reduction in ICa,L and a significantly smaller, 32% decline in ICa,T, consistent with the antibody studies (Figure 8H). Collectively, these data support the idea that α1G-TTCCs are primarily on the surface membrane of VMs.
Discussion
The objective of this study was to define the functional role of TTCCs in adult VMs. TTCCs are expressed early in the developing heart,12-14 where they are thought to contribute to pacemaking and the induction of contraction in immature myocytes. TTCC expression decreases after birth and few, if any, of these channels exist in adult VMs.14 Cardiovascular diseases that increase systolic wall stress in the ventricle, such as hypertension and myocardial infarction, induce reexpression of TTCCs,15-19 which was hypothesized to contribute to cardiac dysfunction, arrhythmias, and sudden death.20 However, a direct link between Ca2+ influx through TTCCs and these processes has not been causally established. To explore the role of TTCCs in the adult heart, we generated a mouse model with inducible expression of α1G-TTCCs.
α1G mice had functional TTCCs that caused an increased Ca2+ influx (Figure 2). Previously, we showed that increasing Ca2+ influx through LTCCs by expressing its β2a subunit increases myocyte contractility but over time causes cardiac dysfunction by inducing myocyte death from SR Ca2+ overload–induced necrosis.11 These findings strongly support the idea that persistent increases in Ca2+ influx eventually cause cardiomyopathy by reducing the number of functional cardiac myocytes, consistent with the known benefit of LTCC blockers in select forms of heart disease.32
The α1G mice used in the present experiments had increases in Ca2+ influx that were similar to or greater than in β2a mice, but, surprisingly, they did not develop a pathological cardiac phenotype. These hearts and their resident myocytes were hypercontractile, but we could not detect evidence for cardiac histopathology or sudden death, at least during the first 12 months of life. These new studies show that increasing Ca2+ influx through α1G-TTCCs, by itself, is not sufficient to induce cardiac dysfunction or arrhythmias. The reasons why increasing Ca2+ influx through T- and LTCCs induces such fundamentally different phenotypes in the adult heart is not clear and will be a major topic for future studies. Our current studies suggest that the location of the Ca2+ influx pathway appears to be the critical determinant of the induced cardiac phenotype.
Expression of α1G-TTCC Induces Alterations in Myocyte Ca2+ Handling
Ca2+ influx was ≈3-fold greater than normal in both β2a and α1G VMs. In the absence of compensatory changes in other Ca2+ regulatory processes, this increase in Ca2+ entry should cause similar increases in myocyte contractility and SR Ca2+ loading in myocytes from both transgenic mice. However, myocyte contractions and [Ca2+]i transients were smaller in α1G versus β2a myocytes (Figure 4 and elsewhere11). This appears to result from the fact that the SR Ca2+ load was not increased in α1G VMs (Figure 5), suggesting that T- and L-type Ca2+ fluxes are handled differently by cardiac myocytes. In this regard, we observed a significant decrease in the duration of contraction and the [Ca2+]i transient in α1G myocytes (Figure 4C and 4E), suggesting that α1G-TTCC expression and the associated increase in Ca2+ influx induced remodeling of other aspects of myocyte Ca2+ handling. We explored these compensatory changes using cellular biophysical techniques and Western blot analysis.
Western blot analysis of ventricular tissue showed that the abundance and phosphorylation state of certain Ca2+-handling proteins were altered in α1G hearts. The protein abundance of the LTCC-α1C pore-forming subunit was significantly smaller in α1G versus control hearts. ICa,L density was also smaller in α1G versus control VMs, consistent with the Western blot analysis. These results suggest that the increased Ca2+ influx through the α1G-TTCCs induces a reduction in LTCC density. This compensatory change could reduce the likelihood of SR Ca2+ overload and associated pathologies in α1G hearts. Western blot analysis also showed an increased SERCA2a expression level and a reduced PLN abundance with increased phosphorylation at PLB-Ser16 and PLN-Thr17 in α1G versus control hearts. These changes will promote Ca2+ uptake by the SR and can explain the shortened [Ca2+]i transient duration that we observed in α1G mice. Western blot analysis showed an increase in NCX abundance, but we did not find an increase in Ca2+-mediated NCX activity in α1G VMs in response to caffeine-induced SR Ca2+ release.
Peak systolic Ca2+ was increased in α1G versus control myocytes, but their SR Ca2+ loads were not greater than in controls. We speculate that the increased systolic Ca2+ in α1G myocytes results from an increase in Ca2+ influx through TTCCs, together with a similar (to that in control VMs) Ca2+ release from the SR (consistent with our finding that the SR Ca2+ load is normal). Why an increase in α1G-mediated sarcolemmal Ca2+ influx does not result in an increase in SR Ca2+ loading is not clear, because increasing Ca2+ influx via the LTCCs caused a significant increase in SR Ca2+ loading (Figure 5).
TTCCs Are on the Surface Sarcolemma, and LTCCs Are in T-Tubules
Our experiments demonstrate that Ca2+ influx through T- and LTCCs have a different capacity to load the SR (Figure 5) and to induce SR Ca2+ release (Figure 7). ICa,T induced [Ca2+]i transients with smaller amplitudes and slower rates of rise than those caused by ICa,L, suggesting that TTCCs are not proximal to the RyRs to induce efficient SR Ca2+ release. Our results also suggest that Ca2+ entry via TTCCs is not taken up by the SR to the same extent as the Ca2+ influx via LTCCs. We therefore went on to test the idea that T- and LTCCs are localized to different regions of the surface membrane.
Immunostaining showed that α1G-TTCCs are localized to the surface membrane and are not significantly localized within the T-tubules, the principal site of LTCC localization (Figure 8). The T-tubule system is composed of extensive invaginations of the cell membrane that allow rapid transmission of electric signals into the interior of the VM for spatial uniformity of SR Ca2+ release for myocyte contraction. The fraction of cell membrane comprised by the T-tubular system is very species-dependent and has been reported to be between 50% and 64% for murine VMs.33-37 LTCCs are localized to regions of the T-tubules (Figure 8) that are in close apposition to the junctional SR.30 To confirm that LTCCs are primarily within the T-tubule system and that TTCCs are primarily on the surface membrane, we used osmotic shock, which on the swelling phase of the protocol, causes T-tubules to separate from the surface membrane. Our imaging studies confirm that the primary membrane lost following osmotic shock is from the T-tubules and that this membrane contains more L- than TTCCs (Figure 8). We did not perform electrophysiological measurements in the same cells before and after osmotic shock, so we could not determine the percentage reduction in membrane capacitance in osmotically shocked myocytes. Collectively, our results show that Ca2+ influx through T- and LTCCs has fundamentally different effects on EC coupling and SR Ca2+ loading. We conclude that Ca2+ entering VMs through T- and LTCCs occupies different submembrane compartments, where it has different effects on myocyte physiology.
Our findings in α1G VMs confirm previous reports that TTCCs are ineffective triggers of EC coupling.23,24 Indeed, Sipido et al demonstrated that TTCCs are much less efficient at triggering Ca2+ release than LTCCs, and the authors attributed these differences to differential localization of T-and LTCCs.23
We speculate that the differential membrane localization of T- and LTCCs in α1G VMs is responsible for the different phenotypes of β2a and α1G mice. The increased Ca2+ entry through TTCCs at the surface membrane could be rapidly transported out of the cell, so that only a small fraction of this Ca2+ enters the SR. This, coupled with a compensatory reduction in Ca2+ entry through LTCCs, could explain the modest increase in contractility, with no significant change in SR Ca2+ loading. Similar increases in total Ca2+ entry through the LTCCs in β2a mice caused increased SR Ca2+ loading, [Ca2+]i transients, and contractility. Our most important finding is that increased Ca2+ entry through TTCCs did not induce cardiac dysfunction, histopathology, or premature death. These results show that the Ca2+ entry pathway, the location of the Ca2+ channels within the membrane, as well as the Ca2+ influx magnitude, determines the resultant cardiac phenotype. Additional studies are needed to determine the specific role of increased Ca2+ influx via TTCCs under pathological conditions.
Supplementary Material
Acknowledgments
Sources of Funding This study was supported by NIH grants HL033921, HL089312, and 1P01HL91799 (to S.R.H.); and American Heart Association Predoctoral Fellowship Grant 0715229U (Great Rivers Affiliate) (to N.J.).
Footnotes
Data Supplement (unedited) at: http://circres.ahajournals.org/cgi/content/full/CIRCRESAHA.108.185611/DC1
Disclosures None.
References
- 1.Bers DM. Cardiac excitation-contraction coupling. Nature. 2002;415:198–205. doi: 10.1038/415198a. [DOI] [PubMed] [Google Scholar]
- 2.Bers DM, Perez-Reyes E. Ca channels in cardiac myocytes: structure and function in Ca influx and intracellular Ca release. Cardiovasc Res. 1999;42:339–360. doi: 10.1016/s0008-6363(99)00038-3. [DOI] [PubMed] [Google Scholar]
- 3.Berridge MJ, Lipp P, Bootman MD. The versatility and universality of calcium signalling. Nat Rev Mol Cell Biol. 2000;1:11–21. doi: 10.1038/35036035. [DOI] [PubMed] [Google Scholar]
- 4.Frey N, McKinsey TA, Olson EN. Decoding calcium signals involved in cardiac growth and function. Nat Med. 2000;6:1221–1227. doi: 10.1038/81321. [DOI] [PubMed] [Google Scholar]
- 5.Maack C, O’Rourke B. Excitation-contraction coupling and mitochondrial energetics. Basic Res Cardiol. 2007;102:369–392. doi: 10.1007/s00395-007-0666-z. [DOI] [PMC free article] [PubMed] [Google Scholar]
- 6.Balke CW, Shorofsky SR. Alterations in calcium handling in cardiac hypertrophy and heart failure. Cardiovasc Res. 1998;37:290–299. doi: 10.1016/s0008-6363(97)00272-1. [DOI] [PubMed] [Google Scholar]
- 7.LaPointe MC, Deschepper CF, Wu JP, Gardner DG. Extracellular calcium regulates expression of the gene for atrial natriuretic factor. Hypertension. 1990;15:20–28. doi: 10.1161/01.hyp.15.1.20. [DOI] [PubMed] [Google Scholar]
- 8.Richard S, Leclercq F, Lemaire S, Piot C, Nargeot J. Ca2+ currents in compensated hypertrophy and heart failure. Cardiovasc Res. 1998;37:300–311. doi: 10.1016/s0008-6363(97)00273-3. [DOI] [PubMed] [Google Scholar]
- 9.Sei CA, Irons CE, Sprenkle AB, McDonough PM, Brown JH, Glembotski CC. The alpha-adrenergic stimulation of atrial natriuretic factor expression in cardiac myocytes requires calcium influx, protein kinase C, and calmodulin-regulated pathways. J Biol Chem. 1991;266:15910–15916. [PubMed] [Google Scholar]
- 10.Bodi I, Mikala G, Koch SE, Akhter SA, Schwartz A. The L-type calcium channel in the heart: the beat goes on. J Clin Invest. 2005;115:3306–3317. doi: 10.1172/JCI27167. [DOI] [PMC free article] [PubMed] [Google Scholar]
- 11.Nakayama H, Chen X, Baines CP, Klevitsky R, Zhang X, Zhang H, Jaleel N, Chua BH, Hewett TE, Robbins J, Houser SR, Molkentin JD. Ca2+-and mitochondrial-dependent cardiomyocyte necrosis as a primary mediator of heart failure. J Clin Invest. 2007;117:2431–2444. doi: 10.1172/JCI31060. [DOI] [PMC free article] [PubMed] [Google Scholar]
- 12.Cribbs LL, Martin BL, Schroder EA, Keller BB, Delisle BP, Satin J. Identification of the t-type calcium channel (Ca(v)3.1d) in developing mouse heart. Circ Res. 2001;88:403–407. doi: 10.1161/01.res.88.4.403. [DOI] [PubMed] [Google Scholar]
- 13.Nuss HB, Marban E. Electrophysiological properties of neonatal mouse cardiac myocytes in primary culture. J Physiol. 1994;479:265–279. doi: 10.1113/jphysiol.1994.sp020294. [DOI] [PMC free article] [PubMed] [Google Scholar]
- 14.Qu Y, Boutjdir M. Gene expression of SERCA2a and L- and T-type Ca channels during human heart development. Pediatr Res. 2001;50:569–574. doi: 10.1203/00006450-200111000-00006. [DOI] [PubMed] [Google Scholar]
- 15.Ferron L, Capuano V, Ruchon Y, Deroubaix E, Coulombe A, Renaud JF. Angiotensin II signaling pathways mediate expression of cardiac T-type calcium channels. Circ Res. 2003;93:1241–1248. doi: 10.1161/01.RES.0000106134.69300.B7. [DOI] [PubMed] [Google Scholar]
- 16.Huang B, Qin D, Deng L, Boutjdir M, N E-S. Reexpression of T-type Ca2+ channel gene and current in post-infarction remodeled rat left ventricle. Cardiovasc Res. 2000;46:442–449. doi: 10.1016/s0008-6363(00)00017-1. [DOI] [PubMed] [Google Scholar]
- 17.Izumi T, Kihara Y, Sarai N, Yoneda T, Iwanaga Y, Inagaki K, Onozawa Y, Takenaka H, Kita T, Noma A. Reinduction of T-type calcium channels by endothelin-1 in failing hearts in vivo and in adult rat ventricular myocytes in vitro. Circulation. 2003;108:2530–2535. doi: 10.1161/01.CIR.0000096484.03318.AB. [DOI] [PubMed] [Google Scholar]
- 18.Martinez ML, Heredia MP, Delgado C. Expression of T-type Ca(2+) channels in ventricular cells from hypertrophied rat hearts. J Mol Cell Cardiol. 1999;31:1617–1625. doi: 10.1006/jmcc.1999.0998. [DOI] [PubMed] [Google Scholar]
- 19.Nuss HB, Houser SR. T-type Ca2+ current is expressed in hypertrophied adult feline left ventricular myocytes. Circ Res. 1993;73:777–782. doi: 10.1161/01.res.73.4.777. [DOI] [PubMed] [Google Scholar]
- 20.Kuwahara K, Saito Y, Takano M, Arai Y, Yasuno S, Nakagawa Y, Takahashi N, Adachi Y, Takemura G, Horie M, Miyamoto Y, Morisaki T, Kuratomi S, Noma A, Fujiwara H, Yoshimasa Y, Kinoshita H, Kawakami R, Kishimoto I, Nakanishi M, Usami S, Harada M, Nakao K. NRSF regulates the fetal cardiac gene program and maintains normal cardiac structure and function. EMBO J. 2003;22:6310–6321. doi: 10.1093/emboj/cdg601. [DOI] [PMC free article] [PubMed] [Google Scholar]
- 21.Cribbs LL, Lee JH, Yang J, Satin J, Zhang Y, Daud A, Barclay J, Williamson MP, Fox M, Rees M, Perez-Reyes E. Cloning and characterization of alpha1H from human heart, a member of the T-type Ca2+ channel gene family. Circ Res. 1998;83:103–109. doi: 10.1161/01.res.83.1.103. [DOI] [PubMed] [Google Scholar]
- 22.Perez-Reyes E. Molecular physiology of low-voltage-activated t-type calcium channels. Physiol Rev. 2003;83:117–161. doi: 10.1152/physrev.00018.2002. [DOI] [PubMed] [Google Scholar]
- 23.Sipido KR, Carmeliet E, Van de Werf F. T-type Ca2+ current as a trigger for Ca2+ release from the sarcoplasmic reticulum in guinea-pig ventricular myocytes. J Physiol. 1998;508:439–451. doi: 10.1111/j.1469-7793.1998.439bq.x. [DOI] [PMC free article] [PubMed] [Google Scholar]
- 24.Zhou Z, January CT. Both T- and L-type Ca2+ channels can contribute to excitation-contraction coupling in cardiac Purkinje cells. Biophys J. 1998;74:1830–1839. doi: 10.1016/S0006-3495(98)77893-2. [DOI] [PMC free article] [PubMed] [Google Scholar]
- 25.Brette F, Orchard C. Resurgence of cardiac t-tubule research. Physiology (Bethesda) 2007;22:167–173. doi: 10.1152/physiol.00005.2007. [DOI] [PubMed] [Google Scholar]
- 26.Sanbe A, Gulick J, Hanks MC, Liang Q, Osinska H, Robbins J. Reengineering inducible cardiac-specific transgenesis with an attenuated myosin heavy chain promoter. Circ Res. 2003;92:609–616. doi: 10.1161/01.RES.0000065442.64694.9F. [DOI] [PubMed] [Google Scholar]
- 27.Kubo H, Margulies KB, Piacentino V, III, Gaughan JP, Houser SR. Patients with end-stage congestive heart failure treated with beta-adrenergic receptor antagonists have improved ventricular myocyte calcium regulatory protein abundance. Circulation. 2001;104:1012–1018. doi: 10.1161/hc3401.095073. [DOI] [PubMed] [Google Scholar]
- 28.Piacentino V, III, Weber CR, Chen X, Weisser-Thomas J, Margulies KB, Bers DM, Houser SR. Cellular basis of abnormal calcium transients of failing human ventricular myocytes. Circ Res. 2003;92:651–658. doi: 10.1161/01.RES.0000062469.83985.9B. [DOI] [PubMed] [Google Scholar]
- 29.Piacentino V, III, Dipla K, Gaughan JP, Houser SR. Voltage-dependent Ca2+ release from the SR of feline ventricular myocytes is explained by Ca2+-induced Ca2+ release. J Physiol. 2000;523:533–548. doi: 10.1111/j.1469-7793.2000.t01-1-00533.x. [DOI] [PMC free article] [PubMed] [Google Scholar]
- 30.Kawai M, Hussain M, Orchard CH. Excitation-contraction coupling in rat ventricular myocytes after formamide-induced detubulation. Am J Physiol. 1999;277:H603–H609. doi: 10.1152/ajpheart.1999.277.2.H603. [DOI] [PubMed] [Google Scholar]
- 31.Barry DM, Trimmer JS, Merlie JP, Nerbonne JM. Differential expression of voltage-gated K+ channel subunits in adult rat heart. Relation to functional K+ channels? Circ Res. 1995;77:361–369. doi: 10.1161/01.res.77.2.361. [DOI] [PubMed] [Google Scholar]
- 32.Semsarian C, Ahmad I, Giewat M, Georgakopoulos D, Schmitt JP, McConnell BK, Reiken S, Mende U, Marks AR, Kass DA, Seidman CE, Seidman JG. The L-type calcium channel inhibitor diltiazem prevents cardiomyopathy in a mouse model. J Clin Invest. 2002;109:1013–1020. doi: 10.1172/JCI14677. [DOI] [PMC free article] [PubMed] [Google Scholar]
- 33.Bossen EH, Sommer JR, Waugh RA. Comparative stereology of mouse atria. Tissue Cell. 1981;13:71–77. doi: 10.1016/0040-8166(81)90039-2. [DOI] [PubMed] [Google Scholar]
- 34.Forbes MS, Hawkey LA, Sperelakis N. The transverse-axial tubular system (TATS) of mouse myocardium: its morphology in the developing and adult animal. Am J Anat. 1984;170:143–162. doi: 10.1002/aja.1001700203. [DOI] [PubMed] [Google Scholar]
- 35.Shepherd N, McDonough HB. Ionic diffusion in transverse tubules of cardiac ventricular myocytes. Am J Physiol. 1998;275:H852–H860. doi: 10.1152/ajpheart.1998.275.3.H852. [DOI] [PubMed] [Google Scholar]
- 36.Clark RB, Tremblay A, Melnyk P, Allen BG, Giles WR, Fiset C. T-tubule localization of the inward-rectifier K(+) channel in mouse ventricular myocytes: a role in K(+) accumulation. J Physiol. 2001;537:979–992. doi: 10.1111/j.1469-7793.2001.00979.x. [DOI] [PMC free article] [PubMed] [Google Scholar]
- 37.Forbes MS, Sperelakis N. A labyrinthine structure formed from a transverse tubule of mouse ventricular myocardium. J Cell Biol. 1973;56:865–869. doi: 10.1083/jcb.56.3.865. [DOI] [PMC free article] [PubMed] [Google Scholar]
Associated Data
This section collects any data citations, data availability statements, or supplementary materials included in this article.