Abstract
A central question in stem cell biology is whether organ homeostasis is maintained in adult organs through undifferentiated stem cells or self-duplication of specialized cell populations. To address this issue in the exocrine pancreas we analyzed the Bmi1-labeled cell lineage of pancreatic acinar cells. Previously, we had shown that inducible linage tracing with Bmi1-Cre-estrogen receptor (ER) in the small intestine specifically, labels “classical” undifferentiated intestinal stem cells. In this article we demonstrate that the Bmi1-Cre-ER system labels a subpopulation of differentiated acinar cells in the exocrine pancreas whose derivatives are still present, at a steady-state level, 1 year after a single TM pulse. This study suggests that Bmi1 is a marker for a subpopulation of self-renewing acinar cells, indicating that self-renewal is not an exclusive feature of adult undifferentiated stem cells. Further, the extended period that Bmi1-labeled acinar cells retain a pulse of BrdU suggests that some of this subpopulation of cells are not continuously replicating, but rather are set aside until needed. This cellular behavior is again reminiscent of behavior normally associated with more classical adult stem cells. Setting aside cells capable of self-renewal until needed retains the advantage of protecting this subpopulation of cells from DNA damage induced during replication.
Keywords: acinar cell homeostasis, stem cells
In many tissues progressive cell specialization and differentiation is considered a terminal process associated with exit from the cell cycle and loss of proliferative capacity (1). The consequent corollary is that only specialized undifferentiated progenitors/stem cells can proliferate, giving rise to differentiated cells to replace lost cells and maintain tissue homeostasis. This classic hypothesis was challenged 40 years ago by several studies (2, 3) suggesting that 3H-thymidine was incorporated in organs like pancreas, thyroid, and kidney in well-defined differentiated cells. The insulin-producing β cells of the endocrine pancreas are excellent examples of adult differentiated cells that are well characterized with respect to their proliferative capacity. Three different reports (4–6) showed that β cells maintain organ and glucose homeostasis in vivo, under normal physiological conditions, through rounds of self-duplication. In contrast, a recent article (7) showed that β cell progenitors exist and reside within or around the duct epithelium. These progenitor cells were identified by Ngn3 and activated after injury, generating all of the endocrine cell types. Even though that study opens up the potential of using Ngn3+ cells for in vivo cell-based therapy for diabetic patients, it remains to be clarified whether Ngn3+cells have a significant role in organ homeostasis under normal physiological conditions (8).
Interestingly, Teta et al. (4) found that exocrine acinar cells exhibit proliferative behavior that is compatible with self-duplication (9, 10). These studies, however, did not identify and follow over time a proliferative acinar subpopulation capable of self-renewal, because the reporter labeled all differentiated cells. To study the behavior of proliferative adult cells in the exocrine pancreas we used a mouse line expressing the Cre-ER molecule [Cre recombinase coupled to the estrogen receptor, making Cre activity dependent on tamoxifen (TM) injection] (11) from the Bmi1 locus.
Bmi1 has an established role in self-renewal of adult hematopoietic and neural stem cells (12–14). Using the above mouse line, we previously demonstrated that in the intestine Bmi1 specifically labels adult intestinal stem cells (15). In the exocrine pancreas, Bmi1 is expressed in a subpopulation of acinar cells that show a differentiated phenotype. We followed this population over time to assess its lifespan. The unexpected result was that despite their differentiated phenotype cells derived from Bmi1-expressing cells that were labeled by a single injection of TM at 1 month of age were still present, at their steady-state level, 1 year later. Using 2 different injury models, diphtheria toxin cell ablation (DTA) (16) and caerulein-induced pancreatitis, we were able to demonstrate that the Bmi1-labeled, differentiated acinar cells undergo compensatory proliferation to maintain organ homeostasis.
This study provides an in vivo description of an adult proliferative differentiated cell compartment. This population, identified by Bmi1 expression, enables the pancreas to maintain organ homeostasis both under normal conditions and after tissue injury through self-renewal of a differentiated acinar subpopulation. This behavior is normally associated with more “classical” adult stem cells: setting aside cells capable of self-renewal until needed and retaining the advantage of protecting this subpopulation of cells from DNA damage induced during replication.
Results
Bmi1 Expression in the Adult Pancreas.
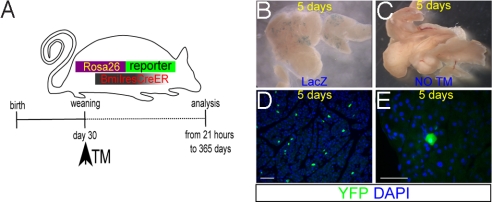
To identify the expression of Bmi1 in adult mice and follow the lineage derived from these labeled cells, a Bmi1-Cre-ER mouse line, expressing the TM-inducible Cre from the Bmi1 locus was generated (15). This allele was crossed with a RosaYFP or RosaLacZ mouse reporter line that conditionally and constitutively expresses the yellow fluorescent (YFP) or β-galactosidase (LacZ) transcripts from the activated Rosa locus (17) (Fig. 1A). Two cohorts of mice (>70) double heterozygotes Bmi1Cre-ER/+;Rosa26YFP/+ and Rosa26LacZ/+ were generated. After weaning, each mouse was treated once with TM and then the organs were harvested at different time points from 21 h up to 1 year.
Fig. 1.
Bmi1 lineage analysis in pancreas. (A) More than 70 Bmi1Cre-ER/+;Rosa26YFP/+ mice (or Rosa26LacZ/+) were generated, injected at weaning with TM, and harvested at different time points from 21 h up to 1 year. (B) Whole-mount LacZ staining showing the pattern of the lineage obtained 5 days after TM treatment. (C) Age-matched control Bmi1Cre-ER/+;Rosa26LacZ/+ pancreas without TM showed no activation of the LacZ reporter. (D and E) Pancreatic sections showing the Bmi1+ lineage. (E) High magnification of an YFP+ differentiated acinar cell. (Scale bars: 50 μm.)
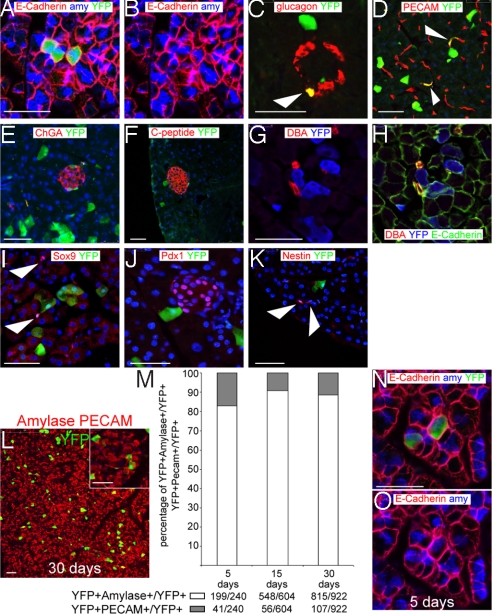
Because the pancreas is important in many pathological processes such as diabetes and pancreatic adenocarcinoma, we focused our attention on the expression of Bmi1 in that organ. First, the expression domain of Bmi1 was established. Five days after TM induction, lineage tracing showed few scattered YFP+ cells throughout the adult pancreas (Fig. 1 B–E) representing ≈2.5% of the total cells of pancreas. Every cell (expressing YFP) coexpressed a marker of differentiation. The most abundant population is acinar cells (amylase+). Two other labeled populations were glucagon+ cells inside the islets and endothelial cells (PECAM+), whereas the Bmi1+ lineage was largely absent in duct cells (DBA+), other islet cells (C-peptide+ and ChromograninA+), and centroacinar cells (Sox9+) (Fig. 2 A–I).
Fig. 2.
Early Bmi1+ lineage is present only in differentiated cells. (A–D) Bmi1 is expressed in acinar cells (amylase+), glucagon+ cells (white arrowhead), and endothelial cells (PECAM+) (white arrowheads). (E–I) Bmi1 is largely absent from other cells in the islets (ChromograninA+ and C-peptide+), ducts (DBA+), and centroacinar cells (Sox9+) (white arrowheads). In A, B, G, and H E-cadherin staining was used to identify the cell boundaries. (J–K) Bmi1+ lineage is negative for Pdx1 and Nestin (white arrowheads). (L) Representative microscopic field of our analysis, the higher magnification inset shows an endothelial cell (PECAM+) and some acinar cells (amylase+). (M) At 5, 15, and 30 days pancreas was harvested from Bmi1Cre-ER/+;Rosa26FP/+ mice. All differentiated double positive cells were counted for each time point. (N and O) Representative pictures of 2 of the 100 cells analyzed at 5 days after TM treatment to show the perfect colocalization between YFP+ cell and amylase. E-cadherin staining was used to identify the cell boundaries. (Scale bars: 50 μm.)
We investigated whether Bmi1+ lineage was positive for markers of pancreatic progenitors. We tested Nestin (18) and Pdx1 (19) and found that the Bmi1+ lineage was negative for those markers (Fig. 2 J–K). The same markers (Sox9, Pdx1, Nestin) were tested at different time points during our chase and they were always found negative in the Bmi1+ lineage.
Because the acinar cells were the most abundant population (≈90%; Fig. 2 L–M) and readily identifiable using molecular markers and/or morphological criteria, we focused our experiments on their proliferative behavior. To confirm that Bmi1 is labeling only differentiated cells, the same sections were analyzed simultaneously with antibodies for acinar, endothelial, and glucagon cells to identify whether the whole Bmi1 lineage colocalized with differentiated markers. Glucagon+ cells were not included in the count because not all of the randomly-selected fields contained an islet and the number of positive glucagon cells was very small. At day 5 after TM treatment, 240 Bmi1+ cells were counted in different sections, and none of them were negative for the 3 antibodies simultaneously tested (Fig. 2 L–M). The same experiment was repeated after 15 and 30 days, and 604 and 922 cells were counted per each time point, confirming that Bmi1 expression in an undifferentiated compartment is unlikely (Fig. 2 L–M). We repeated the same experiment at 5 days by using an antibody against E-cadherin to identify the cell boundaries; we counted 100 cells and found that all of the YFP+ cells were indisputably colocalizing with a differentiation marker (amylase or PECAM) (Fig. 2 N and O).
1-Year Bmi1 Lineage Tracing.
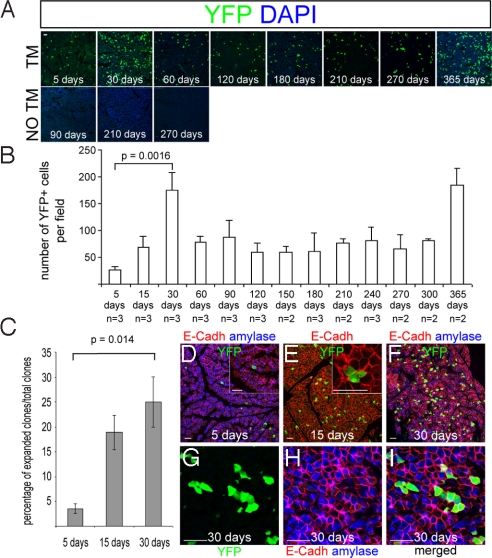
Our next experiments focused on the proliferative behavior of YFP+amylase+ cells. Five days after TM treatment Bmi1+ acinar cells were few and dispersed throughout the pancreas (Fig. 1D). A cohort of Bmi1Cre-ER/+;Rosa26YFP/+ mice received a single pulse of TM and were then chased for >1 year. Pancreas was harvested at different time points and Bmi1+ cells were counted. Despite being completely differentiated, the lineage from this labeled subpopulation of acinar cells was still present 1 year after TM treatment and showed the following dynamic behavior. There was a progressively linear increase in the number of labeled cells from days 5 to 30. From days 30 to 60 the number of labeled acinar cells dropped to approximately the same level as 15 days and it was stable until 10 months after TM treatment. From 10 months the number of labeled cells climbed again, reaching a second peak at 12 months, when our experiment stopped (Fig. 3 A and B). To confirm that the persistence of the lineage and its dynamic expansion and contraction is not mediated by the random activity of the Cre-ER system, activating the reporter protein in absence of TM, 9 mice (6 Bmi1Cre-ER/+;Rosa26LacZ/+; 3 Bmi1Cre-ER/+;Rosa26YFP/+) were analyzed without any TM administration. Six mice with the LacZ reporter were harvested at 1 month (n = 3) and 6 months (n = 3), whereas 3 mice, with the YFP reporter line, were harvested at 1, 4, and 9 months. None of the pancreatic sections (at least 12 per each organ, throughout the whole pancreas) stained for LacZ or visualized directly for YFP fluorescence, showed any labeled cell in the absence of TM induction (Figs. 1C and 3A). These experiments demonstrate that random activation of the CreER system does not explain the proliferation of labeled cells observed during the first month or the long persistence of the lineage thereafter.
Fig. 3.
Bmi1 long-term lineage analysis. (A and B) Bmi1Cre-ER/+;Rosa26YFP/+ mice were injected at weaning with TM and followed for >1 year. (A) Representative microscopic fields of pancreas harvested at different time points showing YFP+ cells. Control pancreas with the same genotype without TM, showing no YFP+ cells. (B) Graph showing the number of YFP+ cells present at the different time points analyzed. (C) Graph showing the percentage of clones at 5, 15, and 30 days that underwent replication. YFP+ cells with 1 or more labeled adjacent cells (expanded clones) increased over time. (D–I) Representative pictures of mostly isolated cells at 5 days (D) and expanded clones at 15 and 30 days (E–I). (Insets) High-magnification images of an isolated cell (D) and 3 YFP+ adjacent cells (E). (Scale bars: 50 μm.)
In exocrine pancreas there is no evidence of cell migration and dying cells are presumably replaced by proliferation of adjacent ones. If this is true, the increased number of cells during the first month after TM administration has to be associated with local clonal expansion of the cells originally labeled. To test this hypothesis we counted YFP+ cells at 5, 15, and 30 days after TM treatment and categorized them as either isolated cells (we called them “isolated clones”) or cells with at least an adjacent labeled cell, expanded clones. We considered adjacent cells those who shared at least one of their cell membranes (stained with an antibody against E-cadherin). At day 5 the YFP+amylase+ cells were dispersed with usually no more than 1 cell per acinus; at 15 and 30 days the increasing number of cells was associated with >1 cell in the same acinus. As predicted over time there was an increased number of “expanded clones” (Fig. 3C) and all of the labeled cells were also amylase+, indicating that both the presumptive parent and daughter cells were differentiated acinar cells (Fig. 3 D–I). The number of expanded clones at 15 and 30 days can also be considered as a raw estimate of the fraction of cells undergoing replication in the time frame considered. From 1–12 months the YFP lineage showed a mixture of isolated clones and expanded clones (Fig. S1).
Proliferation Analysis of the Bmi1 Lineage.
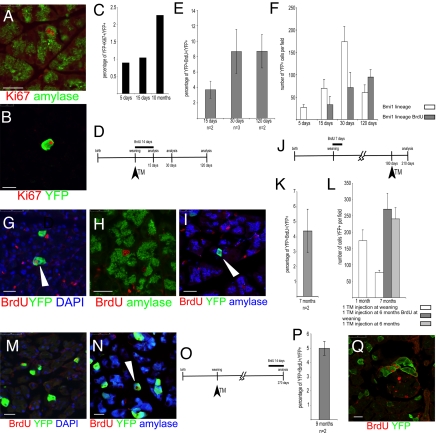
Despite their differentiated phenotype, pancreatic acinar cells are considered capable of proliferation, because they can incorporate nucleotides analogues such as 3H-thymidine (2). More recently, experiments using molecular markers (Ki-67, BrdU, or other thymidine analogues) or lineage tracing experiments have found that acinar cells are positive for proliferative markers, further substantiating their ability to proliferate. We estimated that Ki-67+ amylase+ (Ki67 is a marker for proliferating cells) cells represent ≈2.0% of all amylase cells (Fig. 4A). To identify the fraction of YFP+ cells in the cell cycle, the Bmi1 lineage was coevaluated for Ki-67. Pancreatic sections were analyzed at days 5 and 15 and 10 months after TM treatment. Double positive Ki-67/YFP cells were found at this frequency (Fig. 4 B and C). To more accurately evaluate the fraction of Bmi1 lineage that are proliferating, BrdU incorporation was used (4). After weaning, Bmi1Cre-ER/+;Rosa26YFP/+ mice were injected with TM and treated with water containing BrdU for 2 weeks (Fig. 4D). Mice were killed, and pancreas was harvested at 15 (n = 2), 30 (n = 3), and 120 (n = 2) days. The percentage of BrdU+YFP+ cells was 4%, 8%, and 8%, respectively, of the total YFP+, reflecting the proliferative activity of the YFP+ cells undergoing replication during BrdU exposure (Fig. 4E). However, the Bmi1 lineage in the same pancreas exhibited ≈50% fewer YFP+ cells at 15 and 30 days, compared with the lineage of Bmi1Cre-ER/+;Rosa26YFP/+ control mice lacking BrdU feeding (Fig. 4F). At 120 days, the Bmi1 lineage, in BrdU-treated mice, “recovered” and was comparable to control mice (Fig. 4F). Our cautious interpretation is that although long-term treatment with BrdU is generally safe (our mice looked “healthy”), it is possible that cells with a high incorporation rate of BrdU might die or be arrested in their cell cycle as a side effect of the treatment (20).
Fig. 4.
Proliferation analysis of the Bmi1 lineage. (A) Amylase+ cells are Ki-67+ indicating proliferation potential. (B and C) Bmi1 lineage is also Ki-67+. (D–I) Short-term analysis of BrdU incorporation. (D) Schematic representation of the BrdU and the TM treatment. (E) Percentage of YFP+BrdU+ cells at 15, 30, and 120 days. (F) The Bmi1+ lineage in mice fed with BrdU was reduced, with respect to mice never treated with BrdU, at 15 and 30 days, but was comparable at 120 days. (G–I) Representative microscopic fields showing YFP+BrdU+ (white arrowhead), amylase+BrdU+, and amylase+YFP+BrdU+ cells (white arrowhead). (J–N) Long-term BrdU chase to show the persistence of the BrdU lineage. (J) Schematic representation of the whole experiment. (K) Percentage of YFP+BrdU+ cells at 7 months. (L) Comparison of the lineage at 1 and 7 months after 1 TM injection at weaning and at 7 months after 1 injection at 6 months (with and without BrdU). (M and N) Representative pictures of YFP+BrdU+ and amylase+YFP+BrdU+(white arrowhead) cells indicating that those cells were differentiated. (O–Q) BrdU treatment at 8 months after TM treatment. (O) Schematic representation of the TM and BrdU treatments. (P) Percentage of YFP+BrdU+ cells at 9 months. (Q) Representative pancreatic section showing 4 YFP+BrdU+ cells. (Scale bars: 25 μm.)
A different BrdU treatment was used to evaluate whether the BrdU lineage persists over time as the Bmi1+ lineage does. Bmi1Cre-ER/+;Rosa26YFP/+ mice (n = 4) were fed with BrdU-treated water for 7 days after weaning. After 6 months these mice were injected with TM and their pancreas were analyzed after 1 additional month (Fig. 4J). This experiment allowed us to evaluate whether BrdU+YFP+ cells exist after 6 months and whether the BrdU labeled lineage is differentiated, yet still proliferating. The conclusion of this experiment is that BrdU lineage survives for at least 6 months, can still express Bmi1, is still proliferating, and is differentiated (Fig. 4 J–N). Further, the long persistence of the BrDU label suggests that some of these cells are set aside (i.e., not continually proliferating) until needed.
To evaluate whether the Bmi1+ lineage is proliferating during the 1-year chase, we injected Bmi1Cre-ER/+;Rosa26YFP/+ mice (n = 2) with TM at weaning age, then 8½ months later were treated with BrdU for 14 days. Pancreas was then analyzed at the end of the BrdU treatment. Approximately 5% of the YFP+ cells were BrdU+, indicating that the Bmi1+ lineage is capable of entering into replication during the entire course of our experiment.
To determine the number of cells dying at different time points we analyzed the apoptotic acinar cells with TUNEL assay or a specific antibody against cleaved caspase 3. Both techniques showed absence of measurable apoptosis in normal pancreas.
We investigated the expression of CyclinD1, a protein that accumulates during G1 phase and is essential for cell cycle progression (21). CyclinD1 is expressed in some ducts cells, some islet cells, and centroacinar cells (Fig. S2). The expression of CyclinD1 was largely negative in YFP+ cells, confirming that most of the centroacinar cells are not part of the Bmi1 lineage.
Evaluation of the Bmi1 Mosaicism Using Multiple TM Treatments.
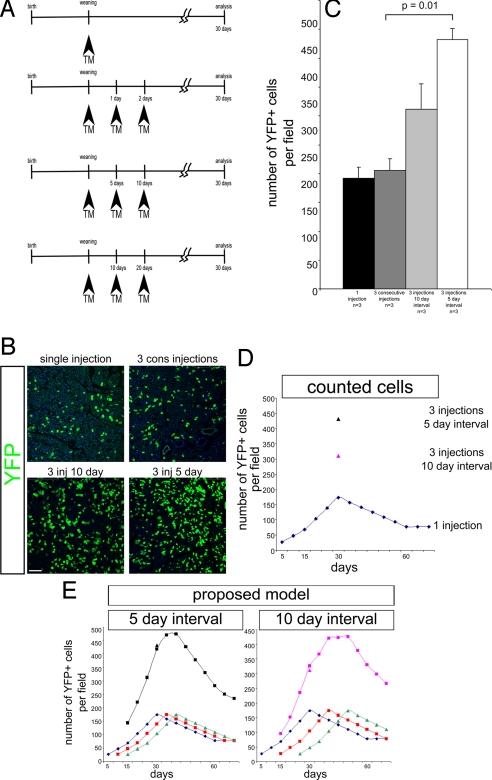
Because only a minority of acini are labeled, we next determined whether this finding reflects incomplete TM labeling. A similar mosaic pattern is present in the Bmi1 lineage of the small intestine (15). In small intestine, a strategic TM injection schedule ruled out TM-related mosaicism (15). The same strategy was applied to analyze pancreatic acinar cells. Three Bmi1Cre-ER/+;Rosa26YFP/+ mice were injected for 3 consecutive days, 3 additional mice were injected once every 5 days for 10 days, and 3 mice were injected every 10 days for 20 days. All mice were killed 1 month after the first injection (Fig. 5 A–C). Three consecutive injections did not show any increase in the number of labeled cells compared with the single injection group; however, the 2-interval experiments showed a higher number of Bmi1+ acinar cells than either 1 injection or 3 consecutive injections (Fig. 5 B and C). The most reasonable explanation for this result is that Bmi1 has cyclical expression in cells in different acini with a periodicity of ≈5 days. Three injections spread 5 (or 10) days apart identify the expression of different nonoverlapping acinar cells generating a “wave” of newly-labeled acini. If each wave generated by each TM injection every 5 (or 10) days labels the same number of Bmi1+ cells, because those cells are probably showing the same proliferative behavior of cells labeled by 1 injection, predictions can be made about the number of cells expected after 1 month with 3 5-day interval (or 10-day interval) treatments. This prediction reflected exactly the number of cells we obtained in our experiment (Fig. 5 D and E). We cannot rule out the possibility that TM bioavailability could represent the alternative explanation of these results. However, what this experiment shows is that the increased exposure to TM will increase the number of labeled acini, indicating that Bmi1 has a more general role in the whole organ homeostasis.
Fig. 5.
Evaluation of the Bmi1 lineage after different TM treatments. (A) Schematic representation of a single treatment, 3 consecutive injections, and 3 injections spaced every 5 or 10 days. All Bmi1Cre-ER/+;Rosa26YFP/+ mice were analyzed 30 days after the first injection. (B and C) Representative pictures and quantitative analysis of pancreatic sections after different treatments. (D) Different representation of counted cells. The continuous curve represents the number of cells present at different days after 1 TM injection. This curve was interpolated by using the cells counted at 5, 15, 30, and 60 days, assuming a constant increase in the number of cells. The black and pink triangles represent the mean of the YFP+ cells counted after 3 injections at 5-day intervals and 3 injections at 10-day intervals. (E) Proposed model showing that if each TM injection activates the same number of cells (blue, red, and green lines) after 30 days the number of expected labeled cells matches the number of obtained cells. The black and pink lines indicate at each day the expected sum of all of the cells present in the pancreas as a result of the 3 different waves. (Scale bars: 100 μm.)
Bmi1 Lineage Analysis After Tissue Damage: Diphtheria Toxin and Caerulein.
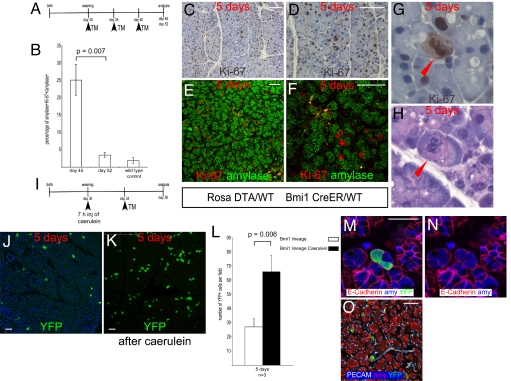
To assess the proliferative activity of acinar cells and the role of Bmi1 lineage after mild injury, we used 2 different models. In 1 experiment the Bmi1 lineage was ablated by using the conditional allele expressing the diphtheria toxin from the Rosa locus (16) on a 3 5-day interval injection schedule. We analyzed the acinar cell population 5 and 12 days after the last injection (Fig. 6A). We observed after 5 days an increased number of cells in mitosis. We counted the number of Ki-67+ cells and found that they were also amylase+ (200 consecutive cells were counted per pancreas), indicating that acinar cells are able to proliferate, after a proliferative stimulus, without an underlying progenitor compartment (Fig. 6 B–H). To evaluate whether the Bmi1 locus was activated after an injury, followed by lineage expansion, we used a caerulein-induced pancreatitis model (22) in Bmi1Cre-ER/+;Rosa26YFP/+ mice (n = 3) (Fig. S3). Five days after caerulein treatment, we injected mice with TM and after 5 more days we harvested pancreas and evaluated the lineage. Bmi1 lineage was increased (Fig. 6 J–L) compared with the lineage without injury, indicating that the Bmi1 lineage is activated and recruited in a compensatory proliferative effort. All of the YFP+ cells were amylase+, PECAM+, and glucagon+ (Fig. 6 M–O), indicating that during the regeneration phase Bmi1 is not expressed in a undifferentiated compartment.
Fig. 6.
Bmi1 lineage ablation. (A) Bmi1Cre-ER/+;Rosa26DTA/+ mice were injected 3 times every 5 days before harvesting pancreas 5 and 12 days after last injection. (B) After 5 days there were many cells in mitosis. Amylase+Ki-67+ cells were counted, compared at 5 and 12 days after injection, and compared with wild-type age-matched control pancreas. (C–H) Representative pictures at low and high magnification showing Ki-67+ cells actively dividing. E and F are low and high magnification, respectively, of amylase+Ki-67+ cells. It was common to observe chromosomes in metaphase (G and H)(red arrowheads). (I–L) Bmi1 lineage after mild pancreatitis. (I) Schematic diagram showing the caerulein treatment followed by TM administration in Bmi1Cre-ER/+;Rosa26YFP/+ mice. (J–L) The Bmi1 lineage was increased compared with the lineage without caerulein treatment. (J and K) Representative pictures at 5 days after TM without and with caerulein. (M–O) Representative pictures showing that after caerulein treatment the Bmi1 lineage is present only in differentiated cells. (Scale bars: 50 μm.)
Discussion
Here, we presented evidence that Bmi1 expression labels a subpopulation of differentiated acinar cells capable of self-renewing for >1 year. This Bmi1+ acinar lineage shows the following features: the lineage persists for >1 year without being supported by an undifferentiated progenitor compartment; the lineage shows self-renewal properties; and, finally, Bmi1 has a cyclical expression with a periodicity of ≈5 days. Bmi1 is expressed within each acinus in 1 or more differentiated acinar cells that retain a proliferative potential, replacing the surrounding dying cells. Moreover, a detailed analysis of acinar repopulation during the first month after TM treatment revealed that all YFP+ cells within a given acinus were uniformly labeled by amylase marker, indicating that both the parent and daughter cells were fully differentiated. Cells positive for amylase and double positive (YFP/amylase) were also Ki-67+, indicating that proliferation of this subpopulation of differentiated cells is a common feature of normal exocrine pancreas and the Bmi1 lineage. Short-term and long-term BrdU tracing analysis confirmed that Bmi1-derived cells are proliferating and differentiated. Using 2 injury models we observed that after cell ablation there is a strong proliferative response of cells that appear to be differentiated both by morphological criteria and molecular marker analysis. Based on all of these experiments the dynamic behavior of the Bmi1 lineage over time can be fully explained solely by the continual self-renewal of a differentiated acinar cell subpopulation. Although it is not possible to rule out the existence of an undifferentiated progenitor compartment, such a pool does not substantially contribute to normal organ homeostasis (physiological or after mild injury).
Usually stem cells proliferate following a symmetric or asymmetric division model (23, 24) or a combination of the two.
A simple model requires that each of the cells expressing Bmi1 at the time of the TM injection would start proliferating to replace 1 or more cells in the same acinus. This first wave of renewal is followed probably after 30 days by the loss of the cells originally labeled, and within the progeny of the Bmi1 lineage fewer cells are still able to proliferate. Moreover during the first months pancreas is still growing. The continuous growth of the organ could dilute the YFP+ cells and explain the apparent loss of the Bmi1 lineage after 1 month. The balance between cell loss and proliferation is achieved at 60 days when a steady number of cells is achieved and it is maintained until 12 months. This behavior probably reflects a peculiar asymmetric division model where only 1 of the daughter acinar cells retains self-renewal/proliferative capacity.
We have only indirect evidence to support this model. Bmi1+ acinar cells show a linear expansion (typical of asymmetric division) followed by a steady-state level. We also tested it at 2 and 4 months, indicating that Bmi1+ acinar cells, are ready to expand, renewing part of the whole acinar structure. The presence of up to 5 cells in some expanded “clones” and fully- or partially-labeled acini at different time points indicates that the originally-labeled cells are going through multiple rounds of duplication and self-renewal. The BrdU long-chase experiments show that the BrdU lineage persists for at least 6 months, representing an indirect and independent confirmation of the persistence of the Bmi1 lineage. YFP+ cells were also still able to proliferate and were amylase+. Moreover, the newly-generated Bmi1+ lineage at 6 months is present in cells that were BrdU-labeled 7 months earlier (4% of the cells were amylase+ YFP+BrdU+). The presence of strong BrdU label in the Bmi1-labeled subpopulation of differentiated acinus cells after a 6-month chase suggests that some of these cells are set aside (nonproliferation), until needed during the life cycle of the mouse. Even very long steady-state cycling of 5 day or more (36 cell cycles) would have washed out this label.
It is interesting to compare the BrdU expression in other organs, like the small intestine, where the Bmi1 lineage is present for 1 year (15). In the small intestine after 15 days the whole epithelium is completely labeled and then progressively over time the BrdU is washed out, the last cells to remain labeled are considered putative stem cells, and the label-retaining ability is usually considered a property of stem cells (25). The immortal strand theory is still highly debated and controversial (26–28). In our BrdU experiments we confirmed (Fig. S4) that after 2–3 months in the small intestine only rare BrdU+ cells are left and probably represent stem cells because they are located in the +4 position (15). At 4 months after BrdU (and beyond) we could not find any significant labeled epithelial cell. The BrdU retention in pancreas after 7 months and lack of labeling in the small intestine, already after 4 months, reflects probably the slower turnover of pancreatic cells compared with the intestinal stem cells, and eventually even in pancreas the BrdU labeling would disappear.
The Bmi1 expression analysis is complicated by the fact that it is difficult to evaluate wild-type expression in adult pancreas because the antibodies used did not show a reliable staining pattern (Fig. S5) and the in situ hybridization is not robust.
Finally, it is important to observe that the “immortal” differentiated acinar population identified by Bmi1 lends support to the cell-of-origin studies that identified the differentiated acinar cell as the source of mouse pancreatic adeno-carcinoma and its preneoplastic lesions (29–33). In the case of exocrine pancreas our study offers the explanation that although well differentiated, the Bmi1 acinar lineage can survive up to 1 year or longer, which could explain why well-differentiated acinar cells can be the cell of origin of pancreatic adeno-carcinoma.
This study, along with the characterization of Bmi1 in the small intestine, uncovers a more general role for Bmi1 not only in self-renewal of classic stem cell, but also in the maintenance of the proliferative ability of differentiated cells. Self-renewal represents a more general property not only of classic stem cells but also of differentiated acinar cells retaining in this way their proliferative state to maintain pancreatic tissue homeostasis.
Materials and Methods
Mouse lines used in this study (Bmi1IresCreER, RosaYFP, RosaLacZ, and RosaDTA) were previously made and genotyped using published conditions and oligos. Tamoxifen (Sigma) was dissolved directly in corn oil (Sigma) at a final concentration of 20 mg/ml. Tamoxifen was injected intraperitoneally in adult mice between postnatal day 30 and 50 at a concentration of 9 mg per 40 gm body weight. A detailed description of methods and antibodies dilution is given in SI Text. All studies and procedures involving animal subjects were approved by the University of Utah Institutional Animal Care and Use Committee and conducted strictly in accordance with the approved animal handling protocol.
Additional Details.
For more information, see SI Text.
Supplementary Material
Acknowledgments.
We thank C. Murtaugh, E. Levine, L. Carroll, P. Tvrdik, K. Kjaer, and K. Thomas for critical reading of the manuscript and the other members of M.R.C.'s laboratory for sharing discussions and ideas; Z. Shuhua for excellent technical assistance; and the members of our tissue culture and mouse facility, in particular S. Barnett, C. Lenz, and J. Tomlin, for their efforts.
Footnotes
The authors declare no conflict of interest.
This article contains supporting information online at www.pnas.org/cgi/content/full/0902508106/DCSupplemental.
References
- 1.Rusch HP. Carcinogenesis: A facet of living processes. Cancer Res. 1954;14:407–417. [PubMed] [Google Scholar]
- 2.Leblond CP. Classification of cell populations on the basis of their proliferative behavior. Natl Cancer Inst Monogr. 1964;14:119–150. [PubMed] [Google Scholar]
- 3.Fitzgerald PJ, Carol BM, Lawrence R. Pancreatic acinar cell regeneration. Nature. 1966;212:594–596. doi: 10.1038/212594a0. [DOI] [PubMed] [Google Scholar]
- 4.Teta M, Rankin MM, Long SY, Stein GM, Kushner JA. Growth and regeneration of adult β cells does not involve specialized progenitors. Dev Cell. 2007;12:817–826. doi: 10.1016/j.devcel.2007.04.011. [DOI] [PubMed] [Google Scholar]
- 5.Dor Y, Brown J, Martinez OI, Melton DA. Adult pancreatic β cells are formed by self-duplication rather than stem-cell differentiation. Nature. 2004;429:41–46. doi: 10.1038/nature02520. [DOI] [PubMed] [Google Scholar]
- 6.Brennand K, Huangfu D, Melton D. All β cells contribute equally to islet growth and maintenance. PLoS Biol. 2007;5:e163. doi: 10.1371/journal.pbio.0050163. [DOI] [PMC free article] [PubMed] [Google Scholar]
- 7.Xu X, et al. β cells can be generated from endogenous progenitors in injured adult mouse pancreas. Cell. 2008;132:197–207. doi: 10.1016/j.cell.2007.12.015. [DOI] [PubMed] [Google Scholar]
- 8.Dor Y, Melton DA. Facultative endocrine progenitor cells in the adult pancreas. Cell. 2008;132:183–184. doi: 10.1016/j.cell.2008.01.004. [DOI] [PubMed] [Google Scholar]
- 9.Strobel O, et al. In vivo lineage tracing defines the role of acinar-to-ductal transdifferentiation in inflammatory ductal metaplasia. Gastroenterology. 2007;133:1999–2009. doi: 10.1053/j.gastro.2007.09.009. [DOI] [PMC free article] [PubMed] [Google Scholar]
- 10.Desai BM, et al. Preexisting pancreatic acinar cells contribute to acinar cell, but not islet β cell, regeneration. J Clin Invest. 2007;117:971–977. doi: 10.1172/JCI29988. [DOI] [PMC free article] [PubMed] [Google Scholar]
- 11.Hayashi S, McMahon AP. Efficient recombination in diverse tissues by a tamoxifen-inducible form of Cre: A tool for temporally regulated gene activation/inactivation in the mouse. Dev Biol. 2002;244:305–318. doi: 10.1006/dbio.2002.0597. [DOI] [PubMed] [Google Scholar]
- 12.Lessard J, Sauvageau G. Bmi-1 determines the proliferative capacity of normal and leukemic stem cells. Nature. 2003;423:255–260. doi: 10.1038/nature01572. [DOI] [PubMed] [Google Scholar]
- 13.Leung C, et al. Bmi1 is essential for cerebellar development and is overexpressed in human medulloblastomas. Nature. 2004;428:337–341. doi: 10.1038/nature02385. [DOI] [PubMed] [Google Scholar]
- 14.Molofsky AV, et al. Bmi-1 dependence distinguishes neural stem cell self-renewal from progenitor proliferation. Nature. 2003;425:962–967. doi: 10.1038/nature02060. [DOI] [PMC free article] [PubMed] [Google Scholar]
- 15.Sangiorgi E, Capecchi MR. Bmi1 is expressed in vivo in intestinal stem cells. Nat Genet. 2008;40:915–920. doi: 10.1038/ng.165. [DOI] [PMC free article] [PubMed] [Google Scholar]
- 16.Wu S, Wu Y, Capecchi MR. Motoneurons and oligodendrocytes are sequentially generated from neural stem cells but do not appear to share common lineage-restricted progenitors in vivo. Development. 2006;133:581–590. doi: 10.1242/dev.02236. [DOI] [PubMed] [Google Scholar]
- 17.Soriano P. Generalized lacZ expression with the ROSA26 Cre reporter strain. Nat Genet. 1999;21:70–71. doi: 10.1038/5007. [DOI] [PubMed] [Google Scholar]
- 18.Means AL, et al. Pancreatic epithelial plasticity mediated by acinar cell transdifferentiation and generation of nestin-positive intermediates. Development. 2005;132:3767–3776. doi: 10.1242/dev.01925. [DOI] [PubMed] [Google Scholar]
- 19.Fujitani Y, et al. Targeted deletion of a cis-regulatory region reveals differential gene dosage requirements for Pdx1 in foregut organ differentiation and pancreas formation. Genes Dev. 2006;20:253–266. doi: 10.1101/gad.1360106. [DOI] [PMC free article] [PubMed] [Google Scholar]
- 20.Taupin P. BrdU immunohistochemistry for studying adult neurogenesis: Paradigms, pitfalls, limitations, and validation. Brain Res Rev. 2007;53:198–214. doi: 10.1016/j.brainresrev.2006.08.002. [DOI] [PubMed] [Google Scholar]
- 21.Vogetseder A, et al. Proliferation capacity of the renal proximal tubule involves the bulk of differentiated epithelial cells. Am J Physiol. 2008;294:C22–C28. doi: 10.1152/ajpcell.00227.2007. [DOI] [PubMed] [Google Scholar]
- 22.Elsässer HP AG, Kern HF. Time course and cellular source of pancreatic regeneration following acute pancreatitis in the rat. Pancreas. 1986;1:421–429. doi: 10.1097/00006676-198609000-00006. [DOI] [PubMed] [Google Scholar]
- 23.Cairns J. Mutation selection and the natural history of cancer. Nature. 1975;255:197–200. doi: 10.1038/255197a0. [DOI] [PubMed] [Google Scholar]
- 24.Morrison SJ, Kimble J. Asymmetric and symmetric stem-cell divisions in development and cancer. Nature. 2006;441:1068–1074. doi: 10.1038/nature04956. [DOI] [PubMed] [Google Scholar]
- 25.Potten CS, Owen G, Booth D. Intestinal stem cells protect their genome by selective segregation of template DNA strands. J Cell Sci. 2002;115:2381–2388. doi: 10.1242/jcs.115.11.2381. [DOI] [PubMed] [Google Scholar]
- 26.Lansdorp PM. Immortal strands? Give me a break. Cell. 2007;129:1244–1247. doi: 10.1016/j.cell.2007.06.017. [DOI] [PubMed] [Google Scholar]
- 27.Rando TA. The immortal strand hypothesis: Segregation and reconstruction. Cell. 2007;129:1239–1243. doi: 10.1016/j.cell.2007.06.019. [DOI] [PubMed] [Google Scholar]
- 28.Kiel MJ, et al. Haematopoietic stem cells do not asymmetrically segregate chromosomes or retain BrdU. Nature. 2007;449:238–242. doi: 10.1038/nature06115. [DOI] [PMC free article] [PubMed] [Google Scholar]
- 29.Stanger BZ, et al. Pten constrains centroacinar cell expansion and malignant transformation in the pancreas. Cancer Cell. 2005;8:185–195. doi: 10.1016/j.ccr.2005.07.015. [DOI] [PubMed] [Google Scholar]
- 30.Guerra C, et al. Chronic pancreatitis is essential for induction of pancreatic ductal adenocarcinoma by K-Ras oncogenes in adult mice. Cancer Cell. 2007;11:291–302. doi: 10.1016/j.ccr.2007.01.012. [DOI] [PubMed] [Google Scholar]
- 31.Murtaugh LC, Leach SD. A case of mistaken identity? Nonductal origins of pancreatic “ductal” cancers. Cancer Cell. 2007;11:211–213. doi: 10.1016/j.ccr.2007.02.020. [DOI] [PubMed] [Google Scholar]
- 32.Habbe N, et al. Spontaneous induction of murine pancreatic intraepithelial neoplasia (mPanIN) by acinar cell targeting of oncogenic Kras in adult mice. Proc Natl Acad Sci USA. 2008;105:18913–18918. doi: 10.1073/pnas.0810097105. [DOI] [PMC free article] [PubMed] [Google Scholar]
- 33.De La OJ, et al. Notch and Kras reprogram pancreatic acinar cells to ductal intraepithelial neoplasia. Proc Natl Acad Sci USA. 2008;105:18907–18912. doi: 10.1073/pnas.0810111105. [DOI] [PMC free article] [PubMed] [Google Scholar]
Associated Data
This section collects any data citations, data availability statements, or supplementary materials included in this article.


