Abstract
Glucocorticoid receptor α (GRα) and peroxisome proliferator-activated receptor α (PPARα) are transcription factors with clinically important immune-modulating properties. Either receptor can inhibit cytokine gene expression, mainly through interference with nuclear factor κB (NF-κB)-driven gene expression. The present work aimed to investigate a functional cross-talk between PPARα- and GRα-mediated signaling pathways. Simultaneous activation of PPARα and GRα dose-dependently enhances transrepression of NF-κB-driven gene expression and additively represses cytokine production. In sharp contrast and quite unexpectedly, PPARα agonists inhibit the expression of classical glucocorticoid response element (GRE)-driven genes in a PPARα-dependent manner, as demonstrated by experiments using PPARα wild-type and knockout mice. The underlying mechanism for this transcriptional antagonism relies on a PPARα-mediated interference with the recruitment of GRα, and concomitantly of RNA polymerase II, to GRE-driven gene promoters. Finally, the biological relevance of this phenomenon is underscored by the observation that treatment with the PPARα agonist fenofibrate prevents glucocorticoid-induced hyperinsulinemia of mice fed a high-fat diet. Taken together, PPARα negatively interferes with GRE-mediated GRα activity while potentiating its antiinflammatory effects, thus providing a rationale for combination therapy in chronic inflammatory disorders.
Keywords: cross-talk, gluconeogenesis, inflammation, hyperinsulinema, side effects
Glucocorticoids (GCs) are presently the most potent drugs for the treatment of acute and chronic inflammatory diseases. Nevertheless, side effects such as osteoporosis, muscle wasting, hypertension, behavioral alterations, and disorders of glucose (Glc) and lipid metabolism, burden their therapeutical use. GCs mediate their effect via the glucocorticoid receptor α (GRα), a member of the nuclear receptor superfamily. After binding of GCs, a conformational change in the receptor is induced, releasing cytosolic chaperoning proteins followed by GRα translocation into the nucleus. Activated GRα can directly regulate the expression of its target genes through GRα binding onto promoter-imbedded GREs. Target genes of GRα homodimers include proteins involved in Glc, fat, and protein metabolism. Alternatively, GRα can also influence gene expression by interfering with the activity of nuclear factor κB (NF-κB), a key regulatory proinflammatory transcription factor (1). Peroxisome proliferator-activated receptor α (PPARα), a ligand-activated transcription factor, also belonging to the nuclear receptor superfamily, is highly expressed in liver, skeletal and cardiac muscle, kidney, and in cells involved in inflammatory processes. Besides its involvement in lipid and Glc metabolism, PPARα exhibits potent antiinflammatory properties. Recently, a protective role for PPARα has also been demonstrated in obesity-induced hepatic inflammation (2). Fatty acid derivates and hypolipidemic fibrates are natural and synthetic PPARα ligands, respectively. Upon ligand activation, PPARα forms a heterodimer with the 9-cis-retinoic acid receptor (RXR), generating a complex that binds on PPAR-responsive elements (PPRE) (reviewed in ref. 3). In addition, in different cellular models PPARα represses gene expression in a DNA-binding-independent manner by inhibiting the activity of other proinflammatory transcription factors, such as NF-κB and activator protein 1 (AP-1) (4, 5). Because both activated GRα and PPARα can inhibit NF-κB-driven gene expression, we explored the effect of simultaneous activation of both nuclear receptors on proinflammatory gene expression and investigated the effect of PPARα agonists on GRE-driven gene expression. Our results show that ligand-activated PPARα counteracts GRE-dependent gene expression via a nuclear mechanism, involving key residues in the DNA-binding domain (DBD) of PPARα. PPARα further interferes with GRα and RNA pol II recruitment to GRE-containing promoter elements, which correlates with a decreased GRE-driven gene expression. In sharp contrast, activated PPARα does not antagonize, but rather cooperates with, hormone-activated GRα to block NF-κB-driven gene expression, resulting in enhanced antiinflammatory properties.
The diminished activation potential of GRα together with its increased repression activity upon coactivation of PPARα opens up an interesting strategy for the treatment of steroid-dependent chronic inflammatory disorders in man because certain GC-mediated side effects, e.g. hyperglycemia further leading to insulin resistance, could possibly be attenuated by a combination therapy of GCs and PPARα agonists. This hypothesis was corroborated by demonstrating that treatment with fenofibrate (FENO) antagonizes the GC-induced worsening of hyperinsulinemia in mice fed a high-fat diet.
Results
PPARα and GRα Cooperate to Inhibit NF-κB-Driven Gene Expression.
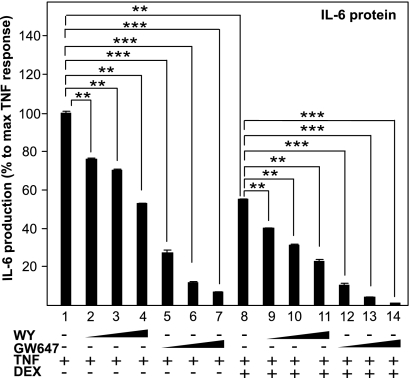
Because both activated PPARα and GRα inhibit inflammation through interfering with the activity of NF-κB (1, 4), we studied the effect on IL-6 cytokine production upon combining different specific PPARα agonists with the GRα agonist dexamethasone (DEX). WY-14643 (WY), GW647, and DEX separately indeed inhibited TNF-induced IL-6 production in a dose-responsive manner in L929sA cells (Fig. 1). Control experiments with solvent and compounds alone had negligible effects on basal IL-6 production. Simultaneous activation of PPARα and GRα resulted in an additive repression of IL-6 production (Fig. 1). L929sA cells, stably transfected with p(IL6κB)350hu.IL6P-luc+, an NF-κB-dependent recombinant promoter construct, showed a very similar regulation, confirming that NF-κB is one of the main targets of which the activity is additively inhibited by GCs and PPARα agonists [supporting information (SI) Fig. 1A]. These data were confirmed in A549 cells at the mRNA level, via quantitative RT-PCR (QPCR) analysis for other inflammatory markers, namely monocyte chemoattractant protein 1 (MCP-1) and matrix metalloproteinase 9 (MMP-9) (Fig. S1B). Finally, microarray analysis of RNA isolated from primary murine hepatocytes, cotreated with GCs and fibrates, demonstrated cooperativity on gene expression regulation of several inflammatory markers, including Ccl2 (MCP-1), Ccl20, Cxcl2, Cxcl3, and VCAM1, indicating a cell type-independent effect of combined GC and PPARα agonist treatment (Fig. S1C).
Fig. 1.
PPARα agonists and GCs cooperatively inhibit IL-6. L929sA cells with stably integrated p(IL6κB)350hu.IL6P-luc+ were preincubated with solvent, DEX (0.01 μM), GW647(1, 0.5, or 0.25 μM), WY (2, 5, or 10 μM) or various combinations thereof, for 1 h, before TNF (200 units/mL) was added, where indicated, for 24 h. Medium was collected to perform a murine IL-6 ELISA. Protein levels obtained in nanograms per milliliter are calculated as percentage of maximum TNF response. Results are shown ± SD. **, P < 0.01; ***, P < 0.001. The luc assays are shown in Fig. S1A.
PPARα Agonists Block Induction of GC-Responsive Genes by Suppression of GRE-Driven Gene Transcription.
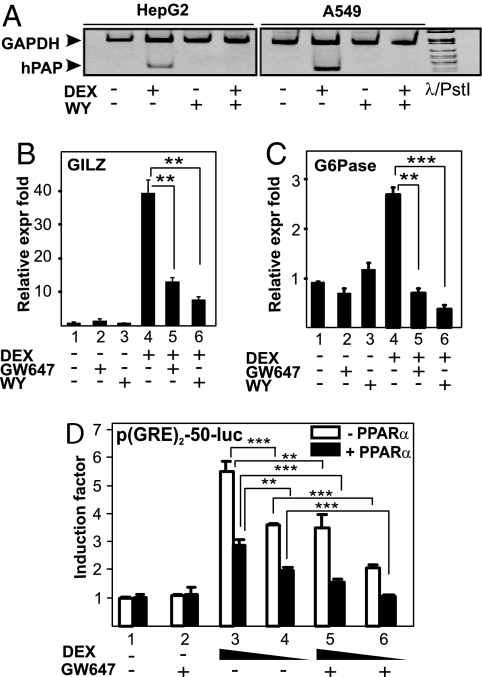
Activated GRα and PPARα bind onto distinct promoter-responsive elements and are thus thought to regulate target gene expression via independent pathways. To check possible cross-talk mechanisms, we tested whether PPARα agonists could influence GRα-mediated GRE-driven gene expression. By using semi-QPCR and QPCR, the effect of different PPARα agonists on GC-induced mRNA expression of GC-inducible genes, containing in their promoter region one or more functional GRE elements onto which GRα binds as a homodimer, was measured. As expected, DEX up-regulated mRNA expression levels of human placental alkaline phosphatase (hPAP) in HepG2 human hepatocyte cells and A549 cells (Fig. 2A). Treatment with WY alone had no effect on hPAP mRNA expression. Remarkably, when cells were cotreated with DEX and WY, hPAP mRNA levels were significantly inhibited compared with DEX alone (Fig. 2A). Similar results were obtained for other GC-inducible genes, namely glucocorticoid-induced leucine zipper (GILZ) in HepG2 (Fig. 2B). The combined effect of DEX and the PPARα agonists WY and GW647 also resulted in a significant gene-inhibitory effect on glucose-6-phosphatase (G6Pase), a hepatic GC-regulated gene, in FTO2B rat hepatocytes (Fig. 2C), further extending the cell type- and species-independent character of our findings.
Fig. 2.
PPARα agonists efficiently block GRE-driven gene expression. A549 (A), HepG2 (A and B) and FTO2B (C) cells were treated with solvent, DEX (1 μM), GW9578 (500 nM), or WY (10 μM) or various combinations for 8 h (A) or 3 h (B and C). mRNA was isolated and reverse transcribed, and cDNA was subjected either to semiquantitative PCR analysis (A) with primers to detect GAPDH (loading control) or hPAP in the same sample, or to SYBR green QPCR (B and C) with primers to detect G6Pase or GILZ. QPCR measurements were performed in triplicate. QPCR results, normalized to expression of household genes, are shown ± SD. Results are represented as relative expression fold, i.e., with the solvent-treated control value taken as 1. (D) HepG2 cells were transiently transfected with p(GRE)2-50-luc and pSG5PPARα (filled bars) or pSG5 (open bars). Twenty-four hours later, cells were treated with solvent, DEX (1 or 0.1 μM), GW647 (500 nM), or various combinations, for a total period of 8 h. Cell lysates were assayed for luc activities and normalized for β-gal activities. Promoter activities are expressed as relative induction factor, i.e., the ratio of expression levels of induced versus noninduced conditions.
To determine whether the effect of PPARα ligands on GRα-induced gene expression occurs via interference with GRE-mediated gene transcription, we explored the effect of GW647 on the activity of DEX-induced p(GRE)2-50-Luc, a recombinant GRE-driven reporter gene. As expected, DEX, in contrast to GW647, strongly activated the promoter in a dose-dependent manner (Fig. 2D, open bars). However, when combined with GW647 (Fig. 2D, open bars) the induction was inhibited, confirming the results of mRNA analysis (Fig. 2 A–C). Furthermore, overexpression of PPARα (Fig. 2D, filled bars) resulted in a ligand-independent decrease of DEX-induced luciferase (luc) activity. This partially ligand-independent effect is a typical characteristic of PPARα in overexpression systems. The transcriptional inhibition was further enhanced in the presence of GW647 (Fig. 2D, filled bars). Finally, PPARα agonists do not block GRα-mediated gene expression by influencing the level of GRα protein because GRα protein levels, assayed from the same lysates used for the luc measurements, remain unaffected under the various treatment combinations (Fig. S2).
PPARα Agonists Inhibit GC-Induced Gene Expression in Primary Hepatocytes in a PPARα-Dependent Manner.
To verify the involvement of PPARα, we tested whether activated PPARα interferes with GR-mediated gene expression in murine primary hepatocytes isolated from wild-type (WT) and PPARα-knockout (KO) mice. As a positive control, the effect of PPARα ligands was tested on pyruvate dehydrogenase kinase 4 (PDK-4), a representative PPARα target gene. As expected, treatment with GW9578 and WY resulted in a significant increase of PDK-4 mRNA levels only in WT cells (Fig. 3A). As expected, mRNA expression levels of GILZ and SGK1 were substantially up-regulated upon treatment with DEX in primary hepatocytes from both PPARα WT and mutant mice (Fig. 3 B and C). In WT cells, this induction was significantly inhibited by cotreatment with WY or with GW9578. In contrast, the PPARα ligands did not affect the GC-induced expression of GILZ or SGK1 in hepatocytes isolated from PPARα KO mice (Fig. 3 B and C), indicating that the inhibitory effect of the PPARα ligands is PPARα-dependent indeed.
Fig. 3.
PPARα agonist-mediated inhibition of GC-induced gene expression is PPARα dependent. (A) Primary hepatocytes isolated from PPARα KO mice (open bars) or from WT mice (filled bars) were treated with solvent or GW9578 (500 nM) or WY (10 μM) for 24 h. mRNA was isolated, reverse transcribed, and subjected to QPCR with primers to detect PDK-4. (B) Primary hepatocytes from PPARα KO mice (open bars) or from WT mice (filled bars) were treated with solvent, GW9578 (500 nM), WY (10 μM), DEX (1 μM), or various combinations thereof, as indicated, for 24 h. mRNA was isolated, reverse transcribed, and subjected to QPCR by using primers to detect GILZ or SGK1 (B and C, respectively). QPCR measurements were performed in triplicate, and the normalized results are represented as expression folds, i.e., taking the control value as 1 and shown ± SD.
PPARα Agonists Inhibit GC-Induced Gene Expression in Vivo.
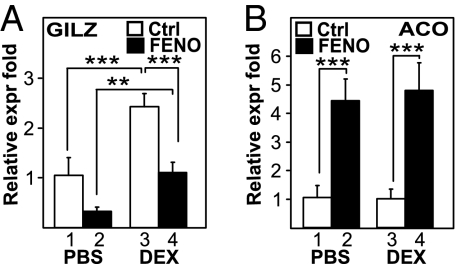
We investigated the effect of the clinically used PPARα agonist FENO in vivo by assaying the levels of GILZ mRNA in mouse liver (Fig. 4A). As expected, DEX-treated mice showed a significant increase in GILZ mRNA levels compared with the control group (P < 0.0001) (Fig. 4A). Cotreatment with DEX and FENO significantly inhibited GILZ mRNA levels compared with DEX alone (P < 0.0001) (Fig. 4A), confirming our previous findings (Fig. 2). A decrease in basal GILZ mRNA gene expression was also apparent in FF-treated mice compared with control mice (Fig. 4A), an effect most likely caused by the antagonism of activated PPARα on basal levels of GILZ expression by endogenously and systemically present GCs, in line with an in vivo PPARα and GRα cross-talk. As a positive control for the activity of FENO, acyl CoA oxidase (ACO) mRNA expression (Fig. 4B) and liver weights (Fig. S3A) were measured. DEX treatment alone had no effect on ACO mRNA, whereas treatment with FENO resulted in a significant induction of ACO mRNA levels. Simultaneous treatment with both FENO and DEX had no additional effect compared with FENO alone (Fig. 4B). Interestingly, PPARα agonists do not influence all GC-controlled processes, e.g., the GC-induced loss of thymus weight remained unaffected (Fig. S3B), arguing for a target gene selectivity of the cross-talk.
Fig. 4.
Activation of PPARα inhibits GC-induced gene expression in vivo. Groups of 6 mice per group, randomized according to their weight, were treated with either DEX (10 mg/kg, i.p.) or an equal volume of normal saline, and/or FENO (200 mg/kg, gavage) or an equal volume of 0.5% CMC (control) every day for a period of 5 days. GILZ (A) and ACO (B) mRNA expression levels from the liver were quantified via QPCR and normalized for household gene expression. Results from triplicate experiments are shown ± SD. Results are represented as relative expression fold, i.e., with the solvent-treated control value taken as 1.
PPARα Antagonizes a Combined High-Fat Diet and GC-Mediated Hyperinsulinemia in Vivo.
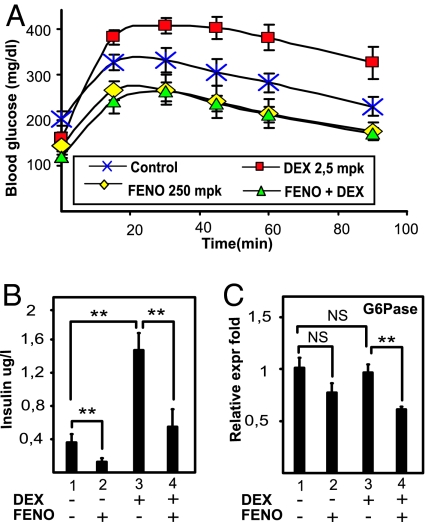
To determine whether the antagonism between GRα and PPARα may be of potential clinical importance with respect to the development of insulin resistance, the influence of DEX and/or FENO on Glc homeostasis was tested in a model of a hyperinsulinemic mouse fed a high-fat diet. Treatment with DEX for 7 days aggravated Glc intolerance, as demonstrated by an i.p. Glc tolerance test (IPGTT) (Fig. 5A) and elevated plasma insulin levels (Fig. 5B). Treatment with the PPARα agonist FENO improved Glc tolerance, as expected (6) (Fig. S4). Excitingly, the combination of FENO with DEX completely prevented the DEX-mediated Glc intolerance and hyperinsulinemia (Fig. 5 A and B). Surprisingly, upon measuring the levels of liver G6Pase (Fig. 5C) DEX was not able to stimulate G6Pase gene expression further, possibly because of the very high insulin levels that may counteract the DEX-mediated induction of GRE-driven genes (7). However, and in line with our model, cotreatment with FENO and DEX significantly inhibited G6Pase mRNA levels compared with DEX alone (P < 0.01).
Fig. 5.
Activation of PPARα counteracts GC-induced Glc intolerance in vivo. (A) Groups of 6 mice per group with an acquired hyperinsulinemia through the intake of a high-fat diet for 7 weeks were daily treated with either PBS (control), DEX (2,5 mg/kg), FENO (200 mg/kg), or DEX/FENO combined, for 7 days, after which an IPGTT was performed, measuring blood Glc levels before and 15, 30, 45, 60, and 90 min after a Glc injection. Results are shown ± SD. *, P < 0.05. (B) Insulin levels from the different groups were measured after 16 h of fasting. (C) Liver G6Pase mRNA expression levels were quantified by QPCR and normalized for household gene expressions. Results from triplicate experiments are shown ± SD.
The Functional Interference Between GRα and PPARα Involves Different Domains of the PPARα Protein.
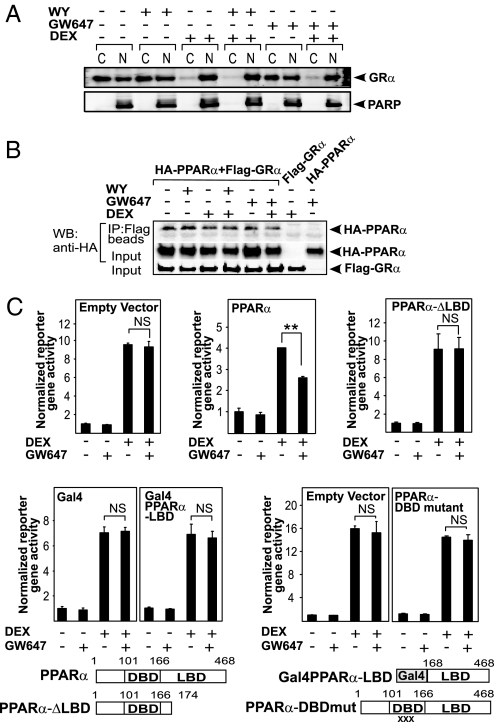
Because GRα moves from the cytoplasm to the nucleus upon hormone binding, we wondered whether activated PPARα would be able to influence the subcellular localization of activated GRα. Thus, a cellular fractionation assay in BWTG3 cells was performed. In untreated or PPARα ligand-treated cells, a majority of GRα protein resided in the cytoplasm, although a substantial amount was also present in the nucleus (Fig. 6A). DEX stimulation for 1 h led to a mainly nuclear GRα distribution, which remained unaffected by cotreatment with PPARα ligands (Fig. 6A and Fig. S5A). PPARα was found to be predominantly nuclear, regardless of the treatment (Fig. S5B). Coimmunoprecipitation analysis by using nuclear extracts of HEK293T cells in which differently tagged receptor variants, FLAG-GRα and HA-PPARα, were overexpressed (Fig. 6B), demonstrated that PPARα and GRα can physically interact. Unexpectedly, however, this interaction was ligand-independent. This finding was confirmed in GST pulldown and in immunoprecipitation assays of endogenous proteins using BWTG3 cells (Fig. S6). Domain-mapping experiments nevertheless suggested that the ligand-binding domains (LBDs) of both receptors are important for a physical interaction (Fig. S7). To determine whether the direct interaction is functionally meaningful, we performed complementation experiments in HEK293T cells (which do not express functionally active GRα and PPARα), transiently transfected with a GRE-driven reporter gene coupled to luciferase, a GRα expression vector and either an empty control, PPARα full-length, PPARα-ΔLBD, PPARα-LBD, or a PPARα-DBD mutant expression vector. When the LBD of PPARα is deleted, the functional antagonism on GRα-mediated GRE-driven gene expression is completely lost (Fig. 6C). However, the PPARα-LBD on its own is apparently not sufficient to mediate the antagonism either. Surprisingly, a mutated PPARα, unable to bind PPRE elements and to transactivate a PPRE-driven reporter gene (Fig. S8), is also unable to mediate the functional antagonism, suggesting the involvement of the DBD. Similar results were obtained by using WY instead of GW647.
Fig. 6.
Multiple domains of PPARα are involved in a functional interference with GRE-driven gene expression. (A) After serum starvation in phenol red-free medium for 24 h, BWTG3 cells were treated with solvent (NI) or induced with DEX (1 μM), WY (50 μM), GW647 (500 nM), or various combinations thereof for 1 h upon which cells were subjected to a cellular fractionation assay. Western blot analysis was performed by using an anti-GR Ab. Simultaneous probing with an anti-PARP Ab served as a control for the fractionation efficiency. The displayed bands were blotted onto two different membranes. C, cytoplasmic; N, nuclear. (B) Equal amounts of differently tagged receptor variants were transfected in HEK293T cells. Cells were stimulated as indicated in the figure followed by coimmunoprecipitation analysis of the nuclear fraction using anti-FLAG beads and immunoblotting with an anti-HA antibody. Input controls for FLAG-GRα and HA-PPARα were verified by Western blot analysis using anti-FLAG and anti-HA, respectively. A representative of two independent experiments is shown. (C) Equal amounts of the corresponding empty vectors or PPARα receptor variants were transfected together with p(GRE)2-50-luc, pSVhGRα, and the β-galactosidase-expressing plasmid in HEK293T cells. Cells were stimulated for 8 h. Cell lysates were assayed for luc activities and normalized for β-gal activities. Promoter activities are expressed as relative induction factor, i.e., the ratio of expression levels of induced versus noninduced conditions. A representative of 4 independent experiments is shown. XXX marks the triple-point mutations D140C/R141D/S142A.
PPARα Agonists Interfere with the Recruitment of Activated GRα at a Classical GRE-Containing Promoter.
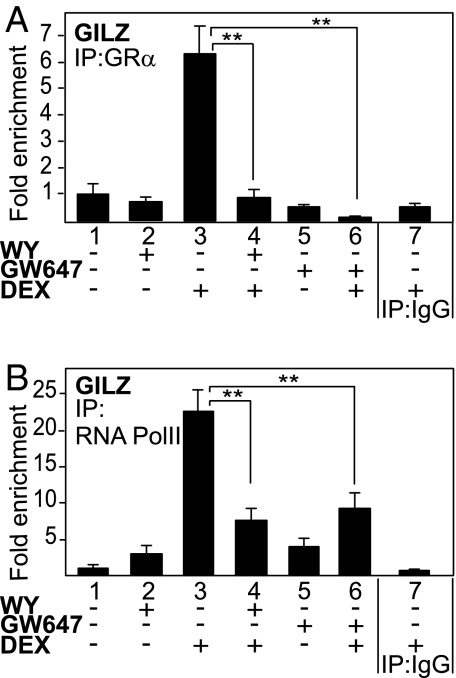
To explore whether activated PPARα may interfere with the recruitment of activated GRα on GRE-driven promoters, ChIP assays were performed with primer pairs encompassing the classical GRE in the GILZ promoter. As expected, we did not observe any GRα occupancy in either solvent-treated or PPARα ligand-treated cells, whereas a significant GRα recruitment was observed upon DEX stimulation (Fig. 7A). In contrast, cotreatment with the PPARα ligands WY or GW647 abrogated DEX-induced GRα recruitment. RNA pol II recruitment, a marker for induced promoter activity, was also enhanced upon DEX stimulation, whereas combination treatment of DEX and PPARα ligands inhibited this recruitment significantly (Fig. 7B), hence correlating with the recruitment pattern observed for GRα. The fact that activated PPARα interferes with GRα- and concomitant RNA pol II promoter recruitment provides a mechanistic basis for the gene-repressive effects of activated PPARα on GRα-mediated gene transcription.
Fig. 7.
PPARα agonists interfere with the recruitment of GRα onto the GRE-driven GILZ promoter. After serum starvation for 48 h, A549 cells were incubated with solvent, DEX (1 μM), WY (50 μM), GW647 (500 nM), or various combinations for 2 h. Cross-linked and sonicated cell lysates were subjected to ChIP analysis against GR (A) or RNA pol II (B). QPCR was used to assay recruitment at the GILZ gene promoter. The quantity of GR or RNA pol II detected on the GILZ promoter is shown with a correction of the SYBR Green QPCR signal for input control. Lanes 1–6 are performed with the specific Ab, as indicated in the graph; lane 7 includes the IgG control. The reaction was performed in triplicate.
Discussion
Our results show that PPARα agonists can block the induction of a number of GC-responsive GRE-driven genes (Fig. 2), in a PPARα-dependent manner (Fig. 3). This antagonism can also occur in vivo, as demonstrated for hepatic GILZ expression, suggesting a possible physiological relevance for our findings (Fig. 4A).
The molecular mechanism of the unexpected antagonizing cross-talk at the level of GRE-driven gene expression, resulting in the transcriptional targeting of GRα-mediated gene expression by activated PPARα (Fig. 2D), is likely to occur in the nucleus and depends on different functional domains of PPARα (Fig. 6 and Fig. S5). Although domain interaction experiments suggested that both the LBD of GRα and PPARα are necessary for an optimal physical interaction (Fig. S7), it turns out that the LBD of PPARα on its own is not sufficient to mediate the functional antagonism (Fig. 6C). Intriguingly, the physical interaction between nuclear PPARα and GRα occurs independently of the presence of either agonist in various interaction assays and using various cell types (Fig. 6B and Fig. S6). Because the fractionation assay (Fig. 6A) demonstrates that part of the apo-GRα pool already resides in the nucleus and because apo-PPARα is found predominantly in the nucleus (Fig. S5B), our results suggest that (a fraction of) unliganded PPARα and GRα can be associated together in the nucleus at all times. In support, ligand-dependent and ligand-independent regulations of nuclear receptor biology, mainly with respect to coregulator associations, have been reported before (8). However, because the physical interaction between endogenous PPARα and GRα does not increase upon ligand addition, it is possible that the functional interference mechanism is not linked directly to this physical interaction, but alternatively might involve GRα modifications induced by the PPARα ligand. Additionally, our data suggest that the DBD of PPARα is essential for the functional interference with GRα-mediated transactivation (Fig. 6C). ChIP analysis of the endogenous GILZ promoter provided a strong mechanistic clue as to how PPARα inhibits GRE-controlled gene expression (Fig. 7). PPARα agonists clearly interfere with the physical recruitment of activated GRα onto the promoter (Fig. 7A), and the PPARα-dependent inhibition of GRα recruitment further coincides with a decrease of RNA polymerase II recruitment (Fig. 7B). Different hypotheses can explain how activated PPARα inhibits hormone-induced GRα recruitment onto its GRE element, including degradation of GRα protein levels or exclusion of GRα from the nuclear compartment. However, PPARα agonists affected neither total GRα protein levels nor liganded GRα subcellular localization (Fig. S2, Fig. 6A, and Fig. S5A). Taken together, the gene expression and ChIP data entail that a functional and mechanistic cross-talk in the nucleus takes place after ligand binding and that it involves several domains of PPARα.
A broad consensus exists that GCs exert their antiinflammatory effects via inhibition of NF-κB whereas part of the detrimental side effects is ascribed to originate from the transactivation capacities of GC-induced GRα (9). Recent evidence suggests that antiinflammatory actions of GCs could also partially depend on the induction of antiinflammatory mediators (10), of which GILZ is one example. Although PPARα agonists block GRE-driven GILZ gene expression, we found that PPARα and GRα cooperate to repress proinflammatory NF-κB-driven gene expression in fibroblast and lung epithelial cells, as exemplified by the inhibition of TNF-induced IL-6, MCP-1, and MMP-9 gene expression (Fig. 1 and Fig. S1B). In addition, a microarray analysis revealed that PPARα agonists also potentiate the antiinflammatory effect of DEX in primary murine hepatocytes (Fig. S1C). Recently, Riccardi and colleagues (11) tested the efficacy of DEX in carrageenan-induced pleurisy in PPARα KO and WT mice. These authors found that the DEX-mediated antiinflammatory activity was lower in PPARα KO compared with WT mice. Furthermore, in WT mice the DEX-mediated antiinflammatory activity was increased when combined with PPARα agonist treatment, an observation in agreement with our results.
Proof-of-principle showing that combination therapies may result in an overall improved benefit to side effect ratio in long-term antiinflammatory strategies was obtained by demonstrating that PPARα agonist treatment inhibited GC-induced Glc intolerance and GC-aggravated hyperinsulinemia in vivo (Fig. 5 A and B and Fig. S4). In the high-fat diet fed mouse model, however, classical GRE-driven genes involved in Glc metabolism, exemplified here by G6Pase, were not further stimulated by DEX (Fig. 5C). Because insulin is known to decrease hepatic gluconeogenesis by inhibiting GC-stimulated gene transcription and to have a dominant effect over GCs, the hyperinsulinemic state of this model (Fig. 5B) may possibly interfere with GRE-driven gene induction (12, 13). Nevertheless, cotreatment of FENO and DEX resulted in significantly lower G6Pase mRNA levels compared with DEX alone, corroborating the occurrence of an in vivo cross-talk between PPARα and GRα (Fig. 5C). From a therapeutical perspective, it is tempting to speculate that there might be an added clinical value by combining GCs and fibrates. Our findings, however, contrast with previous studies in LDL-receptor KO mice, where the combination of PPARα and GRα activation was found to enhance gluconeogenesis (14). In the LDL-receptor KO background, GCs increased hepatic gluconeogenic gene expression in a PPARα-dependent manner, suggesting a role for PPARα in promoting GC-induced insulin resistance (14). It was further reported by the same group that FENO could not correct DEX-mediated resistance to insulin-induced suppression of hepatic Glc production in man (15). Interestingly and completely in line with our findings, in the same clinical study DEX increased basal hepatic Glc production in healthy individuals, whereas combination treatment with FENO decreased DEX-induced hepatic Glc production to baseline or FENO only levels (15).
Combined intake of GCs and fibrates may be beneficial in chronic inflammation, not only because of a potential improvement of the side effect profile, but also because lower doses of GCs may be used with similar, or even better, efficacies with regard to inflammatory control. Analogously, Glass and colleagues (16) proposed that combination treatment with GCs and PPARγ or LXR agonists would allow a lower dosage of GCs to obtain therapeutically relevant antiinflammatory effects.
In conclusion, our findings open up perspectives for the control of immune/inflammatory responses by GRα and PPARα and suggest new approaches for the treatment of inflammatory diseases, where a strong preference is given to inflammatory gene repression (via the additive effect of PPARα and GRα) and where the GRE-linked side effects, e.g., hypertension or gluconeogenesis leading to diabetes, may be less prominent because of the observed antagonism between PPARα and GRα.
Materials and Methods
Reagents.
DEX, FENO, and WY were all from Sigma. GW647 and GW9578 were described in ref. 17. Anti-GR, anti-PPARα, anti-RNA pol II, and anti-PARP Abs were from Santa Cruz Biotechnology.
To increase the validity of our findings, specific PPARα agonists were used: WY-14643 (WY), EC50 for hPPARα: 5 μM, for mPPARα: 0,63 μM; GW9578, EC50 for hPPARα: 50 nM, for mPPARα: 5 nM; GW647, EC50 for human PPARα: 6 nM, for mPPARα: 5 nM; and fenofibrate (FENO), EC50 for hPPARα: 30 μM, for mPPARα: 18 μM.
Plasmids.
p(GRE)2-50-luc, Gal4-PPARαLBD, pSG5-PPARα, and PPARα-ΔLBD were described (4, 9). The last two were recloned to obtain HA-tagged PPAR variants. pSVhGRα and pMMTV-luc were generous gifts from F. Claessens (KUL). A triple-point mutation in mPPARα, D140C/R141D/S142A, was constructed via site-directed mutagenesis by using the QuikChange site-directed mutagenesis kit (Stratagene). The mutated cDNA has been verified by sequencing, EMSA, Western blot analysis, and transcriptional assays.
Cell Culture.
L929sA and HEK293T cells were maintained in DMEM plus 5% newborn calf serum, 5% FCS, 100 units/mL penicillin, and 0.1 mg/mL streptomycin. BWTG3 and A549 cells were grown in DMEM plus 10% FCS, 100 units/mL penicillin, and 0.1 mg/mL streptomycin. Human hepatoma HepG2 cells were cultured likewise plus 1% nonessential aa. Rat FTO2B hepatoma cells were maintained in DMEM:F-12 (1:1) (Invitrogen) plus 10% FCS, 100 units/mL penicillin, and 0.1 mg/mL streptomycin. All cell lines were verified to express GRα and PPARα receptors endogenously.
Isolation of Primary Mouse Hepatocytes.
Mouse hepatocytes were isolated by collagenase perfusion from livers of WT and PPARα KO (PPARα−/−) mice essentially by using the collagenase method (18).
Mice Handling.
Female C57BL6J mice were used at 8 weeks. Mice were randomized to 4 groups (6 mice per group) and matched for body weight. Animals were killed by cervical dislocation after which thymus and liver were recovered and weighed. Total RNA was extracted from liver as described below. ANOVA was used for all analyses, followed by Scheffé post hoc tests for treated vs. control comparisons. The level of significance for all statistical analyses is set at P < 0.05. Male C57BL6 mice were subject to a high-fat diet, containing 36.4% lard (UAR) for 7 weeks, after which they were randomized to 4 groups according to weight and blood Glc, and daily treatment with reference compounds as stated in the legend of Fig. 5 was started. After 7 days of treatment, mice were fasted for 6 h, after which an IPGTT was performed. Blood Glc levels were determined before and 15, 30, 45, 60, and 90 min after Glc injection. Statistical differences were explored via the Mann–Whitney U test. Upon further treatment and sacrifice at day 14, blood plasma was collected to measure insulin, and mRNA was isolated from the livers. Experiments were carried out conforming ethical guidelines of the Pasteur Institute in Lille (France).
Transfection Assays.
HepG2 and BWTG3 cells were transiently transfected by using Lipofectamine, HEK293T cells by using CaPO4. Stable transfection of L929sA cells was performed by a standard CaPO4 procedure.
Reporter Gene Analysis.
Luc and β-gal assays were carried out according to instructions of the manufacturer (Promega). Luc activity, expressed in arbitrary light units, was corrected for the protein concentration in the sample by normalization to constitutive β-gal levels. β-Gal levels were quantified with a chemiluminescent reporter assay Galacto-Light kit (TROPIX).
Cytosolic and Nuclear Fractionation, Immunoprecipitation, and Western Blotting.
Nuclear extracts were prepared as described in ref. 19. Equal amounts of nuclear and cytoplasmic protein extracts were fractionated by standard SDS/PAGE followed by standard Western blot analysis. Nuclear extracts from transfected HEK293T cells were subject to a coimmunoprecipitation protocol adjusted from Adcock et al. (20).
RNA Analysis.
RNA extraction was performed as described in ref. 9. cDNA was analyzed either by a semiquantitative PCR using Taq polymerase (Promega) or by real-time PCR with a SYBR Green mastermix (Invitrogen). Sequences are available on request.
ChIP Assay.
ChIP assays were performed as described in ref. 9. Primers within the GILZ promoter region are from Wang and et al. (21). Ct-values obtained in the QPCR assays were analyzed by using GENEX software (Bio-Rad). The relative amount of the precipitated target sequence was determined via normalization to the “input,” i.e., the purified total gDNA levels.
ELISA.
Murine IL-6 ELISA was performed by using a kit from Biosource.
Statistical Analysis.
Statistical significance was determined by using one-way ANOVA tests followed by Dunnett's multiple comparison test, or via the Mann–Whitney statistical analysis. Values of P < 0.05 were considered significant.
Supplementary Material
Acknowledgments.
We thank I. Vanherpe and B. Lintermans for excellent technical support with cell culturing procedures and I. M. E. Beck, V. Gossye, and M. Van Cleemput for critical readings. We thank I. Duplan and B. Derudas for QPCR assistance, F. Gonzalez (National Institutes of Health, Bethesda, MD) for the PPARα KO mice, and J. Brozek (Genfit SA, Lille) for technical support on the Affymetrix ChIP and data analysis. This work was supported by Interuniversitary Attraction Poles (IAP) P5/12, a concerted research activity (GOA) grant from Ghent University, FWO project G.0.297.09.N.10, and by the “Fondation Coeur et Artères” and grants from Agence Nationale de la Recherche and Genfit SA (project acronym COMAX). K.D.B is a postdoctoral fellow at the Fonds voor Wetenschappelijk Onderzoek-Vlaanderen.
Footnotes
The authors declare no conflict of interest.
This article is a PNAS Direct Submission.
This article contains supporting information online at www.pnas.org/cgi/content/full/0806742106/DCSupplemental.
References
- 1.De Bosscher K, Vanden Berghe W, Haegeman G. The interplay between the GR and NF-κB or AP-1: Molecular mechanisms for gene repression. Endocr Rev. 2003;24:488–522. doi: 10.1210/er.2002-0006. [DOI] [PubMed] [Google Scholar]
- 2.Shiri-Sverdlov R, et al. Early diet-induced non-alcoholic steatohepatitis in APOE2 knockin mice and its prevention by fibrates. J Hepatol. 2006;44:732–741. doi: 10.1016/j.jhep.2005.10.033. [DOI] [PubMed] [Google Scholar]
- 3.Desvergne B, Wahli W. PPARs: Nuclear control of metabolism. Endocr Rev. 1999;20:649–688. doi: 10.1210/edrv.20.5.0380. [DOI] [PubMed] [Google Scholar]
- 4.Delerive P, et al. PPARα negatively regulates the vascular inflammatory gene response by negative cross-talk with transcription factors NF-κB and AP-1. J Biol Chem. 1999;274:32048–32054. doi: 10.1074/jbc.274.45.32048. [DOI] [PubMed] [Google Scholar]
- 5.Staels B, et al. Activation of human aortic smooth-muscle cells is inhibited by PPARα but not by PPARγ activators. Nature. 1998;393:790–793. doi: 10.1038/31701. [DOI] [PubMed] [Google Scholar]
- 6.Guerre-Millo M, et al. PPARα activators improve insulin sensitivity and reduce adiposity. J Biol Chem. 2000;275:16638–16642. doi: 10.1074/jbc.275.22.16638. [DOI] [PubMed] [Google Scholar]
- 7.Barthel A, Schmoll D. Novel concepts in insulin regulation of hepatic gluconeogenesis. Am J Physiol. 2003;285:E685–E692. doi: 10.1152/ajpendo.00253.2003. [DOI] [PubMed] [Google Scholar]
- 8.Kajimura S, et al. Regulation of the brown and white fat programs through a PRDM16/CtBP transcriptional complex. Genes Dev. 2008;22:1397–1409. doi: 10.1101/gad.1666108. [DOI] [PMC free article] [PubMed] [Google Scholar]
- 9.De Bosscher K, et al. A fully dissociated compound of plant origin for inflammatory gene repression. Proc Natl Acad Sci USA. 2005;102:15827–15832. doi: 10.1073/pnas.0505554102. [DOI] [PMC free article] [PubMed] [Google Scholar]
- 10.Newton R, Holden NS. Separating transrepression and transactivation: A distressing divorce for the GR? Mol Pharmacol. 2007;72:799–809. doi: 10.1124/mol.107.038794. [DOI] [PubMed] [Google Scholar]
- 11.Cuzzocrea S, et al. PPARα contributes to the anti-inflammatory activity of glucocorticoids. Mol Pharmacol. 2008;73:323–337. doi: 10.1124/mol.107.041475. [DOI] [PubMed] [Google Scholar]
- 12.Sutherland C, O'Brien RM, Granner DK. New connections in the regulation of PEPCK gene expression by insulin. Philos Trans R Soc London Ser B. 1996;351:191–199. doi: 10.1098/rstb.1996.0016. [DOI] [PubMed] [Google Scholar]
- 13.Pierreux CE, et al. Inhibition by insulin of GC-induced gene transcription: Involvement of the ligand-binding domain of the GR and independence from the PI3-kinase and MAPK pathways. Mol Endocrinol. 1998;12:1343–1354. doi: 10.1210/mend.12.9.0172. [DOI] [PubMed] [Google Scholar]
- 14.Bernal-Mizrachi C, et al. Dexamethasone induction of hypertension and diabetes is PPARα dependent in LDL receptor-null mice. Nat Med. 2003;9:1069–1075. doi: 10.1038/nm898. [DOI] [PubMed] [Google Scholar]
- 15.Subramanian S, et al. PPARα activation elevates blood pressure and does not correct GC-induced insulin resistance in humans. Am J Physiol. 2006;291:E1365–E1371. doi: 10.1152/ajpendo.00230.2006. [DOI] [PMC free article] [PubMed] [Google Scholar]
- 16.Ogawa S, et al. Molecular determinants of cross-talk between nuclear receptors and toll-like receptors. Cell. 2005;122:707–721. doi: 10.1016/j.cell.2005.06.029. [DOI] [PMC free article] [PubMed] [Google Scholar]
- 17.Chinetti G, Fruchart JC, Staels B. PPAR-activated receptors: New targets for the pharmacological modulation of macrophage gene expression and function. Curr Opin Lipidol. 2003;14:459–468. doi: 10.1097/00041433-200310000-00006. [DOI] [PubMed] [Google Scholar]
- 18.Berry MN, Friend DS. High-yield preparation of isolated rat liver parenchymal cells: A biochemical and fine structural study. J Cell Biol. 1969;43:506–520. doi: 10.1083/jcb.43.3.506. [DOI] [PMC free article] [PubMed] [Google Scholar]
- 19.Wong C, et al. Smad3–Smad4 and AP-1 complexes synergize in transcriptional activation of the c-Jun promoter by TGFβ. Mol Cell Biol. 1999;19:1821–1830. doi: 10.1128/mcb.19.3.1821. [DOI] [PMC free article] [PubMed] [Google Scholar]
- 20.Adcock IM, Nasuhara Y, Stevens DA, Barnes PJ. Ligand-induced differentiation of GR transrepression and transactivation: Preferential targetting of NF-κB and lack of I-κB involvement. Br J Pharmacol. 1999;127:1003–1011. doi: 10.1038/sj.bjp.0702613. [DOI] [PMC free article] [PubMed] [Google Scholar]
- 21.Wang JC, et al. Chromatin immunoprecipitation (ChIP) scanning identifies primary GR target genes. Proc Natl Acad Sci USA. 2004;101:15603–15608. doi: 10.1073/pnas.0407008101. [DOI] [PMC free article] [PubMed] [Google Scholar]
Associated Data
This section collects any data citations, data availability statements, or supplementary materials included in this article.


