Abstract
A pressure driven 2-D channel flow at very low Reynolds numbers (Stokes flow) with a bubble sticking and sliding along one of the walls is studied computationally using the boundary element method (BEM). The moving three phase contact lines are modeled using a Tanner law wherein the contact line speed is linearly proportional to the deviation of the contact angle from its equilibrium value. Results are presented with and without the effect of contact angle hysteresis. Including contact angle hysteresis allows us to predict the stick-slide behavior of bubbles, which in turn affects the long term evolution and dynamics of the bubbles. It is shown that the initial rapid contraction or expansion of the bubbles to achieve local equilibrium with the surrounding pressure field results in cusps and bulges in the wall normal stress profiles. The wall shear stress also increases (with opposite signs upstream and downstream of the bubble) as the fluid rushes in or out of the channel inlet and outlet. In the long term, bubbles slowly expand as they slide along the channel wall. Contact lines are found to correspond to peaks in the wall normal and shear stress profiles at all times. The effectiveness of bubbles in occluding flow through the channel is also examined.
Keywords: Gas embolotherapy, Stokes flow, bubble dynamics, contact angle hysteresis
I. INTRODUCTION
This study is mainly motivated by a novel developmental gas embolotherapy based cancer treatment modality (Bull 2005). In this approach, extremely small albumin coated liquid droplets (~ 6μ in diameter; small enough to pass through capillaries) of a perfluorocarbon (C5F12; dodecafluoropentane (DDFP)) are injected into the blood stream at a convenient location. Although these DDFP droplets are superheated at body temperature (boiling point 29 °C at atmospheric pressure), the albumin shell prevents the injected droplets from spontaneously vaporizing. The motion of these droplets is tracked using low intensity ultrasound. At the desired location these droplets are selectively vaporized using high intensity ultrasound, termed acoustic droplet vaporization (ADV), to form gas bubbles that are several times larger in volume (~ 150 times) than the initial droplets. These bubbles eventually lodge in the microcirculation in or around the tumor to occlude its blood supply and thus induce tumor necrosis. Previous studies have examined ADV (Kripfgans et al. 2000, Kripfgans et al. 2002, Ye & Bull 2004, Kripfgans et al. 2004, Ye & Bull 2006, Lo et al. 2006), bubble transport (Calderon, Fowlkes & Bull 2005, Eshpuniyani & Bull 2005, Eshpuniyani, Fowlkes & Bull 2005), the mechanics of lodging of bubbles that are large compared to the vessel diameter (Calderon et al. 2006), and the ability to occlude flow in vivo (Kripfgans et al. 2005).
In order to design intelligent gas embolotherapy strategies, it is of interest to know what conditions favor the lodging of bubbles so as to reduce the flow rate through the vessel in question. In contrast, air embolism has an undesired presence of bubbles in the vasculature (Chang et al. 1981, Vann & Thalmann 1993, Eckmann, Branger & Cavanagh 2000, Muth & Shank 2000). The quest there is exactly the opposite of gas embolotherapy and focused on eliminating occlusion to restore blood flow. There are many other scenarios involving the presence of gas bubbles in the cardiovascular system, such as microbubble-induced angiogenesis and arteriogenesis, use of acoustically driven microbubbles as ultrasound contrast agents, etc. A comprehensive review of a variety of situations in which we encounter gas bubbles in the cardiovascular system and recent advances in enhancing our understanding of cardiovascular bubble dynamics can be found in Bull (2005). Whether gas bubbles are deliberately created for diagnostic or therapeutic purposes, or are formed undesirably due to certain patho-physiological conditions, it is imperative to better understand the evolution and dynamics of these bubbles for a range of flow conditions, their effect on the surrounding flowfield, as well as the stresses they generate on the vessel walls.
In the context of gas embolotherapy, the bubble sticking process likely involves the bubble contacting the vessel wall and then either sticking immediately or sliding some distance before becoming stuck or detaching from the wall. Alternatively, one can imagine a scenario where the vaporization process itself starts with the liquid droplets already adhering to the vessel wall. The presence of three phase contact lines in such situations adds another level of complexity in understanding the bubble dynamics and the associated flow field and wall stresses. In addition, these contact lines are potentially regions of high normal and shear stresses, thus requiring extra attention if we are to ensure that the underlying endothelium does not get damaged.
Similar studies of multiphase flows, with and without contact lines, derive their motivation from a wide range of applications such as recovery of oil from porous media (Wooding & Morel-Seytoux 1976, Kornev, Neimark & Rozhkov 1999), microfluidics (Stone, Stroock & Ajdari 2004), thermal ink-jet printers (Allen, Meyer & Knight 1985, Asai 1991) and industrial printing processes (Kunz 1983, Collard 1984, Guthrie 1992, Benkreira & Patel 1993, Piette, Morin & Maume 1997, Schwartz et al. 1998, Mock 1999, Bohan, Claypole & Gethin 2000, Powell, Savage & Gaskell 2000, Powell, Savage & Guthrie 2002).
While the subject of bubble dynamics in the vicinity of solid boundaries has received significant attention from the experimental community (Zukoski 1966, Maneri & Zuber 1974, Maxworthy 1991, Masliya et al. 1994, Tsao & Koch 1997, Cavanagh & Eckmann (1999, 2002)), there is a certain paucity of investigations which consider bubbles that contact the walls. Cavanagh & Eckmann (1999, 2002) studied the interfacial dynamics of a gas bubble in an inclined tube. They kept the bubble stationary by applying a counter flow to negate its tendency to rise due to buoyancy. The bubble was observed to wet the upper wall and the effect of soluble surfactants on the interfacial dynamics as well as detachment of the bubble from the wall was studied in detail.
Mathematically modeling the motion of three phase contact lines is a challenging problem that has been the subject of several theoretical investigations (Dussan 1976, Dussan 1979, Gennes 1985, Hocking 1994, Shikhmurzaev 1997, Pomeau 2002, Miksis 2004, Ajaev & Homsy 2006). Two contrasting perspectives have been presented by Hocking (1994) and Shikhmurzaev (1997). Hocking (1994) approached the problem from the microscopic perspective and included intermolecular forces. He assumed that microscopic contact angle stays fixed in his derivation of a relationship between the contact angle and the contact line speed. Shikhmurzaev (1997) on the other hand took a thermodynamic perspective and accounted for the relaxation of fluid properties in the vicinity of the contact line. In contrast to such physics based modeling of contact line motion, empirically determined “Tanner Laws” relating the contact line speed to the contact angle have also been developed (Greenspan 1978).
Difficulties associated with moving boundaries make computational studies of interfacial dynamics a challenging task. When moving contact lines are introduced, the no-slip boundary condition at the contact line introduces a contact line stress singularity (Dussan 1976), making the problem that much more challenging. Cox (1986) developed a contact angle-slip velocity relation and used it along with the boundary element method to study liquid spreading on solid surfaces. Schleizer & Bonnecaze (1999) used the boundary integral method to study the displacement of an immiscible droplet contacting a wall in flows driven by shear and pressure at zero Reynolds number. Powell & Savage (2001) and Powell, Savage & Guthrie (2002) used a Tanner Law to model contact line motion in a Lagrangian finite element method. They circumvented the stress singularity at the contact line by permitting local tangential slip. Norman & Miksis (2005) used a Navier slip boundary condition to handle the moving contact lines in their study of a gas bubbles in an inclined channel. However, none of these studies have considered the effects of contact angle hysteresis while modeling the contact line motion. The present study incorporates contact angle hysteresis in a modified Tanner law and takes a close look at how this affects the contact line motion and the overall bubble dynamics.
In this paper we formulate a simplified model problem of a bubble sticking and sliding along a wall in a two dimensional channel flow. Although the blood flow in the cardiovascular system is driven by a combination of different mechanisms such as pressure and gravity, and is pulsatile in general, we restrict our attention here to pressure driven flows, with constant pressures specified at the inlet and outlet of the channel. The smallness of Reynolds numbers in our regime of interest, the microcirculation, allows us to use the Stokes equation for modeling the surrounding blood flow (ignoring Non-Newtonian effects). The gas inside the bubble is assumed to be ideal and the bubble expansion/contraction process is treated as isothermal. The moving three phase contact lines are modeled using a Tanner law wherein the contact line speed is linearly proportional to the deviation of the contact angle from its equilibrium value. Results are presented both with and without the effects of contact angle hysteresis.
II. MATHEMATICAL MODEL
A. Assumptions
The general problem of the transport of a gas bubble through the microvasculature is tremendously complicated. Microvessels have highly irregular three-dimensional geometries, flexible walls with non-trivial stiffness and damping, varying wall surface roughness and properties due to the presence of cells, non-Newtonian nature of blood, possible breakdown of continuum assumption at the capillary scales, and uncertain boundary conditions. In addition, a complete modeling of the gas phase inside the bubble would require solving the governing equations for compressible flow, simultaneously with the evolution of the blood flow outside. Also, since these flows are dominated by surface tension (inertial effects are negligible in the microcirculation), it becomes very important to capture the interface evolution accurately, a problem further complicated by the presence of moving three phase contact lines. We thus make several assumptions to keep the problem tractable. To start with, we consider a greatly simplified geometry where we model our microvessel as a two-dimensional straight channel with rigid walls. Next, we ignore the particulate nature of blood and treat it as a continuum. We also assume proportionality between the stress and rate of strain, thus assuming that blood is a Newtonian fluid. In addition, the gas inside the bubble is assumed to be ideal and the expansion/contraction of the bubble is treated as isothermal. The moving three phase contact lines are modeled using a simple Tanner law wherein the contact line speed is linearly proportional to the deviation of the contact angle from its equilibrium value.
B. Governing equations
For an incompressible Newtonian fluid, the mass and momentum conservation equations, neglecting contributions from body forces, can be expressed in their non-dimensional form as
| (1) |
| (2) |
These are the well-known incompressible Navier-Stokes equations where and p velocity and pressure respectively. Non-dimensionalization has been performed using L* = half channel width (Fig. 1) as the reference length scale, U* = γ*/μ*as the reference velocity scale (a common choice for interfacial flows, where γ* is the surface tension and μ* is the dynamic viscosity), and P* = γ*/L* as the reference pressure scale. Here is the Capillary number and is the Reynolds number, where ρ* is the density. Note that our choice of reference velocity scale makes the capillary number as defined above equal to one. Although this causes a disappearance of the capillary number from our governing equations, we will see below that the interplay between viscous and surface tension forces will find visibility through the contact line speed.
Figure 1.
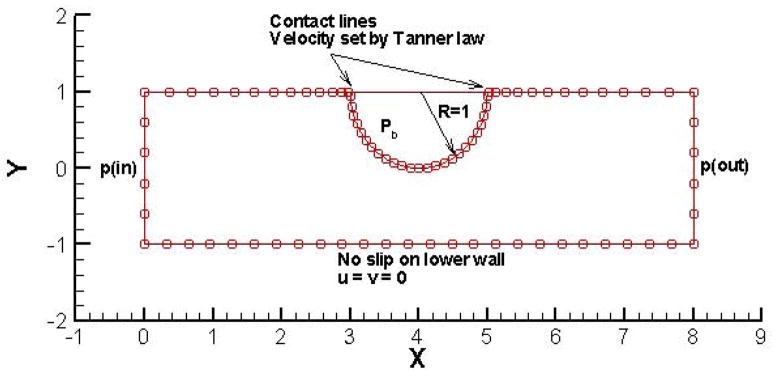
Computational domain. Every fourth grid point is shown here. Grid stretching is used near the contact lines. Pressure boundary conditions are set at the inlet and outlet. No slip is imposed on the lower wall. On the upper wall, a Tanner law is used to specify the contact line velocities. As we move away from the contact lines, the velocity linearly goes to zero, i.e. the no slip condition. All the simulations presented here start with a semi-circular bubble of radius 1 and an initial bubble pressure Pb.
As discussed in the introduction, our regime of interest is the microcirculation which is characterized by very low values of the Reynolds number (viscous forces dominate inertia forces). A scaling argument tells us that the contribution from the unsteady and convective inertia terms in Equation 2 (the left hand side) tends to zero for Re ≪ 1. Hence in the very low Reynolds number limit we can further simplify our model by dropping the inertia terms from Equation 2 to obtain
| (3) |
C. Numerical method
Being able to reduce our problem to a Stokes flow allows us to use the fact that the solution of linear, elliptic, homogenous partial differential equations can be represented by boundary integrals that involve the unknown function and its derivatives. For two dimensional Stokes flow
| (4) |
where C is the selected flow boundary, is the modified stress, is the modified stress tensor, is the normal pointing into the domain and ckj is the tensor due to stress jump at the boundaries (=δkj/2 for smooth boundaries). Gij and Tijk are the two dimensional Stokeslet and the associated stress field respectively, defined as
| (5) |
| (6) |
This formulation allows us to use the boundary element method (BEM) (Brebbia 1992, Pozrikidis 1992). In the current study, we use quadratic elements to compute the integrals while solving Equation 4 (see Fig. 1 for a pictorial representation of how the computational boundary is discretized into a series of quadratic elements).
D. Initial and Boundary Conditions
All the simulations presented here start with a semi-circular bubble attached to the upper channel wall (Fig. 1). An initial bubble pressure is specified. Pressure boundary conditions are imposed at the inlet and outlet. The no-slip boundary condition is used on the lower channel wall. On the upper channel wall, we have the presence of two contact lines whose velocity is computed using a Tanner’s law (Greenspan 1978) as follows [expressions are given here for the front contact line; the signs are opposite for the rear contact line]
| (7) |
where θD is the dynamic contact angle (varies with time) between the bubble surface and channel wall at the contact line, while θS is the static contact angle (an “equilibrium” value corresponding to a stationary bubble). Thus, in this model, the contact line moves with an intention to restore the contact angle to its “equilibrium” value, at a speed that is proportional to the deviation of the contact angle from the same. If we include contact angle hysteresis, the contact line motion is governed by a modified Tanner law
| (8) |
where θA and θR the advancing and receding contact angles respectively. As we move away from the contact lines, the velocity on the upper wall linearly decreases to zero (on a stretched grid – see Fig. 1), i.e. the no-slip boundary condition, to avoid singularities at the contact lines. Note that the contact line velocity is expressed in its non-dimensional form in the expressions above. Noting that velocities in our problem are being non-dimensionalized using the reference velocity scale U* = γ*/μ*, the non-dimensional contact line velocity can be expressed in terms of the relevant dimensional quantities as . Thus the relative magnitudes of viscous and surface tension forces express themselves as a “contact line capillary number” in the non-dimensional contact line velocity. The stress boundary condition at the bubble interface is given by
| (9) |
where κ is the curvature of the interface (computed using cubic splines).
The values of the proportionality constant (k) in Tanner’s law and the static contact angle (θS) (or the advancing and receding contact angles when hysteresis effect is included) depend on the properties of the two fluids and the surface. In other words, they can be treated as parameters that express the dependency of the contact line dynamics on the specific solid, liquid and gas phases present in the problem. We have investigated results corresponding to a range of these parameters. In this paper we present results for θS = 70° and k = 2.0. For the simulations with contact angle hysteresis, we use θA = 50° and θR = 70°. We find these values to be suitable for highlighting some salient features of this study.
Once the flow-field is solved for with these boundary conditions, the following kinematic boundary condition is used to advance the interface shape in time using a simple Euler integration
| (10) |
The kinematic boundary condition simply implies that at any given point, the interface ( ) moves at the local velocity ( ). Once the interface is advanced in time in this manner, the new bubble volume is computed and the bubble pressure is updated using the ideal gas law for isothermal conditions, i.e. bubble pressure times the bubble volume is kept constant. We then solve for the flow-field for this new bubble shape and pressure with the same boundary conditions, and the algorithm repeats itself in this manner.
III. RESULTS AND DISCUSSION
Before we start taking a close look at the results, a few comments are in order regarding the thought process behind the design of these simulations. We are looking at the evolution and dynamics of bubbles in a pressure environment prescribed by specifying fixed pressures at the inlet and outlet of the channel. Pressure boundary conditions specified in this manner affect the overall problem in two ways. Firstly, the pressure drop across the channel sets up a “background” flow which is expected to sweep the bubble along. Secondly, the evolution of the bubble itself (for example whether it expands or contracts, and the rate at which it does so) depends strongly on the interplay between the initial bubble pressure, initial interface curvature and the surrounding pressure environment. For a bubble to be in perfect static equilibrium with the surrounding fluid, the stress jump condition (Equation 9) has to be exactly satisfied at each point along the interface, i.e. the surface tension and pressure exerted by the surrounding fluid on the bubble interface should exactly balance the pressure force exerted on the interface from within the bubble. Thus, for a given pressure environment, whether the bubble initially expands or contracts, would depend on the specific combination of the initial interfacial curvature and pressure. By starting all our simulations with a semi-circular bubble of radius 1 (corresponding to a uniform initial curvature of 1 along the interface), we reduce the dependency of initial bubble behavior (in terms of expansion vs. contraction) to just one parameter, i.e. the initial bubble pressure. We consider the pressure environment set by specifying p(in) = 2; p(out) = 1 and study the evolution of bubbles with initial pressures of 1, 2, 4 and 8 to allow possibilities of initial bubble expansion as well as contraction, and thus allow us to compare and contrast these situations. We will present the effect of initial curvature on the long term dynamics of bubbles in a separate study.
In addition to the interplay between the initial bubble conditions and the surrounding pressure field, the contact line dynamics has a bearing on the how the bubbles evolve. The behavior of the contact lines in turn depends on the properties of the solid, liquid and gas phases present in the problem. Contact lines move with an intention to restore the contact angles to their static value. If the static contact angle is less than 90°, then for an initially semi-circular bubble, the contact lines would want to move inward and hence increase the interfacial curvature, which further has the effect of requiring a lower bubble pressure to support the interface via the stress jump condition. An obtuse static contact angle would result in exactly the opposite behavior, with the contact lines moving outwards and hence a decrease in the interfacial curvature. In this case, a higher bubble pressure would be needed to satisfy the stress jump condition and hence achieve equilibrium. In the current study, we restrict our attention to a static contact angle value of θS = 70° (θA = 50° and θR = 70° when we include contact angle hysteresis effects). As explained above in section II D, we find these values to be suitable for the salient features we want to highlight in this paper.
Another aspect of contact line behavior that can affect the overall bubble evolution and dynamics is the effect of contact angle hysteresis wherein the contact lines advance when the dynamic contact angle becomes less than the advancing static contact angle, while the dynamic contact angle has to become greater than the receding static contact angle for the contact lines to recede. For values of the dynamic contact angle between these advancing and receding static contact angles, the contact lines do not move. The effect of contact line motion on the interfacial curvature is thus of a different nature when contact angle hysteresis is present. We have run simulations both with and without the presence of contact angle hysteresis, and we compare and contrast the results from the two sets of simulations. As mentioned above, for the cases with contact angle hysteresis, we have set the advancing and receding contact angles to θA = 50° and θR = 70° respectively.
A. Without contact angle hysteresis
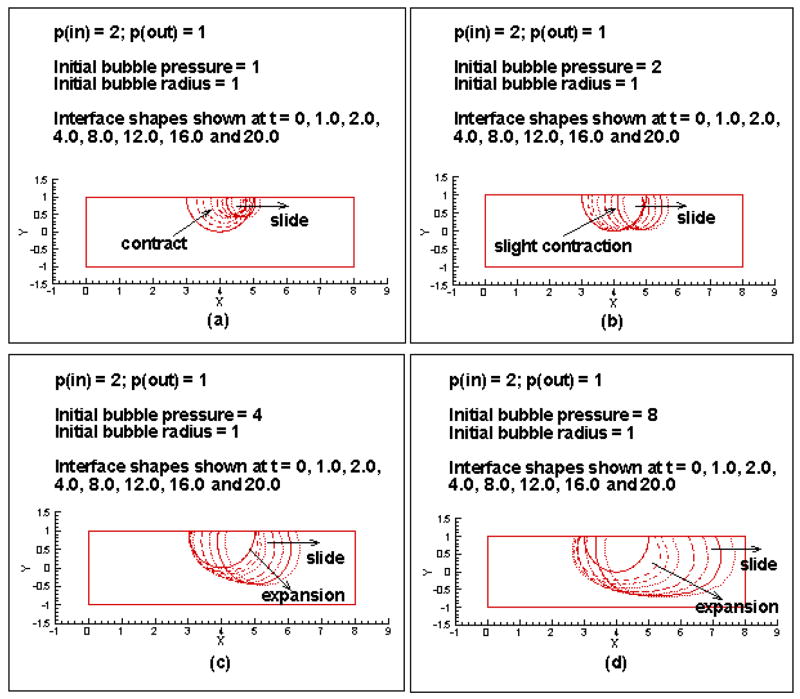
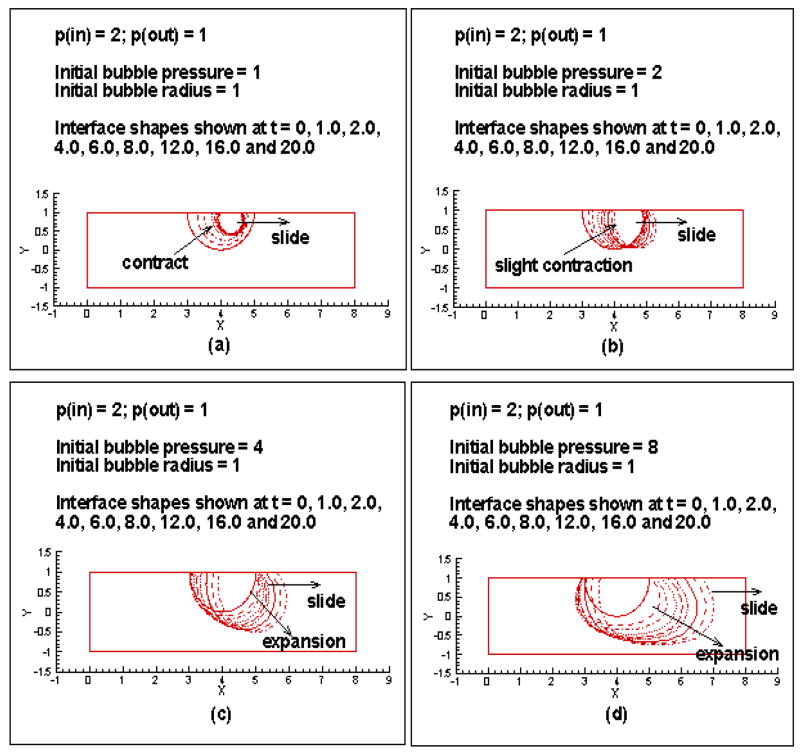
Figure 2 shows the interface evolution for initially semi-circular bubbles of radius 1 and internal pressures 1, 2, 4 and 8 (parts a, b, c and d of the figure), adhering to a wall (θS = 70°; no contact angle hysteresis) of a 2-D channel, in a pressure environment prescribed by setting p(in) = 2; p(out) = 1. An initial bubble pressure of 1 is less than the requirement for equilibrium with the surrounding pressure field. This results in a contraction of the bubble (Figure 2(a)). The extent of contraction decreases as we traverse the bubble from left to right. This is as expected since the surrounding pressure is decreasing in this direction. As was discussed above, the surrounding pressure field, in addition to causing a contraction of the bubble in this manner, also causes the bubble to slide to the right due to the pressure gradient along the channel. The tendency of the contact angles to continuously try and adjust to the static value of θS = 70°, via contact line motion as prescribed by the Tanner law, gives the bubble its “balloon” like shape. For an initial bubble pressure of 2 (Figure 2(b)), the extent of contraction (and the rate at which this contraction takes place) is lesser, since this initial bubble pressure is closer to the requirement for equilibrium with the surrounding pressure field. The other features are similar with the left side of the bubble contracting more and the background pressure drop across the channel causing the bubble to slide. The balloon like shape is more clearly visible here.
Figure 2.
Evolution of bubble interface for p(in) = 2; p(out) = 1 and initial bubble pressures of (a) 1, (b) 2, (c) 4 and (d) 8.
For initial bubble pressures that are higher than the requirement to maintain equilibrium with the surrounding pressure field, the bubble expands. Figure 2(c) shows the interface evolution for an initial bubble pressure of 4. Again, the fact that the surrounding pressure decreases as we move along the channel causes the right side of the bubble to expand more. This background pressure gradient also causes the bubble to slide in the direction of the flow. A higher initial bubble pressure of 8 causes a greater expansion (Figure 2(d)). As the bubble size increases significantly, the lower channel wall clearly makes its presence felt by causing the interface to flatten, resulting in an elongated bubble shape.
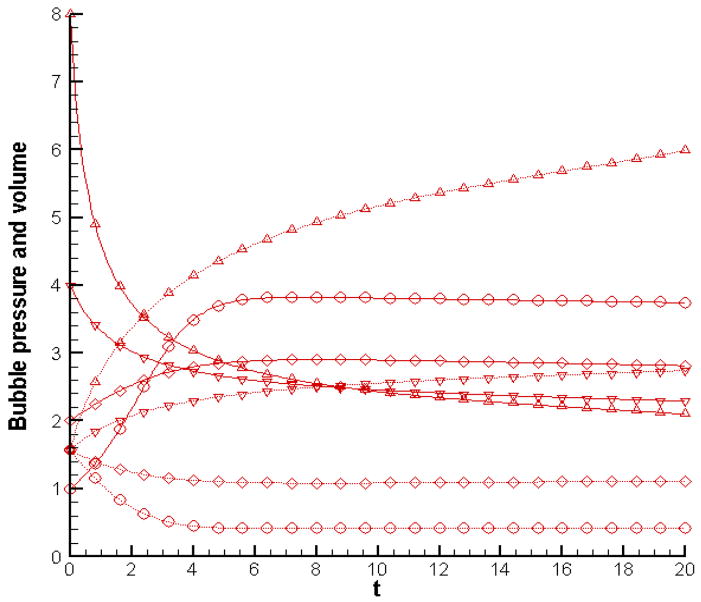
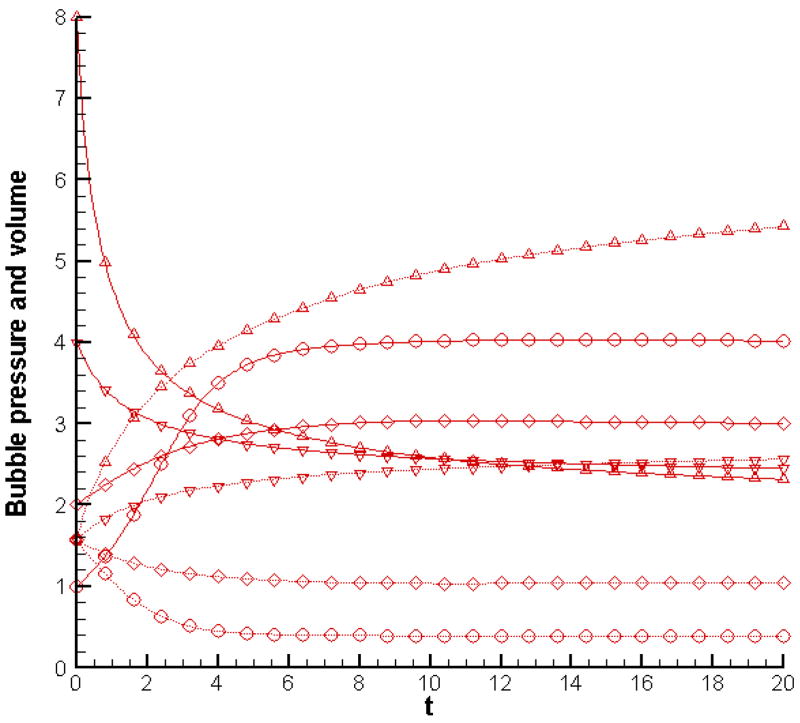
Figure 3 shows how the bubble pressure and volume change in time as the simulation progresses. It can easily be seen that the bubble expansion/contraction, to achieve a pressure within that is in equilibrium with the surroundings, dominates initially with rapid changes in bubble pressure and volume. At later times, as the bubble continues to slide along the channel wall into ever-decreasing pressure surroundings, its volume increases at a slow rate with a corresponding decline in the pressure within.
Figure 3.
Evolution of bubble pressure (solid line) and bubble volume (dotted line) for p(in) = 2; p(out) = 1 and initial bubble pressures of 1 [○], 2 [◇], 4 [▽] and 8 [△].
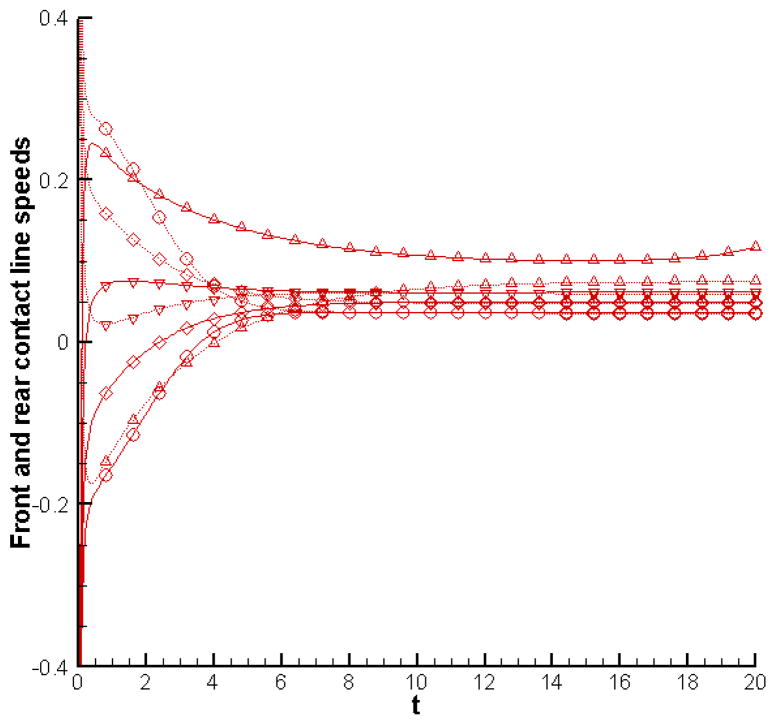
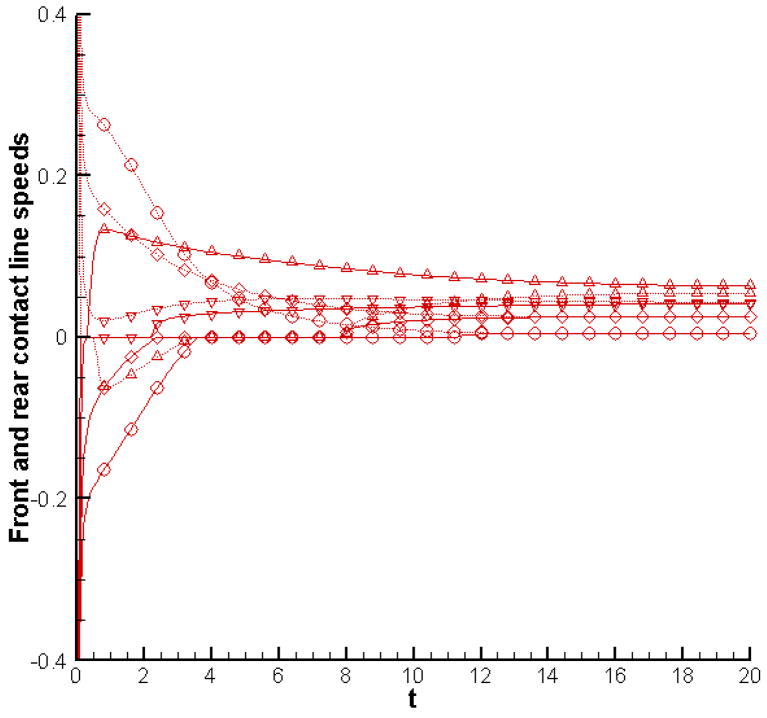
Figure 4 shows the temporal evolution of contact line speeds. As expected, the front contact line initially moves rapidly to the left (negative values of the contact line speed) while the rear contact line does the opposite (positive values of the contact line speed), both with a view towards adjusting the contact angle to its static value of θS = 70°. And as the contact angle approaches this value, the contact line speeds also decrease in magnitude as per the Tanner law. The front contact line eventually changes direction and starts moving to the right, as the bubble continues to slide along the upper channel wall. The rear contact line also slows down after the initial contraction process is over. In the cases of expanding bubbles, the contact line speed profiles show overshoots. For example, the front contact line for both the expanding bubbles changes direction from moving towards the left to moving towards the right very early in the simulation, and moves with a positive contact line speed that is set by the rapid initial expansion of the bubble. As the expansion process slows down, the front contact line speed also decreases and is eventually driven by just the sliding motion of the bubble. For the case with initial bubble pressure of 8, the initial expansion process is so dominant, that even the rear contact line moves sharply to the left very soon after the simulation starts, and later settles back to a positive value when the expansion slows down and the dominant bubble motion is it’s sliding along the channel wall. Note that as the bubble continues to slide along the wall into lower pressure regions, the front contact line moves at a speed higher than the rear contact line, and this difference between the front and rear contact line speeds increases as the bubble becomes larger. This difference is also larger for bubbles that are larger at the end of initial expansion/contraction process. These observations can be explained on the basis that the front interface of the bubble advances into lower pressure regions, thus allowing the pressure difference across it to push it forward in addition to the bubble as whole being swept along by the surrounding fluid. Another observation that we can make is that larger bubbles slide faster.
Figure 4.
Evolution of front (solid line) and rear (dotted line) contact line speeds for p(in) = 2; p(out) = 1 and initial bubble pressures of 1 [○], 2 [◇], 4 [▽] and 8 [△].
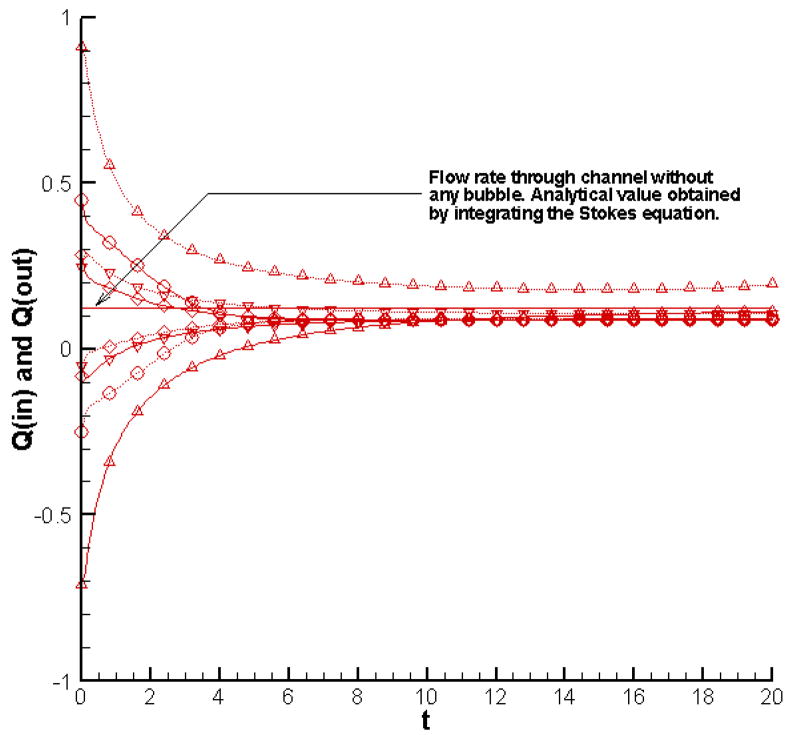
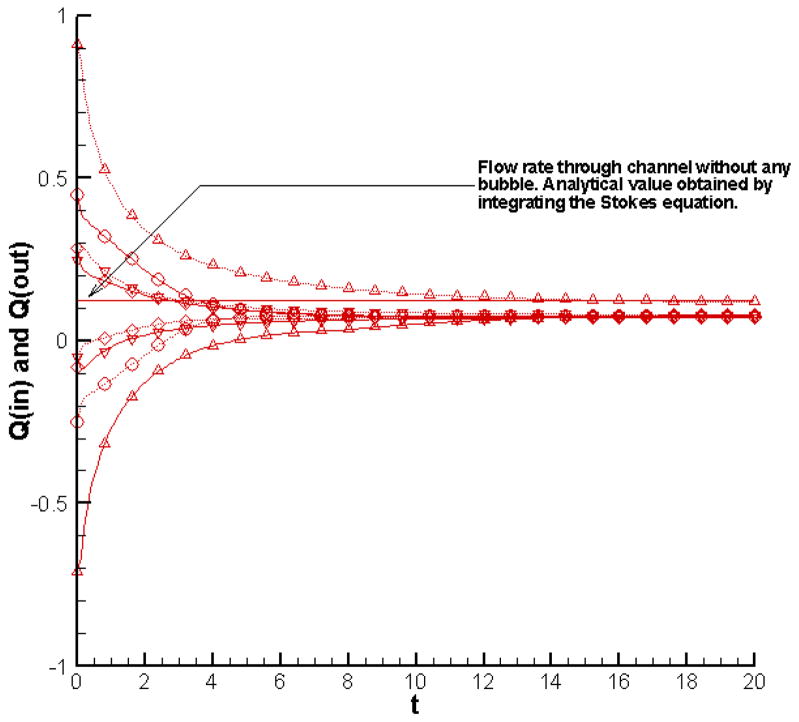
Figure 5 shows how the flow rates at the inlet and outlet vary in time as the bubble evolves. The analytically obtained value of the flow rate through the channel without any bubble [and all other conditions exactly the same] is Q = 1/8. This is also plotted in Figure 5 so that we can more clearly discuss how the bubble affects the flow rate for the different cases considered here. For the cases with initial bubble pressures of 1 and 2, the initial rapid contraction of the bubble has the effect of sucking in the fluid from both ends of the channel. This results in an increase of the flow rate at the inlet and a decrease at the outlet. In fact, the flow rate at the outlet is actually negative during the initial rapid contraction of the bubble, i.e. we have backflow into the channel. On the other hand, for the cases where the bubble initially expands, the bubble pushes the flow outwards in both directions initially. This result here is the opposite of what we observe for an initially contracting bubble. The flow rate at the inlet decreases (and is in fact negative during the initial rapid expansion of the bubble), while the flow rate at the outlet is increased. After the initial expansion/contraction is over and the bubble slides along the wall due to the background flow, the inlet and outlet flow rates settle down to positive values. The inlet flow rate is less than the flow rate without any bubble owing to the occlusion effect of the bubble for all the cases considered here. The outlet flow rate is consistently higher than the inlet flow rate. This is due to the front portion of the bubble interface “driving” the flow as it advances into the lower pressure region of the channel. This becomes increasingly apparent for larger bubbles. In fact, for our case with initial bubble pressure of 8, the eventual outflow rate is higher than the flow through the channel without any bubble. Hence the occlusion effect is felt upstream of the bubble, a fact that can prove useful if we want to shunt the flow away from any section of the vasculature.
Figure 5.
Evolution of flow rates at inlet (Q(in); solid line) and outlet (Q(out); dotted line) for p(in) = 2; p(out) = 1 and initial bubble pressures of 1 [○], 2 [◇], 4 [▽] and 8 [△].
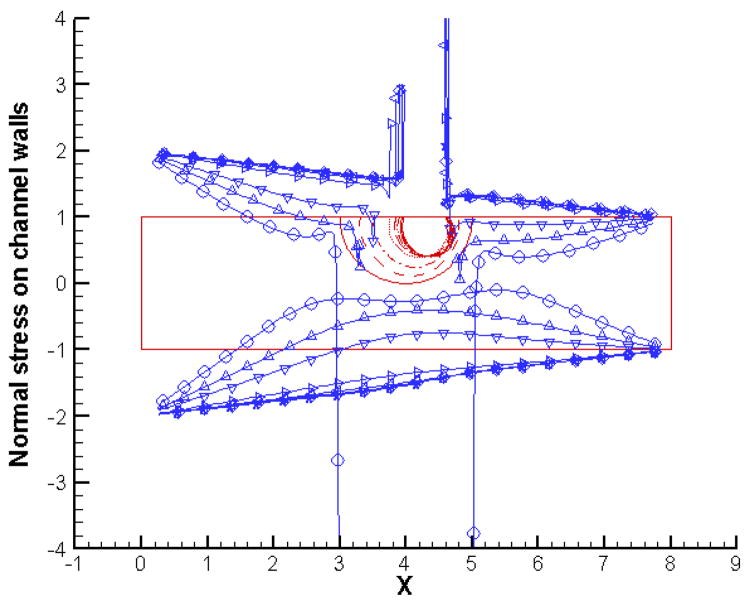
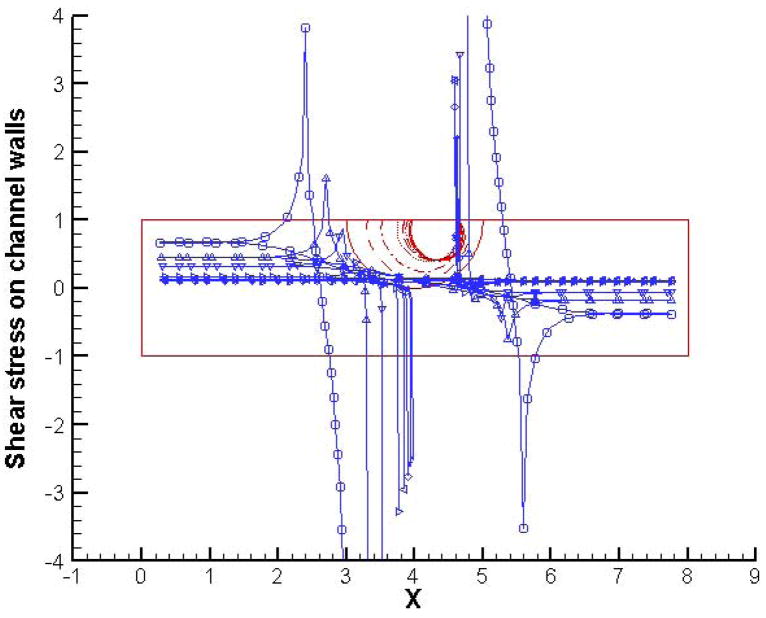
Let us now take a close look at how the bubble evolution and dynamics affects the normal and shear stresses along the channel walls. We focus on the two extreme cases in terms of the initial bubble dynamics (these correspond to initial bubble pressures 1 and 8 respectively). Figures 6 and 7 present the normal and shear stress profiles along the channel walls for the case with an initial bubble pressure of 1. We see that the initial rapid contraction of the bubble creates a suction effect as indicated by the cusps in normal stress profiles. As expected, this suction effect is felt more strongly by the lower channel wall. The contact lines have extremely high values of normal stress as can be evidenced by peaks in the profile. As time progresses, the suction effect reduces along with the rate of bubble contraction and the normal stress profiles relax. The contact line stresses also decrease, and eventually their sign changes when the bubble simply slides along the wall with both the contact lines moving in the same direction. At later times, the only locations where the wall normal stress is significantly different from the situation without any bubbles are the contact lines. In the case of shear stress profiles, the “sucking in” of the fluid from both ends of the channel by the initially contracting bubble causes the shear stress to increase in magnitude both upstream and downstream of the bubble. The signs are of course opposite in these two regions since the flow is in opposite directions. At later times when the bubble is swept along by the background flow, the shear stresses along the walls also decrease. The only exceptions again are the contact lines, which continue to be high stress regions with peaks in the shear stress profiles.
Figure 6.
Normal stress profiles along channel walls for initial bubble pressure = 1 and p(in) = 2; p(out) = 1, at t = 0 (○), 1(△), 2(▽), 4(>), 8(<), 14(◇) and 20 (x).
Figure 7.
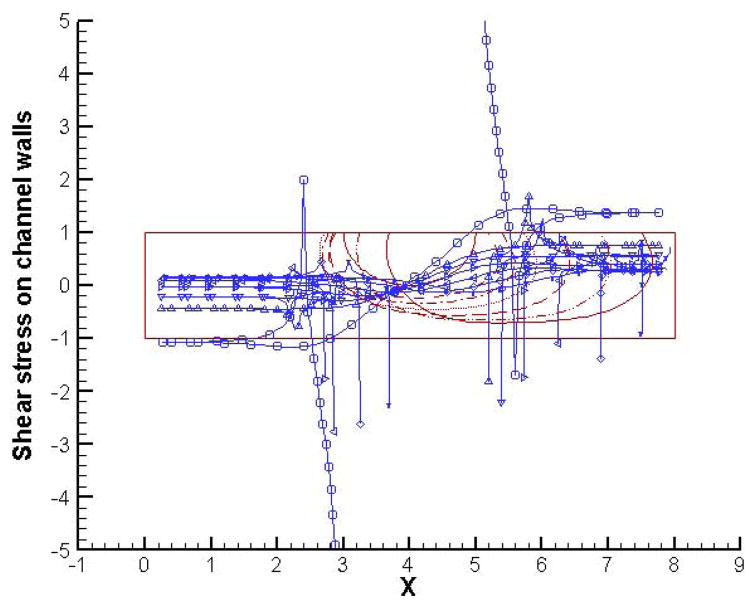
Shear stress profiles along channel walls for initial bubble pressure = 1 and p(in) = 2; p(out) = 1, at t = 0 (○), 1(△), 2(▽), 4(>), 8(<), 14(◇) and 20 (x).
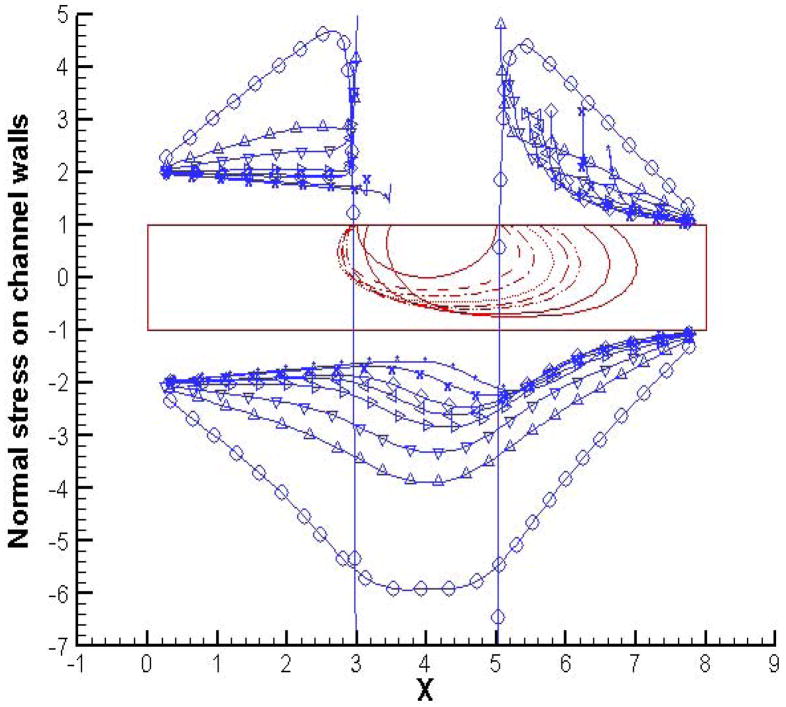
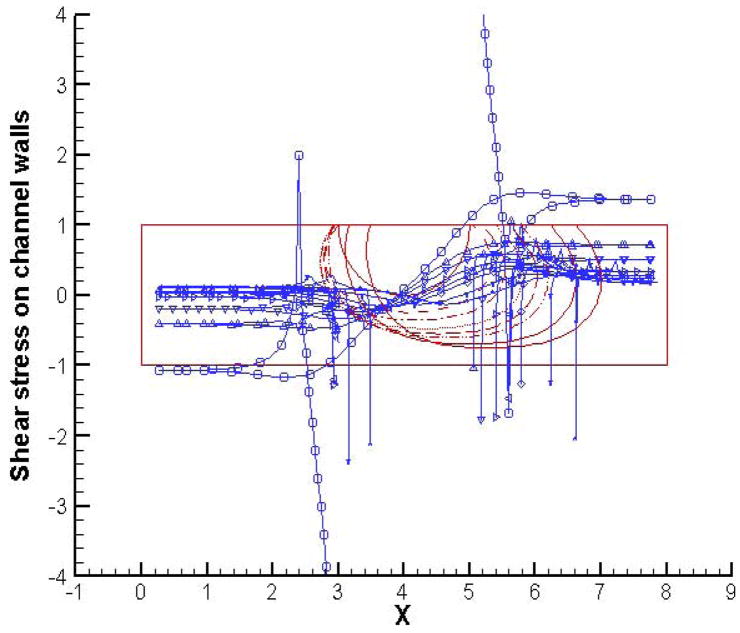
Figures 8 and 9 present a contrast to the above situation with normal and shear wall stress profiles for the case with initial bubble pressure of 8. Here the bubble expands rapidly resulting in bulges in the normal stress profiles. This is more pronounced on the lower channel wall as it serves to work against the bubble expansion and results in a flattening of the interface and hence an elongation of the bubble. Again, as the bubble expansion slows down and the dominant bubble motion becomes its sliding along the channel wall, the bulge in the normal stress profiles is considerably reduced, and the stress profiles are converging to a situation without any bubble in the channel. Thus, at later times, the presence of the bubble does not seem to affect the wall normal stresses much. The exceptions are the contact lines, which are associated with peaks in the normal stress profiles and continue to threaten the underlying endothelium with high values of stress. The shear stress profiles again show an increase in magnitude both upstream and downstream of the bubble. Note that the signs are opposite of the case where the bubble contracts. This is expected since the expanding bubble pushes the fluid away and out of the inlet and outlet, as opposed to the contracting bubble pulling the fluid inward, the two cases thus setting the fluid motion in opposite directions. At later times, the shear stress values decrease along the wall except for the contact lines which continue to be associated with peaks in the profiles. Note that while the normal stress profiles in both cases seem to converge to profiles that we would find without any bubble, the shear stress profiles clearly show a difference in magnitude between the upstream and downstream directions even for later times. This corresponds with the outflow rate being higher than the inflow rate for all the cases owing to the front interface of the bubble pushing the fluid as the bubble advances along the channel.
Figure 8.
Normal stress profiles along channel walls for initial bubble pressure = 8 and p(in) = 2; p(out) = 1, at t = 0 (○), 1(△), 2(▽), 4(>), 8(<), 14(◇) and 20 (x).
Figure 9.
Shear stress profiles along channel walls for initial bubble pressure = 8 and p(in) = 2; p(out) = 1, at t = 0 (○), 1(△), 2(▽), 4(>), 8(<), 14(◇) and 20 (x).
B. With contact angle hysteresis
We now repeat the above simulations with contact angle hysteresis incorporated in the formulation, i.e. the contact line velocities are specified using the modified form of Tanner’s law as given in Equation 8. The advancing and receding values of the static contact angle are set to be 50° and 70° respectively. Results are presented in exactly the same order as above and the focus is on determining the effects of contact angle hysteresis on the bubble motion and induced wall stresses.
Figure 10 presents the evolution of bubble interface for the four cases, i.e. initial bubble pressures of 1, 2, 4 and 8. In the first case, we notice that incorporation of contact angle hysteresis dramatically changes the bubble evolution. Without any hysteresis, the bubble continued to slide along the wall after its initial rapid contraction. However, here the bubble comes to a stop. While the force exerted on the bubble by the surrounding fluid attempts to keep the bubble sliding along the wall, the contact forces at the contact lines resist this motion. The value of the contact forces would depend on several factors such as the contact line speeds, contact angles, properties of the surface and the specific liquid and gas present in the problem. While a simple Tanner law is not intended to model the effect of all these parameters, when we include contact angle hysteresis we do allow for the situation where the contact angles corresponding to a perfect counter-balance between the contact forces and the force exerted by the surrounding fluid are between the advancing and receding static contact angle values, which results in zero contact line velocities. This allows a situation where the bubble comes to a halt. While a situation similar to this can be hypothetically envisioned in the absence of contact line hysteresis, with both contact angles exactly equaling the static contact angle value for the above mentioned perfect counter-balance, it is easy to see that it is a very restrictive situation and the even the slightest perturbation of the contact angles would again set the contact lines in motion and disturb what is already a very precarious balance.
Figure 10.
Evolution of bubble interface for p(in) = 2; p(out) = 1 and initial bubble pressures of (a) 1, (b) 2, (c) 4 and (d) 8 with contact angle hysteresis.
In the other three cases considered here, the bubble does not come to a halt as above, but exhibits a stick-slip behavior. This is more clearly observable for the front contact line which, after moving initially to reduce the contact angle to 70°, has to then wait until the contact angle decreases below 50° (due to the bubble further leaning into the flow) before moving again. The rear contact line also shows this behavior in the case with initial bubble pressure of 8. As was pointed out in the discussion for the first set of simulations, the bubble expansion is so pronounced in this case that the rear contact line actually moves to the left initially and later changes direction and starts moving to the right as the bubble slides along with the flow. During this reversal of direction, the contact angle value spends some time between the limits of 50° and 70°, thus causing the rear contact line velocity to stay zero during this time. This stick-slip behavior has one more consequence. When the contact lines are in their “pinned” state with zero velocity, the interface keeps evolving in accordance with the stress jump condition (unless we have a situation like our first case with an initial bubble pressure of 1 where the bubble comes to a complete stop). This results in a more pronounced “balloon” like shape of the bubble.
As we have seen earlier, after the rapid initial contraction/expansion of the bubble, the long term dynamics of the bubble are governed by its response to the decreasing surrounding pressure as it slides along the channel into the lower pressure regions, causing it to slowly expand and reduce its internal pressure to maintain equilibrium with its surroundings. Now, due to the stick-slip behavior at the contact lines that involves periods of times when the contact lines do not move, the bubble takes a longer time to slide the same distance when compared to our earlier simulations without any hysteresis effects. The rate at which the bubble experiences a decrease in the surrounding pressure field is thus slower. This should correspond to a slower rate of expansion of the bubble (and correspondingly a slower rate of the decline of pressure within the bubble). We observe these features in Figure 11 where the evolution of bubble pressure and volume are presented. The coming to a halt of our bubble with an initial pressure of 1 is also reflected in these results as the pressure and volume of the bubble converge to values that stay constant thereafter. For the other three cases, the long term dynamics are slower than the case without any hysteresis.
Figure 11.
Evolution of bubble pressure (solid line) and bubble volume (dashed line) for p(in) = 2; p(out) = 1 and initial bubble pressures of 1 [○], 2 [◇], 4 [▽] and 8 [△] with contact angle hysteresis.
Figure 12 shows the variation of front and rear contact line speeds with time, to further elucidate the features of the stick-slide behavior observed in the presence of contact angle hysteresis. The halt of the bubble with an initial pressure of 1 is confirmed by the fact that both the contact lines reach a velocity of zero. The front contact line of course stops first since the front contact angle reduces faster due to the bubble leaning into the flow. This corresponds to what we see in the evolution of bubble interface in Figure 10(a). The front contact line shows the stick-slide behavior in all the cases, with the amount of time it spends at rest decreasing as the initial bubble pressure increases. This makes sense from two perspectives. First, a higher initial bubble pressure will encourage the outward motion of the bubble interface and hence the forward motion of the front contact line. Second, larger bubbles lean more into the flow thus resulting in a quicker decrease of the front contact angle to values below the advancing contact angle. The observation made above, that the rear contact line also exhibits the stick-slide behavior when the bubble expands rapidly enough initially (our case with the initial bubble pressure of 8), is substantiated further when we look at the variation of the rear contact line speed with time for this case. We see that after dipping into negative values (i.e. moving to the left because of the rapid expansion), it slows down and comes to a halt, and starts moving to the right again only after the interface evolution results in the rear contact angle becoming greater than the receding contact angle value.
Figure 12.
Evolution of front (solid line) and rear (dashed line) contact line speeds for p(in) = 2; p(out) = 1 and initial bubble pressures of 1 [○], 2 [◇], 4 [▽] and 8 [△] with contact angle hysteresis.
An interesting consequence of the contact angle hysteresis effect is that the overshoot in the front contact line velocity profiles for the expanding bubble is reduced dramatically. The initial rapid expansion of the bubble causes the front contact angle to decrease quickly. When this contact angle becomes lesser than the receding contact angle value, the contact line comes to a halt, and waits till the contact angle goes below the advancing contact angle value before moving again. During this period when the contact line is not moving, the bubble keeps expanding rapidly to achieve equilibrium with its surroundings. Thus the expansion process, and the corresponding change in the front contact angle, slows down considerably by the time the front contact line starts moving again. If we don’t include contact angle hysteresis, this period where the contact line sits still while the bubble relaxes is absent, thus forcing the contact line to move at a rapid speed dictated by the bubble expansion process, go through an overshoot, and then eventually move at a speed that is dictated by the long term evolution of the bubble as it gently slides along the channel wall.
Let us now take a look at how including contact angle hysteresis affects the inflow and outflow rates (Figure 13). The initial behavior is governed by the rapid contraction or expansion of the bubble and results are similar for both with and without hysteresis. Hysteresis affects the long term evolution of the flow rates. In this regard, the very first observation we make is that the flow rates towards the end of the simulations for all the four cases, both at the inlet and outlet, are lower when we include hysteresis. Searching for an explanation for this brings our attention to two factors. Firstly, as was pointed out above, inclusion of hysteresis leads to periods when at least one of the contact lines is pinned down at a location, while the bubble interface keeps evolving. It was also pointed out that this feature, in the case of acute static contact angles, leads to a more pronounced balloon like shape of the bubble, with the bubble protruding into the channel to a greater extent. This can offer a greater blockage to the flow thus reducing a lower inflow rate. Secondly, for the cases where the bubble continues to slide along the channel, the outflow rate keeps increasing slowly as the front interface keeps pushing the fluid while advancing into regions of ever decreasing surrounding pressures. Since the bubble takes longer to travel the same distance when contact lines stick and slide, we would expect to see larger outflow rates if we continue these simulations further in time.
Figure 13.
Evolution of flow rates at inlet (Q(in); solid line) and outlet (Q(out); dashed line) for p(in) = 2; p(out) = 1 and initial bubble pressures of 1 [○], 2 [◇], 4 [▽] and 8 [△] with contact angle hysteresis.
In the case with an initial bubble pressure of 1, both the inflow and outflow rates are the same after the bubble comes to a stop, and the value they converge to is lower than the analytically computed flow rate for a Stokes flow through the channel for the same conditions without any bubble. The reason behind the outflow rate having been consistently higher than the inflow rate, for all the earlier simulations without hysteresis, was that the front interface of the sliding bubble pushes the fluid away as it advances into the lower pressure regions of the channel. This feature is of course absent when the bubble comes to a stop. Thus the ability to predict situations where the bubble sticks, when we include contact angle hysteresis, has an important consequence with respect to our desire to occlude flow to a tumor. Not only can we think of a reduction in inflow rate as a way to shunt flow away to different regions of the vasculature, we can also identify conditions in which we would obtain sticking, and predict the corresponding percentage occlusion at the vessel outlet. This would be a separate study in itself, one that we expect to report in the near future.
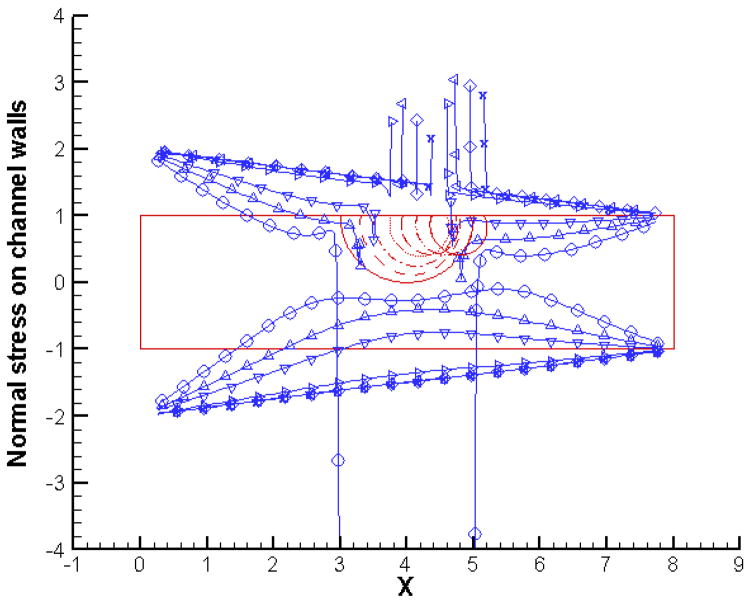
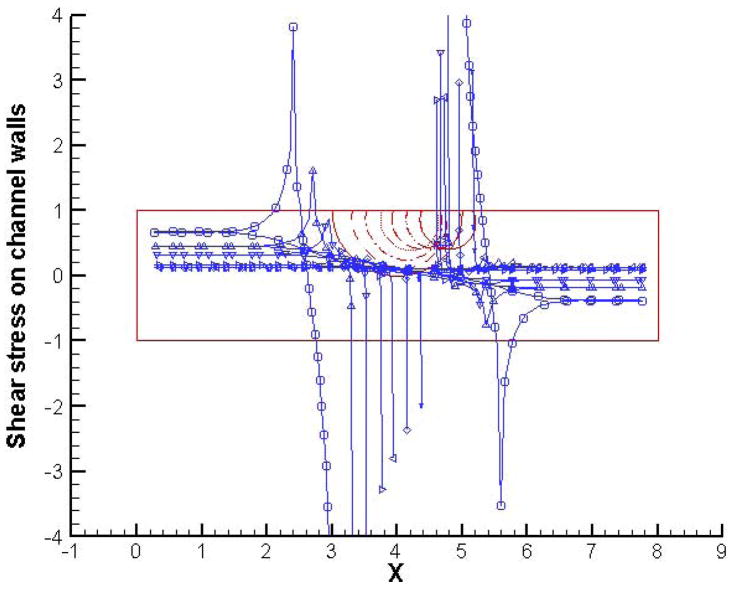
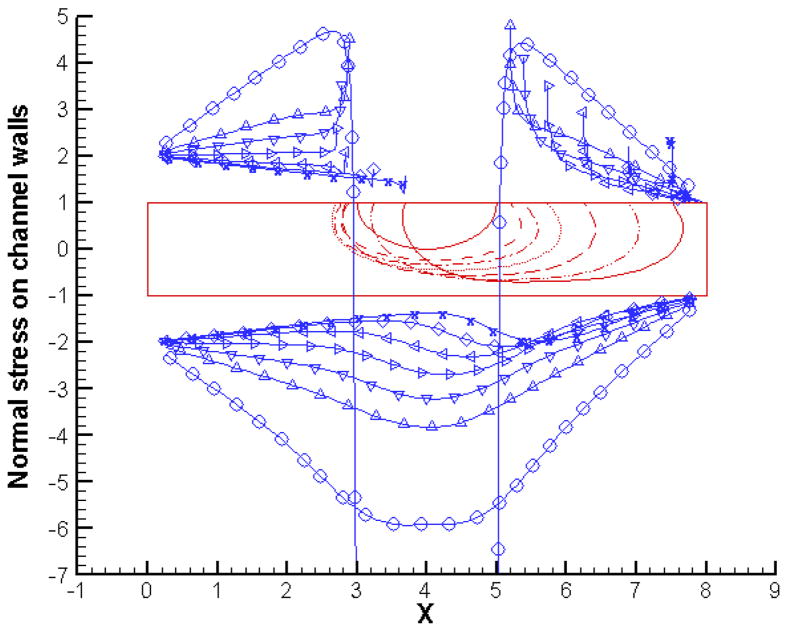
We now turn our attention to the wall normal and shear stress profiles. We again look at the two extreme cases in terms of the rapid initial bubble contraction/expansion. Figures 14 and 15 present the wall normal and shear stress profiles at a series of times for the case with initial bubble pressure of 1 [rapid initial contraction], while wall stresses for the case with initial bubble pressure of 8 [rapid initial expansion] are presented in Figures 16 and 17. As was already seen in the earlier simulations without any hysteresis effects, the rapid initial contraction (or expansion) of the bubble results in cusps (or bulges) in the wall normal stress profiles. The wall shear stress also increases as the fluid rushes in (or out) through the channel inlet and outlet, with opposite signs upstream and downstream of the bubble corresponding to opposite directions of flow in these areas. These features remain unchanged even when contact angle hysteresis is included. An interesting observation is that the normal contact stress at the front contact line, for the case with an initial bubble pressure of 1, increases substantially as the bubble comes to a halt (see Figure 14). The shear contact stress, on the other hand, shows an increase at the rear contact line for this case (see Figure 15). Thus, although we can attribute the sticking of the bubble to the contact stresses resisting the sliding motion, a detailed understanding of how this happens is yet to be attained.
Figure 14.
Normal stress profiles along channel walls for initial bubble pressure = 1 and p(in) = 2; p(out) = 1, with contact angle hysteresis, at t = 0 (▽25CB;), 1(△), 2(▽), 4(>), 6(<), 8(◇), 14 (x) and 20 (*).
Figure 15.
Shear stress profiles along channel walls for initial bubble pressure = 1 and p(in) = 2; p(out) = 1, with contact angle hysteresis, at t = 0 (○), 1(△), 2(▽), 4(>), 6(<), 8(◇), 14 (x) and 20 (*).
Figure 16.
Normal stress profiles along channel walls for initial bubble pressure = 8 and p(in) = 2; p(out) = 1, with contact angle hysteresis, at t = 0 (○), 1(△), 2(▽), 4(>), 6(<), 8(◇), 14 (x) and 20 (*).
Figure 17.
Shear stress profiles along channel walls for initial bubble pressure = 8 and p(in) = 2; p(out) = 1, with contact angle hysteresis, at t = 0 (○), 1(△), 2(▽), 4(>), 6(<), 8(◇), 14 (x) and 20 (*).
IV. CONCLUSIONS AND FUTURE WORK
We have presented detailed results from a computational study of a pressure driven 2-D channel Stokes flow with a bubble sticking and sliding along one of the walls using the boundary element method (BEM). The moving three phase contact lines were modeled using a Tanner law wherein the contact line speed is linearly proportional to the deviation of the contact angle from its equilibrium value. Results are presented with and without the effect of contact angle hysteresis. It is shown that the initial rapid contraction or expansion of the bubbles to achieve local equilibrium with the surrounding pressure field results in cusps and bulges respectively in the wall normal stress profiles. This will have a strong bearing on the gas embolotherapy strategy as we need to ensure that we do not cause any undesirable collapse or rupture of the blood vessels. The wall shear stress also increases (with opposite signs upstream and downstream of the bubble) as the fluid initially rushes in or out of the channel inlet and outlet. Contact lines are found to carry peaks in the wall normal and shear stress profiles at all times. This threatens the well being of the underlying endothelium and is a concern that has to be addressed in the design of the emobotherapy technique. In the long term, bubbles slowly expand as they slide along the channel wall. Including contact angle hysteresis allows us to predict the stick-slide behavior of bubbles, which in turn affects the long term evolution and dynamics of the bubbles.
A close look has also been taken at the effect of these bubbles on the flow rate through the channels by comparing the inflow and outflow rates with the analytically computed value of the flow rate for a Stokes flow through a 2-D channel for the conditions without any bubbles. Initially, the flow rates at the inlet and outlet are driven by the rapid contraction (fluid rushes in from both ends) or expansion (fluid rushes out). At later stages when the bubble evolution and dynamics are governed by its slow slide along the wall to the lower pressure region, we see that the inflow rate is always lower than what we would have without any bubble. A bubble can thus be used to shunt the flow away from a given portion of the vasculature. It is also seen that the advancing interface of the bubble pushes the fluid along, thus causing the outflow rate to be higher than the inflow rate. When we include contact angle hysteresis, we can have cases where the bubble comes to a halt. In such situations, the outflow rate and inflow rate are of course equal, thus signifying overall occlusion of the flow through the channel. Since contact angle hysteresis is an effect present in reality, it will be of use to predict the range of conditions for which bubbles of different sizes stick and compute the percentage of occlusion for these cases.
The study presented here varied only the initial bubble pressure, while keeping the initial interfacial curvature, static contact angles, contact line speed (through the proportionality constant in the Tanner law), channel dimensions, and inlet and outlet pressures the same. While this study has served to reveal many important features of the bubble evolution and dynamics and its influence on the surrounding flow field and the wall stresses, there is a vast parameter space yet to be probed carefully. In addition, many of the simplifying assumptions have to be relaxed to allow for more realistic simulations that include effects of wall flexibility and roughness, non Newtonian nature of blood, pulsatility of flow, etc.
Acknowledgments
This work was supported by NIH grants R01EB006476 and EB003541, NSF grant BES-0301278, and Whitaker Foundation grant RG-03-0017.
Footnotes
Publisher's Disclaimer: This is a PDF file of an unedited manuscript that has been accepted for publication. As a service to our customers we are providing this early version of the manuscript. The manuscript will undergo copyediting, typesetting, and review of the resulting proof before it is published in its final citable form. Please note that during the production process errors may be discovered which could affect the content, and all legal disclaimers that apply to the journal pertain.
References
- 1.Ajaev VS, Homsy GM. Modeling shapes and dynamics of confined bubbles. Annual Review of Fluid Mechanics. 2006;38:277–307. [Google Scholar]
- 2.Allen R, Meyer J, Knight W. Thermodynamics and hydrodynamics of thermal ink jets. Hewlett-Packard J. 1985;36:21–27. [Google Scholar]
- 3.Asai A. Three-dimensional calculation of bubble growth and drop ejection in a bubble jet printer. J Fluids Eng. 1991;114:638–641. [Google Scholar]
- 4.Benkreira H, Patel R. Direct gravure roll coating. Chem Eng Sci. 1993;48:2329–2335. [Google Scholar]
- 5.Brebbia CA. Boundary Elements: An Introductory Course. UK: WIT Press; 1992. [Google Scholar]
- 6.Bohan MFJ, Claypole TC, Gethin DT. The effect of process parameters on product quality of rotogravure printing. Proc Inst Mech Eng Part B. 2000;214(3):205–219. [Google Scholar]
- 7.Bull JL. Cardiovascular bubble dynamics. Critical Reviews in Biomedical Engineering. 2005;33(4):299–346. doi: 10.1615/critrevbiomedeng.v33.i4.10. [DOI] [PubMed] [Google Scholar]
- 8.Bull JL, Hunt AJ, Meyhofer E. A theoretical model of a molecular-motor-powered pump. Biomedical Microdevices. 2005;7(1):21–33. doi: 10.1007/s10544-005-6168-6. [DOI] [PubMed] [Google Scholar]
- 9.Calderon AJ, Fowlkes JB, Bull JL. Bubble splitting in bifurcating tubes: a model study of cardiovascular gas emboli transport. Journal of Applied Physiology. 2005;99:479–487. doi: 10.1152/japplphysiol.00656.2004. [DOI] [PubMed] [Google Scholar]
- 10.Calderon AJ, Heo YS, Huh D, Futai N, Takayama S, Fowlkes JB, Bull JL. A microfluidic model of bubble lodging in microvessel bifurcations. Applied Physics Letters. 2006;89(24):244103. [Google Scholar]
- 11.Cavanagh DP, Eckmann DM. Interfacial dynamics of a stationary gas bubble in flows in inclined tubes. Journal of Fluid Mechanics. 1999;398:225–244. [Google Scholar]
- 12.Cavanagh DP, Eckmann DM. The effects of soluble surfactant on the interfacial dynamics of a stationary bubble in inclined tubes. Journal of Fluid Mechanics. 2002;469:369–400. [Google Scholar]
- 13.Chang HK, Delaunois L, Boileau R, Martin RR. Redistribution of pulmonary blood flow during experimental air embolism. Journal of Applied Physiology. 1981;51(1):211–217. doi: 10.1152/jappl.1981.51.1.211. [DOI] [PubMed] [Google Scholar]
- 14.Chang HK, Weber ME, Thomson J, Martin RR. Hydrodynamics features of pulmonary air embolism: a model study. Journal of Applied Physiology: Respiratory, Environmental and Exercise Physiology. 1981;47:539–543. doi: 10.1152/jappl.1981.51.4.1002. [DOI] [PubMed] [Google Scholar]
- 15.Collard G. Pad-transfer printing – taking a new look. Plastics Engineering. 1984;40(2):49–50. [Google Scholar]
- 16.Cox RG. The dynamics of the spreading of liquids on a solid surface. Part 1 Viscous flow. Journal of Fluid Mechanics. 1986;168:169–194. [Google Scholar]
- 17.Dussan EBV. The moving contact line: the slip boundary condition. Journal of Fluid Mechanics. 1976;77(4):665–684. [Google Scholar]
- 18.Dussan EBV. On the Spreading of liquids on solid surfaces: static and dynamic contact lines. Annual Review of Fluid Mechanics. 1979;11:371–400. [Google Scholar]
- 19.Eckmann DM, Branger AB, Cavanagh DP. Gas embolism. New England Journal of Medicine. 2000;341(26):2000–2001. [PubMed] [Google Scholar]
- 20.Eshpuniyani B, Bull JL. A boundary element model of vascular gas bubble sticking and sliding. In: Brebbia CA, editor. Modeling in Medicine and Biology. WIT Press; Southampton: 2005. [Google Scholar]
- 21.Eshpuniyani B, Fowlkes JB, Bull JL. A bench top experimental model of bubble transport in multiple arteriole bifurcations. International Journal of Heat and Fluid Flow. 2005;26(6):865–872. [Google Scholar]
- 22.Gennes PGD. Wetting: statics and dynamics. Rev Mod Phys. 1985;57:827–863. [Google Scholar]
- 23.Greenspan HP. On the motion of a small viscous droplet that wets a surface. Journal of Fluid Mechanics. 1978;84(1):125–143. [Google Scholar]
- 24.Guthrie JT. The physical-chemical and philosophical aspects of screen printing processes. JOCCA - Surface Coatings International. 1992;75(3):94–96. [Google Scholar]
- 25.Hocking LM. The spreading of drops with intermolecular forces. Physics of Fluids. 1994;6(10):3224–3228. [Google Scholar]
- 26.Kornev KG, Neimark AV, Rozhkov AN. Foam in porous media: thermodynamics and hydrodynamic peculiarities. Adv Colloid Interface Sci. 1999;82:127–187. [Google Scholar]
- 27.Kripfgans OD, Fowlkes JB, Miller DL, Eldevik P, Carson PL. Acoustic droplet vaporization for therapeutic and diagnostic applications. Ultrasound in Medicine & Biology. 2000;26(7):1177–1189. doi: 10.1016/s0301-5629(00)00262-3. [DOI] [PubMed] [Google Scholar]
- 28.Kripfgans OD, Fowlkes JB, Woydt M, Eldevik OP, Carson PL. In vivo droplet vaporization for occlusion therapy and phase aberration correction. IEEE Transactions on Ultrasonics Ferroelectrics and Frequency Control. 2002;49(6):726–738. doi: 10.1109/tuffc.2002.1009331. [DOI] [PubMed] [Google Scholar]
- 29.Kripfgans OD, Fabiili ML, Carson PL, Fowlkes JB. On the acoustic vaporization of micrometer-sized droplets. Journal of the Acoustical Society of America. 2004;116(1):272–281. doi: 10.1121/1.1755236. [DOI] [PubMed] [Google Scholar]
- 30.Kripfgans OD, Orifici CM, Carson PL, Ives KA, Eldevik OP, Fowlkes JB. Acoustic droplet vaporization for temporal and spatial control of tissue occlusion: A kidney study. IEEE Transactions on Ultrasonics Ferroelectrics and Frequency Control. 2005;52(7):1101–1110. doi: 10.1109/tuffc.2005.1503996. [DOI] [PubMed] [Google Scholar]
- 31.Kunz W. Interactions between materials involved in gravure printing. Wochenblatt Fur Papierfabrikation. 1983;111(6):1922. [Google Scholar]
- 32.Lo AH, Kripfgans OD, Carson PL, Fowlkes BJ. Spatial control of gas bubbles and their effects on acoustic fields. Ultrasound in Medicine & Biology. 2006;32(1):95–106. doi: 10.1016/j.ultrasmedbio.2005.09.009. [DOI] [PubMed] [Google Scholar]
- 33.Maneri CC, Zuber N. An experimental study of plane bubbles rising at an inclination. International Journal of Multiphase Flow. 1974;1:623–645. [Google Scholar]
- 34.Masliya J, Jauhari R, Gray M. Drag coefficients for air bubbles rising along an inclined surface. Chemical Engineering Science. 1994;49(12):1905–1911. [Google Scholar]
- 35.Maxworthy T. Bubble rise under an inclined plate. Journal of Fluid Mechanics. 1991;229:659–674. [Google Scholar]
- 36.Miksis MJ. In: Contact Lines, A Celebration of Mathematical Modeling, The Joseph B. Keller Anniversary Volume. Givoli D, Gnote MJ, Papanicolaou GC, editors. Kluwer Press; 2004. pp. 161–180. [Google Scholar]
- 37.Mock GN. The development of rotary-screen printing. Textile Chemist and Colorist & American Dyestuff Reporter. 1999;1(3):43–49. [Google Scholar]
- 38.Muth CM, Shank ES. Primary care: gas embolism. New England Journal of Medicine. 2000;342(7):476–482. doi: 10.1056/NEJM200002173420706. [DOI] [PubMed] [Google Scholar]
- 39.Norman CE, Miksis MJ. Gas bubble with a moving contact line rising in an inclined channel at finite Reynolds number. Physica D. 2005;209:191–204. [Google Scholar]
- 40.Piette P, Morin V, Maume JP. Industrial-scale rotogravure printing tests. Wochenblatt Fur Papierfabrikation. 1997;125(16):744. [Google Scholar]
- 41.Pomeau Y. Recent progress in the moving contact line problem: a review. C R Mecanique. 2002;330:207–222. [Google Scholar]
- 42.Powell CA, Savage MD. Numerical simulation of transient free surface flow with moving contact lines. Commun Numer Meth Engng. 2001;(17):581–588. [Google Scholar]
- 43.Powell CA, Savage MD, Gaskell PH. Modeling the meniscus evacuation problem in direct gravure coating. Trans Inst Chem Eng. 2000;78(A):61–67. [Google Scholar]
- 44.Powell CA, Savage MD, Guthrie JT. Computational simulation of the printing of Newtonian liquid from a trapezoidal cavity. International Journal of Numerical Methods for Heat & Fluid Flow. 2002;12(4):338–355. [Google Scholar]
- 45.Pozrikidis C. Boundary Integral and Singularity Methods for Linearized Viscous Flow. Cambridge University Press; 1992. [Google Scholar]
- 46.Schleizer AD, Bonnecaze RT. Displacement of a two-dimensional immiscible droplet adhering to a wall in shear and pressure-driven flows. Journal of Fluid Mechanics. 1999;383:29–54. [Google Scholar]
- 47.Schwartz LW, Moussalli P, Campbell P, Eley RR. Numerical modeling of liquid withdrawal from gravure cavities in coating operations. Trans Inst Chem Eng. 1998;76(A):22–29. [Google Scholar]
- 48.Shikhmurzaev YD. Moving contact lines in liquid/liquid/solid systems. Journal of Fluid Mechanics. 1997;334:211–249. [Google Scholar]
- 49.Stone H, Stroock AD, Ajdari A. Engineering flows in small devices: microfluidics toward a lab-on-a-chip. Annual Review of Fluid Mechanics. 2004;36:381–411. [Google Scholar]
- 50.Tsao HK, Koch DL. Observations of high Reynolds number bubbles interacting with a rigid wall. Physics of Fluids. 1997;9(1):44–56. [Google Scholar]
- 51.Vann RD, Thalmann ED. Decompression Physiology and Practice. In: Bennett PB, Elliot DH, editors. The Physiology and Medicine of Diving. Saunders; London: 1993. pp. 376–432. [Google Scholar]
- 52.Wooding RA, Morel-Seytoux HJ. Multiphase fluid flow through porous media. Annual Review of Fluid Mechanics. 1976;8:233–274. [Google Scholar]
- 53.Ye T, Bull JL. Direct numerical simulations of micro-bubble expansion in gas embolotherapy. Journal of Biomechanical Engineering. 2004;126(6):745–759. doi: 10.1115/1.1824131. [DOI] [PubMed] [Google Scholar]
- 54.Ye T, Bull JL. Microbubble expansion in a flexible tube. Journal of Biomechanical Engineering. 2006;128(4):554–563. doi: 10.1115/1.2206200. [DOI] [PubMed] [Google Scholar]
- 55.Zukoski EE. Influence of viscosity, surface tension and inclination angle on motion of long bubbles in closed tubes. Journal of Fluid Mechanics. 1966;25(4):821–837. [Google Scholar]


