

Abstract
PURPOSE
To evaluate the efficacy of susceptibility weighted imaging (SWI) in comparison to standard T1 weighted post gadolinium contrast (T1-Gd) MRI in patients with Sturge-Weber Syndrome (SWS).
MATERIALS AND METHODS
Twelve children (mean age 5.6 years) with the diagnosis of SWS and unilateral hemispheric involvement were recruited prospectively and examined with high resolution 3D SWI and conventional T1-Gd. Both SWI and T1-Gd images were evaluated using a four-grade scoring system according to six types of imaging findings (enlargement of transmedullary veins, periventricular veins and choroid plexus, as well as leptomeningeal abnormality, cortical gyriform abnormality, and gray matter/white matter junctional abnormality). The scores of SWI vs. T1-Gd images were then compared for each type of abnormality.
RESULTS
SWI was superior to T1-Gd in identifying the enlarged transmedullary veins (p=0.0020), abnormal periventricular veins (p=0.0078), cortical gyriform abnormalities (p=0.0020), and grey matter/white matter junction abnormalities (p=0.0078). Conversely, T1-Gd was better than SWI in identifying enlarged choroid plexus (p=0.0050) and leptomeningeal abnormalities (p=0.0050).
CONCLUSION
SWI can provide useful and unique information complementary to conventional contrast enhanced T1 weighted MRI for characterizing SWS. Therefore, SWI should be integrated into routine clinical MRI protocols for suspected SWS.
Keywords: Susceptibility Weighted Imaging, Sturge-Weber Syndrome, contrast enhanced T1 weighted imaging, T1 gadolinium, Magnetic Resonance, Magnetic Resonance Imaging
INTRODUCTION
Sturge-Weber syndrome (SWS) is a rare neurocutaneous disorder, typically manifested in children and characterized by a cutaneous angioma, glaucoma, and leptomeningeal venous angiomatosis. The anomalous venous plexus over the cerebral surface leads to abnormal cortical drainage, progressive venous stasis, and chronic hypoxia. The vascular malformation most commonly affects the parieto-occipital region but may also extend to the frontal or temporal lobes. Neurological manifestations include seizures, hemiparesis, visual field cut, and cognitive deficits (1). Calcification, impaired cortical venous outflow, and abnormal deep venous collaterals are common in SWS. Unilateral hemispheric involvement is most frequent. Children with unilateral SWS may show profound cognitive impairment despite relatively limited unilateral cortical involvement [1]. This observation suggests that conventional imaging may underestimate the structural and/or functional cerebral abnormalities contributing to cognitive decline in children with SWS. Moreover, the precise etiology and pathophysiology of this disease remain unknown, and the clinical course is often progressive and highly variable.
MRI has been useful for the diagnosis and evaluation of the extent and severity of brain involvement in SWS. Specifically, T1 weighted gadolinium post contrast (T1-Gd) MRI can demonstrate focal cortical atrophy, contrast-enhancing leptomeningeal angiomatosis, and abnormal cerebral veins, and is currently an imaging standard for clinical SWS diagnosis [1–3]. Meanwhile, several new MRI techniques have been developed to allow the assessment of brain abnormalities from different aspects. Susceptibility weighted imaging (SWI) is one of relatively new MRI techniques, specifically designed to be sensitive to small changes in local magnetic susceptibility in the brain tissue [4–8]. SWI utilizes the susceptibility difference between tissues to enhance the “native” contrast of different tissue types. Many pathological conditions can be visualized by SWI more clearly than other techniques, including neurovasculature abnormalities, hemorrhage, calcification, iron deposit, and change of oxygenation level induced by blood flow or various disease processes [4, 5, 7]. The advantages of SWI have already been demonstrated in several diseases, including improved assessment of venous vasculature in multiple sclerosis [9], hemorrhagic shearing lesions [10, 11] and cerebral blood oxygenation disturbance [12] in traumatic brain injury, as well as internal structure of brain tumor lesions [13]. In a recent study, we have demonstrated the ability of SWI to detect both cortical abnormalities (including calcifications) and deep transmedullary veins in children with SWS [14]. It remained unclear, however, to what extent SWI could complement conventional MRI (with contrast administration) in the clinical diagnosis and management of SWS. In the present study, we hypothesized that SWI can provide better visualization of certain pathological conditions in SWS than T1-Gd. In order to evaluate this, we conducted a detailed qualitative and semi-quantitative analysis and comparison of SWI and T1-Gd images of prospectively collected patients with SWS in the present study.
MATERIALS AND METHODS
Patient Selection and Data Collection
Twelve children (age range: 1.5 – 12. 4 years, mean age: 5.6 years) with the diagnosis of Sturge-Weber syndrome were recruited prospectively as part of a longitudinal neuroimaging study. The inclusion criteria were (1) SWS characterized by a facial port wine stain and unilateral brain involvement (based on conventional, T1 weighted contrast enhanced MRI), including (but not confined to) the parieto-occipital lobes, and possible extension to the frontal or temporal lobes; and (2) Age 1–13 years at the time of enrollment. Patients with bilateral hemispherical involvement were excluded, because we needed a clear comparison between the affected and normal hemispheres. Ten of the twelve children had a history of seizures, and nine patients were on antiepileptic drug(s). Location of MRI findings (including location of SWI changes) and PET findings of 9 of the 12 patients (patients #1, 4, 6–12) have been reported in a previous study [14], where the relationship between MRI (including SWI) and PET abnormalities has been evaluated, but SWI abnormalities have not been quantified. Further, T1-Gd was not analyzed and formally compared to SWI changes in the previous study. Thus, despite the partial overlap between these two studies, the present study reports on a completely different aspect of SWI changes with an in-depth analysis of the potential clinical use of this technique as compared to the current gold standard T1-Gd MRI.
Prior to MRI scanning, children less than seven years of age were sedated with nembutal (3 mg/kg), followed by fentanyl (1 μg/kg). All children were continuously monitored by a pediatric nurse with special training in the sedation of children for radiological procedures. The physiological parameters monitored during the studies included heart and respiratory rates and pulse oximetry.
This work was approved by the Human Investigation Committee of our performing institution. Written informed consent was obtained from each patient’s parent or legal guardian prior to the study. The imaging studies were performed in full compliance with the regulations of the Human Investigation Committee.
MR Imaging
All MR studies were carried out on a 1.5 T Siemens Sonata (Siemens Medical Solutions, Erlangen, Germany) using the standard circularly polarized head coil. The MR protocol included scout pilot scans, followed by an axial T1 weighted scan (either a standard T1 weighted SE or a T1 weighted MP-RAGE), T2 weighted Turbo SE with TR/TE=5020/106 ms, 3D SWI, 2D MR spectroscopic imaging, T1-Gd, and diffusion tensor imaging (DTI). The T1-Gd imaging and DTI acquisitions were performed after injection of 0.1mmol/kg Gd-DTPA, Magnevist (Schering Berlex, New Jersey, U.S.A.). The total scan time was about an hour. Findings of MRS and DTI are not reported in this article, because this study focused on the imaging findings of SWI and T1-Gd. Furthermore, given the fact that T1-Gd images are superior to pre contrast T1 weighted images, only post contrast T1-Gd images were used to compare with SWI images without contrast agent. A post contrast T1-Gd acquisition was performed with a 3D gradient echo sequence with FA=20°, TR/TE=16/5.1 ms, acquisition resolution=512×256, FOV=256×256mm2, slice thickness=2 mm, and bandwidth = 80 Hz/pixel. The acquisition time was 4.4 minutes. The SWI acquisition was performed with a turbo 3D gradient echo sequence with FA= 20°, TR/TE=89/40 ms, acquisition matrix= 512×256×48, FOV= 256×256×96 mm3 and bandwidth = 160 Hz/pixel. First-order flow compensation was applied in all 3 orthogonal directions. The acquisition time was about 3.6 minutes. The images and data sets were transferred from the scanner to a PC workstation for post-processing using the method described in [5].
Post-processing of SWI
Both magnitude and phase information of SWI are used to enhance the visualization of abnormal changes in susceptibility in the veins or from hemorrhage [4–8]. The post processing of SWI images has been described in [7]. To provide the best SWI contrast, data are collected in the transverse plane [15]. Filtered phase images are used as a means to differentiate hemorrhage from veins from calcium. All images were processed offline using an in-house software, SPIN (Signal Processing in NMR). These post-processed SWI images were used for the evaluation of imaging findings in this study [4].
Evaluation of Images
The abnormalities were characterized in six categories by comparing the affected versus unaffected hemispheres on both SWI and T1-Gd images. The abnormalities were 1) transmedullary veins, 2) enlargement of periventricular veins, 3) enlargement of choroid plexus, 4) leptomeningeal abnormal signal or enhancement, 5) cortical gyriform abnormal signal or enhancement, and 6) abnormal signal or enhancement at gray matter/white matter junctions. Due to different contrast mechanisms, these abnormalities usually appear as hypointense areas on SWI images and hyperintense ares (enhancement) on T1-Gd images. The exception was the cortical gyriform abnormality on T1-Gd images; because there was no enhancement of the cortex on T1-Gd image, the hypointensity, instead of hyperintensity, at the cortex was evaluated.
One neuroradiologist and one neurologist examined all the images. For each case, these two raters made consensus agreement on the image findings of these six types of abnormalities by using a 4-point grading system: prominent = 3, moderate = 2, mild = 1, and no definite abnormality = 0. The grade of each abnormality for each patient was determined by evaluating the contrast of the abnormality with its surrounding brain tissue and the extent of the abnormality, in comparison with contralateral normal hemisphere. For the evaluation of transmedullary veins, the contrast of the visualized veins were assessed. For periventricular veins and the choroid plexus, the diameter of these vessels and their contrast to the surrounding tissue were evaluated. In the case-by-case evaluation, both T1-Gd and SWI images of each patient were reviewed side by side, for the purpose of a better comparison of the abnormalities. All of the patients were rated on the same day to keep the consistency in determining the grades. The raters were fully aware of the order of data acquisition sequences performed on each patient.
For the evaluation of SWI images, the decisions for grading were mainly based on mIP images. In addition, both SWI magnitude and phase images were examined to check the completeness and exact location of the image findings.
The group scores were expressed by means and standard deviations. A Wilcoxon’s signed rank test was performed to compare the results of SWI images to those of T1-Gd. A threshold of p<0.05 was used to determine statistical differences.
RESULTS
Figure 1 and Table 1 summarize the MRI findings for T1-Gd and SWI in the 12 SWS patients. In brief, SWI offered better contrast by showing significantly higher average grading scores than those of T1-Gd images for the identification of enlarged transmedullary veins (p=0.0020) and connecting periventricular veins (p=0.0078), cortical gyriform abnormality (p=0.0020), and hypointensity at the junction of gray matter and white matter (p=0.0078). On the other hand, T1-Gd images were significantly better than SWI for visualizing the enlarged choroid plexus (p=0.0005) and leptomeningeal abnormalities (p=0.0005). Each type of abnormality is described in further detail below.
Figure 1.

Number of patients with each type of abnormality identified by SWI and T1-Gd. P values are from Wilcoxon Signed Rank Test results comparing the group difference between SWI and T1-Gd findings.
Table 1.
Comparison of SWI and T1-Gd for identification of various abnormalities
| Case | Gender | Age (yr) | Affected hemisphere | Enlargement. of transmed. veins | Enlargement of periventr. veins | Enlargement of choroid plexus | Leptomening. abnormality | Cortical gyriform abnormality | GM/WM junction abnormality | ||||||
|---|---|---|---|---|---|---|---|---|---|---|---|---|---|---|---|
| SWI | T1-Gd | SWI | T1-Gd | SWI | T1-Gd | SWI | T1-Gd | SWI | T1-Gd | SWI | T1-Gd | ||||
| 1 | F | 2.8 | R | +++ | + | ++ | + | − | + | − | + | + | − | − | − |
| 2 | F | 2.7 | R | ++ | + | +++ | + | − | +++ | − | + | ++ | − | +++ | − |
| 3 | M | 9.3 | L | ++ | + | +++ | + | − | ++ | − | +++ | +++ | − | ++ | − |
| 4 | F | 4.9 | L | ++ | ++ | ++ | ++ | − | ++ | − | +++ | +++ | + | ++ | − |
| 5 | M | 12.4 | R | + | − | − | − | − | +++ | − | +++ | +++ | + | +++ | − |
| 6 | M | 1.9 | R | + | − | + | − | − | ++ | − | +++ | ++ | + | +++ | − |
| 7 | F | 8.1 | L | ++ | ++ | +++ | +++ | − | +++ | + | ++ | +++ | + | +++ | − |
| 8 | F | 9.5 | R | +++ | + | +++ | +++ | − | +++ | + | ++ | ++ | + | +++ | − |
| 9 | F | 8.9 | L | ++ | + | +++ | + | − | +++ | − | + | − | − | − | − |
| 10 | F | 1.5 | L | ++ | + | ++ | + | − | + | − | + | − | − | − | − |
| 11 | M | 1.9 | R | ++ | + | +++ | + | − | +++ | + | ++ | + | − | − | − |
| 12 | M | 3.3 | L | + | − | + | − | − | +++ | + | +++ | ++ | + | +++ | − |
| Average grade ±std | 1.92± 0.67 | 0.92±0.67 | 2.17±1.03 | 1.17±1.03 | 0 | 2.42±0.79 | 0.33±0.49 | 2.08±0.90 | 1.83±1.11 | 0.50±0.52 | 1.83±1.40 | 0 | |||
| Wilcoxon p value | 0.0020 | 0.0078 | 0.0005 | 0.0005 | 0.0020 | 0.0078 | |||||||||
Notes: Image grading system for visualizing the abnormality: +++ prominent, ++ moderate, + mild, −no definite abnormality;
transmed. (transmedullary), periventr. (periventricular), leptomening. (leptomeningeal), GM (gray matter), WM (white matter).
Enlarged transmedullary veins
These veins wind through the white matter toward the ventricular system by manifesting as abnormal hypointense streaks on SWI images and abnormal hyperintense streaks on T1-Gd images. SWI identified 3 more cases (in total 12 patients) than T1-Gd (in total 9 patients) to have enlarged transmedullary veins. Among the 9 cases identified by T1-Gd, SWI was superior in 7 cases by showing better contrast and/or larger diameter of the abnormality (Table 1). The average SWI grading was 1.9±0.7 in comparison to the average T1-Gd grading of 0.9±0.7.
Enlarged periventricular veins
These veins manifest as abnormal hypointense streaks on SWI images and abnormal hyperintense streaks on T1-Gd images, along the lateral ventricles. SWI identified 2 more cases (a total of 11 patients) than T1-Gd (9 patients) to have enlarged periventricular veins. Among the 9 cases identified by T1-Gd, SWI was superior in 6 cases by showing better contrast and/or larger diameter of the abnormality (Table 1). The average SWI grading was 2.2±1.0 in comparison to the average T1-Gd grading of 1.2±1.0.
Cortical gyriform abnormality
This abnormality manifests as hypointense areas along the surface of gyri on both SWI and T1-Gd images. T1-Gd identified 6 cases having mild cortical gyriform abnormalities. In comparison, SWI identified 4 additional cases. Furthermore, SWI was superior in all 6 cases which were also positive on T1-Gd by showing better contrast and/or larger extent (Table 1). The average SWI grading was 1.8±1.1 in comparison with the average T1-Gd image grading of 0.5±0.5.
Gray matter/white matter junction abnormality
This abnormality can be seen as abnormal hypointense areas deep in the junction of gray matter and white matter. SWI successfully identified 8 cases and all showed at least a moderate level of contrast. In comparison, no case was identified by T1-Gd to have this abnormality (Table 1). The average SWI grading was 1.8±1.4 in comparison to the average T1-Gd image grading of 0.
Enlarged choroid plexus
This abnormality consists of hyperintense areas on T1-Gd images and hypointense areas on SWI images in the ventricular system. T1-Gd images successfully identified all of the 12 cases having enlarged choroid plexus; however, none of them were shown by SWI (Table 1). The average T1-Gd image grading was 2.4±0.8 in comparison to an SWI grading of 0.
Leptomeningeal abnormality
This abnormality is hyperintense on T1-Gd images and hypointense on SWI images. SWI identified 4 cases only, in comparison toT1-Gd detecting all of the 12 cases to have leptomeningeal abnormality. Among the 4 SWI identified cases, T1-Gd showed better contrast and/or larger extent in all of them (Table 1). The average T1-Gd grading was 2.1±0.9 and the average SWI grading was 0.3±0.5.
Characteristic examples
Figures 2–5 illustrate the characteristic findings of SWI and T1-Gd in four representative cases. In our exemplar cases, SWI showed the prominent transmedullary veins with unparalleled detail, extent, and clarity, while T1-Gd revealed only mild enhancement of a small number of these transmedullary veins (Figures 2, 3, and 5). Similarly, the periventricular veins, which connect the transmedullary veins, were also clearly shown by SWI (Figures 2, 3, 4, and 5) with better contrast and larger extent as compared to T1-Gd. In addition, SWI clearly depicted the connectivity and continuity of these transmedullary and periventricular venous structures: the transmedullary veins wind through and, presumably, drain blood from the territory of the cortex and join the periventricular veins. However, the connectivity and continuity of these veins were not well visualized by T1-Gd.
Figure 2.

Patient # 1, a two year old girl. Image order: SWI mIP (over 4 adjacent slices with slab thickness of 8 mm ) (A), T1 post-gadolinium (T1-Gd) (B). On the T1-Gd MRI image (B), the enlarged transmedullary veins are observed as only mild enhancement (solid arrow) and periventricular veins observed as very tiny enlargement and barely seen (dashed arrow), in the right hemisphere. There is no connection information among these veins on T1-Gd. Comparatively, the transmedullary veins (solid arrow) and periventricular veins (dashed arrow) in the right hemisphere are much better visualized on SWI mIP image with a higher contrast and larger extent. Furthermore, SWI image clearly demonstrates the connection of these venous structures that cannot be seen on T1-Gd; the transmedullary veins wind through the white matter and are clearly connected to the periventricular veins.
Figure 5.

Patient #4, a 4.9 year old girl. Image sequence: SWI mIP(A) and T1-Gd (B). The abnormal gyri manifest as hypointensity on SWI image and extensive leptomeningeal enhancement on T1-Gd images (solid arrow). Abnormal gyriform hypointensities on SWI are located along cerebral cortex. Leptomeningeal enhancements are seen on the brain surface. Note that abnormalities on SWI are seen more within the cortex, while abnormalities on T1-Gd are seen more overlying the cortex, and slight hypointensities are seen along cortex. Both SWI and T1-Gd images reveal the winding transmedullary veins and abnormal periventricular vein (arrow head), and brain atrophy. However, the enlarged choroid plexus is visualized only by T1-Gd images (dashed arrow).
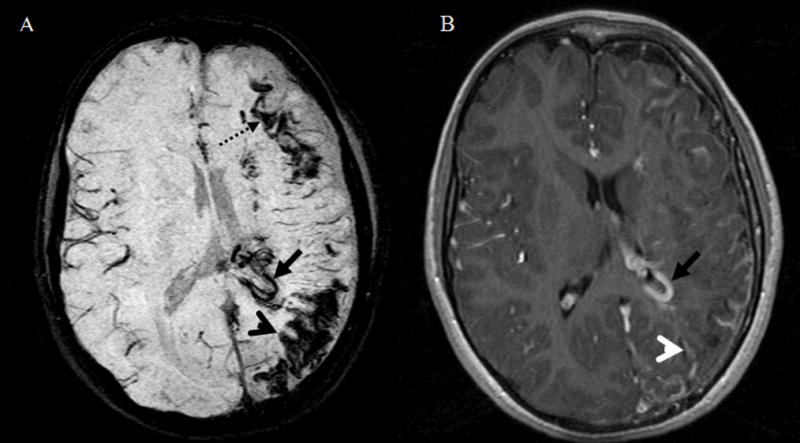
Figure 3.

Patient #11, a two-year old boy. Image order: SWI mIP (A) and T1 post-gadolinium (T1-Gd) (B). The transmedullary veins (white solid arrow) and the connecting periventricular veins (white dashed arrow) can be seen only as mild enhancements in the right hemisphere on the T1-Gd image. The T1-Gd image also shows the enlarged choroid plexus (white arrow head) and leptomeningeal abnormality (black solid arrow). In comparison, the SWI mIP image shows a clear network of transmedullary veins and periventricular veins with much larger extent and higher contrast than that on T1-Gd. However, the enlarged choroid plexus and leptomeningeal abnormality is not clearly visualized on SWI images.
Figure 4.
Patient #7, an 8-year old girl. Image order: SWI mIP (A) and T1 post-gadolinium (T1-Gd) (B). Both SWI and T1-Gd reveal abnormally enlarged periventricular veins (solid black arrow) and atrophy. SWI reveals the abnormal hypointensities at the junction of white matter and gray matter (black dashed arrow) that cannot be seen on T1-Gd images. Furthermore, SWI demonstrates cortical gyriform abnormality (black arrow head) located along cerebral cortex and not shown on T1-Gd images. In contrast, T1-Gd demonstrates extensive and prominent leptomeningeal agioma (white arrow head) located at brain surface and subarachnoid space and not shown by SWI.
The cortical gyriform abnormalities, located along the cerebral cortex, were also clearly seen on SWI images (Figures 4 and 5), while the abnormality was either not shown in T1-Gd images (Figures 4 and 5) or only mild enhancement was seen in some cases. Complementary to the abnormality in cortical gyri on SWI images, the T1-Gd demonstrated extensive and prominent leptomeningeal angiomas on Figures 4 and 5. The abnormal gyriform hypointensities on SWI were located along the cerebral cortex, while leptomeningeal enhancement was seen by T1-Gd on the brain surface and in the subarachnoid space, overlying the area abnormal on SWI.
The SWI showed prominent hypointensity at the GM/WM junction (Figure 4), while T1-Gd failed to reveal this abnormality. In comparison, the enlarged choroid plexus was clearly visualized on T1-Gd images (Figures 3 and 5); however, none of these abnormalities were visible on SWI images.
Finally, we have assessed whether maximum intensity projection (MIP) reconstruction of T1-Gd images would improve detection of some abnormalities by T1-Gd. After performing the MIP over 4 slices of T1-Gd images in all cases, which had the same thickness as that of SWI mIP images, we found that the visual contrasts of enlarged choroid plexus and leptomeningeal angiomas have improved on MIP T1-Gd images. Still, the MIP T1-Gd image did not offer any further improvement in visualizing transmedullary veins, abnormally enlarged periventricular veins, cortical gyriform abnormalities, or GM/WM junction abnormalities. In other word, the MIP T1-Gd image can only enhance the already advantageous aspects of T1-Gd images over SWI images; however, MIP reconstruction does not offer any improvement for visualizing abnormalities, which are better visualized by SWI.
DISCUSSION
Our results demonstrate that SWI offers complementary information over conventional contrast-enhanced T1 weighted imaging. Specifically, SWI was superior to T1-Gd in characterizing abnormal transmedullary veins, abmormal periventricular veins, cortical gyriform hypointensities, and GM/WM junction abnormalities. Even without administration of any contrast agent, SWI revealed abnormal deep venous structures with a high contrast ratio and unparalleled detail, showing extensive abnormalities not reported by other imaging techniques. In contrast, T1-Gd was definitely better than SWI in identifying enlarged choroid plexus and leptomeningeal angiomas.
SWI is specifically designed to detect small susceptibility changes induced by certain pathological conditions. In SWS, cortical abnormalities underlying the leptomeningeal angiomatosis can result from venous stasis leading to progressive hypoxia, necrosis and gliosis, as well as cortical calcification. Venous stasis causes hypoxia and an increase of local deoxyhemoglobin concentration [16–24]. Deoxyhemoglobin (paramagnetic) and calcifications (diamagnetic) cause small distortions of the local magnetic field and result in susceptibility changes. Therefore, abnormal venous oxygenation, calcification, hemorrhages, or any combination of them could generate magnetic field susceptibility contrast in SWI [4].
In our study population, abnormal transmedullary veins and enlarged periventricular veins were visualized in three cases on SWI but not on T1-Gd images. Moreover, even in the cases where T1-Gd demonstrated these abnormalities, SWI offered much better visual contrast and showed larger number or extent of the abnormalities. Our data are consistent with previous imaging studies demonstrating the presence of abnormally enlarged veins in SWS, which are thought to provide collateral drainage for venous blood toward the deep cerebral venous system and can become increasingly prominent as surface veins occlude progressively [20, 25, 26]. Our findings are also consistent with a recent SWS case report using SWI, which revealed abnormal transmedullary veins across the cerebral hemisphere in an infant without the administration of contrast enhancement [8]. In our study, SWI mIP images clearly demonstrated that the abnormal transmedullary veins wind through the cerebral hemisphere and join the periventricular veins to form a drainage network for its neighboring cerebral territory. The formation of these collateral veins could lead to the redistribution of the drainage of venous blood into the deep cerebral veins because of the dysfunctional superficial venous system and stagnation of venous blood within the affected area, which creates a pressure gradient that favors this redistribution [7, 8, 19, 20]. These enlarged regional transmedullary veins may have elevated deoxyhemoglobin concentration due to venous stasis and reduced perfusion. In our recent multimodal imaging study utilizing FDG PET and MRI, we have demonstrated that hypometabolic cortex in SWS matched well with cortical susceptibility changes on SWI, while deep transmedullary veins typically drained from cortical areas directly adjacent to severely hypometabolic cortical regions [27]. In addition, while T1-Gd images only show morphological changes of the veins, SWI offers not only morphological but also physiological information by characterizing the deoxygenation level of the venous blood [12].
While conventional MRI can delineate focal cortical atrophy and contrast-enhanced leptomeningeal angiomatosis, it is insensitive for calcifications [1–3, 25, 28, 29]. Cortical pathology in SWS includes gliosis, atrophy and perivascular calcifications [30, 31], which can be detected as “tramtrack-like” abnormalities on planar X-ray images [32] and gyriform hyperdensities on CT images [28]. The location and pattern of the gyriform hypointense lesions in the cortex and the hypointensities at the junction of GM/WM on SWI images are consistent with the pattern and location of CT findings of calcifications [28, 33]. In our 12 cases, however, previous CT scans could not be directly compared with MRI/SWI since the CT scans were performed in other institutions, in most cases, years earlier, when the initial diagnosis of SWS was made. In contrast to SWI, the leptomeningeal enhancement on T1 Gd is due to the leptomeningeal pial network stasis leading to diminished cortical perfusion [34, 35]. As calcification is often observed in meningeal arteries and in cortical and subcortical veins underlying the leptomeningeal angiomatosis [30, 36], the gyriform hypointense lesions, identified on the SWI image, match well with the leptomeningeal enhancement identified on the T1-Gd images. In fact, leptomeningeal enhancements were seen on the brain surface covering the area with underlying cortical abnormalities on SWI. The abnormalities on SWI were apparently confined within the cortex, presumably reflecting cortical calcification, while abnormalities on T1-Gd were seen more in the overlying cortex, consistent with angioma on the brain surface. Although these two MR modalities reveal different information, they complement each other and provide a more complete view of the tissue and vessel abnormalities.
In clinical setting, T1-Gd is the current MR imaging standard for diagnosing brain involvement in SWS. The pial angioma, the hallmark of brain involvement in SWS [25, 37], is comprised of capillaries and small veins forming tortuous folds in the subarachnoid space, with some penetration into the cortex and subcortical white matter [38, 39]. Both the leptomeningeal angiomatosis and the enlarged choroid plexus are far more clearly shown on T1-Gd than on SWI images. Altogether, SWI offers more information on venous abnormalities and calcifications, while T1-Gd demonstrates the characteristic findings of leptomeningeal angioma and enlarged choroid plexus present in SWS. A complementary use of these two technologies, therefore, could reveal more information of SWS abnormalities than any of the two alone.
Due to the progressive and highly variable nature of this rare disease, an accurate characterization of the extent and severity of brain involvement may improve patient management. The ability to show a redistribution of the venous system by SWI could assist in decision making on therapeutic intervention. For example, demonstration of well-developed deep collateral veins during the early course of the disease may help avoid unnecessary and presently not well established (but potentially harmful) therapeutic interventions such as aspirin therapy. Moreover, early detection of cortical calcium and iron deposits, may indicate the risk of imminent or progressive seizures in young children with SWS. In addition, SWI is particularly suitable to monitor the progression of the SWS longitudinally, especially in children because it requires no contrast agent administration. Furthermore, a complementary use of both SWI and conventional MRI for an accurate visualization of the entire extent of pathologic changes can help design the extent of cortical resection in selected patients with intractable seizures.
Although our results are consistent with previously published pathology and imaging findings, there is no direct histological validation of our imaging findings. Another limitation of this study is that the patient population in this study all had unilateral hemispheric involvement, while SWS can involve both hemispheres in a minority of the patients. The recruitment of a larger number of patients, including those with bilateral involvement, would be needed to further assess the utility of SWI in clinical settings at different stages and severity of the disease. While our SWI results are based on a 1.5 T scanner, it is anticipated that SWI will benefit from the higher resolution and signal-to-noise available at 3T.
In conclusion, SWI is better than contrast enhanced conventional MRI in detection of cortical and small venous abnormalities, while T1-Gd can better identify the enlarged choroid plexus and leptomeningeal angiomas than SWI. Therefore, SWI should be adopted as part of the routine clinical MR protocol to better characterize cerebral abnormalities of Sturge-Weber syndrome.
Acknowledgments
This project is supported by the Michigan Technology Tri-Corridor Fund (MTTC 085P5200251 to EMH) and by the National Institute of Neurological Disorders and Stroke grant RO1-NS041922 (CJ).
Footnotes
Institution of the Work Originated: Department of Radiology, Wayne State University, Detroit, MI 48201
References
- 1.Lee JS, Asano E, Muzik O, Chugani DC, Juhasz C, Pfund Z, Philip S, Behen M, Chugani HT. Sturge-Weber syndrome: correlation between clinical course and FDG PET findings. Neurology. 2001;57:189–95. doi: 10.1212/wnl.57.2.189. [DOI] [PubMed] [Google Scholar]
- 2.Fischbein NJ, Barkovich AJ, Wu Y, Berg BO. Sturge-Weber syndrome with no leptomeningeal enhancement on MRI. Neuroradiology. 1998;40:177–180. doi: 10.1007/s002340050563. [DOI] [PubMed] [Google Scholar]
- 3.Reid DE, Maria BL, Drane WE, Quisling RG, Hoang KB. CNS perfusion and metabolism abnormalities in Sturge-Weber syndrome. Journal of Child Neurology. 1997;12(3):218–222. doi: 10.1177/088307389701200313. [DOI] [PubMed] [Google Scholar]
- 4.Haacke EM, Xu Y, Cheng YC, Reichenbach JR. Susceptibility weighted imaging (SWI) Magn Res Med. 2004;52:612–8. doi: 10.1002/mrm.20198. [DOI] [PubMed] [Google Scholar]
- 5.Reichenbach JR, Venkatesan R, Schillinger DJ, Kido DK, Haacke EM. Small vessels in the human brain: MR venography with deoxyhemoglobin as an intrinsic contrast agent. Radiology. 1997;204:272–279. doi: 10.1148/radiology.204.1.9205259. [DOI] [PubMed] [Google Scholar]
- 6.Wang Y, Yu Y, Li D, et al. Artery and vein separation using susceptibility-dependent phase in contrast-enhanced MRA. J Magn Reson Imaging. 2000;12:661–670. doi: 10.1002/1522-2586(200011)12:5<661::aid-jmri2>3.0.co;2-l. [DOI] [PubMed] [Google Scholar]
- 7.Sehgal V, Delproposto Z, Haacke EM, Tong KA, Wycliffe N, Kido DK, Xu Y, Neelavalli J, Haddar D, Reichenbach JR. Clinical applications of neuroimaging with susceptibility-weighted imaging. J Magn Reson Imaging. 2005;22:439–450. doi: 10.1002/jmri.20404. [DOI] [PubMed] [Google Scholar]
- 8.Mentzel HJ, Dieckmann A, Fitzek C, Brandl U, Reichenbach JR, Kaiser WA. Early diagnosis of cerebral involvement in Sturge-Weber syndrome using high-resolution BOLD MR venography. Pediatr Radiol. 2005;35:85–90. doi: 10.1007/s00247-004-1333-2. [DOI] [PubMed] [Google Scholar]
- 9.Tan IL, van Schijndel RA, Pouwels PJW, van Walderveen MAA, Reichenbach JR, Manoliu RA, Barkhof F. MR Venography of Multiple Sclerosis. AJNR Am J Neuroradiol. 2000 June/July;21:1039–1042. [PMC free article] [PubMed] [Google Scholar]
- 10.Tong KA, Ashwal S, Holshouser BA, Shutter LA, Herigault G, Haacke EM, Kido DK. Detection of Hemorrhage in Children with Diffuse Axonal Injury. Radiology. 2003;227(2):332–339. doi: 10.1148/radiol.2272020176. [DOI] [PubMed] [Google Scholar]
- 11.Tong KA, Ashwal S, Holshouser BA, Nickerson JP, Wall CJ, Shutter LA, Osterdock RJ, Haacke EM, Kido DK. Diffuse Axonal Injury in Children: Clinical Correlation with Hemorrhagic Lesions. Ann Neurol. 2004;56:36–50. doi: 10.1002/ana.20123. [DOI] [PubMed] [Google Scholar]
- 12.Shen Y, Kou Z, Kreipkec CW, Petrovc T, Hu J, Haacke EM. In vivo measurement of tissue damage, oxygen saturation changes and blood flow changes after experimental traumatic brain injury in rats using susceptibility weighted imaging. Magnetic Resonance Imaging, 2007. 2007;25:219–227. doi: 10.1016/j.mri.2006.09.018. [DOI] [PubMed] [Google Scholar]
- 13.Sehgal V, Delproposto Z, Djamel Haddar, Haacke EM, Sloan AE, Zamorano LJ, Barger G, HU J, Xu Y, Prabhakaran KP, Elangovan IR, Neelavalli J, Haddar D, Reichenbach JR. Susceptibility-weighted imaging to visualize blood products and improve tumor contrast in the study of brain masses. J Magn Reson Imaging. 2006;24:41–51. doi: 10.1002/jmri.20598. [DOI] [PubMed] [Google Scholar]
- 14.Juhasz C, Haacke M, Hu J, Xuan Y, Makki M, Behen ME, Maqbool M, Muzik O, Chugani DC, Chugani HT. Multimodality imaging of cortical and white matter abnormalities in Sturge-Weber syndrome. AJNR Am J Neuroradiol. 2007;28:900–6. [PMC free article] [PubMed] [Google Scholar]
- 15.Xu Y, Haacke EM. The role of voxel aspect ratio in determining apparent vascular phase behavior in susceptibility weighted imaging. Magn Reson Imaging. 2006;24(2):155–60. doi: 10.1016/j.mri.2005.10.030. [DOI] [PubMed] [Google Scholar]
- 16.Thomas-Sohl KA, Vaslow DF, Maria BL. Sturge-Weber Syndrome: A Review. Pediatric Neurology. 2004;30:303–310. doi: 10.1016/j.pediatrneurol.2003.12.015. [DOI] [PubMed] [Google Scholar]
- 17.Baselga E. Sturge-Weber Syndrome. Seminars in Cutaneous Medicine and Surgery. 2004;23:87–98. doi: 10.1016/j.sder.2004.01.002. [DOI] [PubMed] [Google Scholar]
- 18.Aicardi J, Arzimanoglou A. Sturge-Weber syndrome. Internat Pediatr. 1991;6:129–134. [Google Scholar]
- 19.Bentson JR, Wilson GH, Newton T. Cerebral venous drainage pattern of the Sturge-Weber Syndrome. Radiology. 1971;101:111–118. doi: 10.1148/101.1.111. [DOI] [PubMed] [Google Scholar]
- 20.Vogl TJ, Stemmler J, Bergman C, Pflugger T, Egger E, Lissner J. MR and MR angiography in Sturge-Weber syndrome. AJNR Am J Neuroradiol. 1993;14:417–425. [PMC free article] [PubMed] [Google Scholar]
- 21.Coley SC, Britton J, Clarke A. Status epilepticus and venous infarctionin Sturge-Weber syndrome. Child’s Nerv Syst. 1998;14:693–696. doi: 10.1007/s003810050299. [DOI] [PubMed] [Google Scholar]
- 22.Okudaira Y, Arai H, Sato K. Hemodynamic compromise as a factor in clinical progression of Sturge-Weber syndrome. Childs Nerv Syst. 1997;13:214–219. doi: 10.1007/s003810050070. [DOI] [PubMed] [Google Scholar]
- 23.Sugama S, Yoshimura H, Ashimine K, Eto Y, Maekawa K. Enhanced Magnetic Resonance Imaging of Leptomeningeal Angiomatosis. Pediatr Neurol. 1997;17:262–265. doi: 10.1016/s0887-8994(97)00093-3. [DOI] [PubMed] [Google Scholar]
- 24.Mandelstam S, Andronikou S. MRI evaluation of venous abnormalities in children with Sturge- Weber syndrome. Journal of Pediatric Neurology. 2004;2:29–32. [Google Scholar]
- 25.Benedikt RA, Brown DC, Walker R, et al. Sturge-Weber syndrome: cranial MR imaging with Gd-DTPA. AJNR Am J Neuroradiol. 1993;14:409–15. [PMC free article] [PubMed] [Google Scholar]
- 26.Cure JK, Holden KR, van Tassel P. Progressive venous occlusion in a neonate with Sturge-Weber syndrome: demonstration with MR venography. AJNR Am J Neuroradiol. 1995;16:1539–42. [PMC free article] [PubMed] [Google Scholar]
- 27.Juhasz C, Haacke EM, Hu J, Xuan Y, Makki M, Behen ME, Maqbool M, Muzik O, Chugani DC, Chugani HT. Multimodality Imaging of Cortical and White Matter Abnormalities in Sturge-Weber Syndrome. AJNR Am J Neuroradiol. 2007;28:900–906. [PMC free article] [PubMed] [Google Scholar]
- 28.Welch K, Naheedy MH, Abroms IF, Strand RD. Computed tomography of Sturge-Weber syndrome. J Comput Assist Tomogr. 1980;4:33–36. doi: 10.1097/00004728-198002000-00006. [DOI] [PubMed] [Google Scholar]
- 29.Bodensteiner JB, Roach ES. Sturge-Weber syndrome: introduction and overview. In: Bodensteiner JB, Roach ES, editors. Sturge-Weber Syndrome. Sturge-Weber Foundation; Mt Freedom, NJ: 1999. pp. 1–10. [Google Scholar]
- 30.Norman MG, Schoene WC. The ultrastructure of Sturge-Weber disease. Acta Neuropathol. 1977;37:199–205. doi: 10.1007/BF00686879. [DOI] [PubMed] [Google Scholar]
- 31.Di Trapani G, Di Rocco C, Abbamondi AL, Caldarelli M, Pocchiari M. Light microscopy and ultrastructural studies of Sturge-Weber disease. Childs Brain. 1982;9:23–36. doi: 10.1159/000120032. [DOI] [PubMed] [Google Scholar]
- 32.Dimitri V. Tumor cerebral congenito (angioma cavernoso) Rev Assoc Med Argent. 1923;36:1029–1037. [Google Scholar]
- 33.Griffiths PD, Boodram MB, Blaser S, Armstrong D, Gilday DL, Harwood-Nash D. 99mTechnetium HMPAO imaging in children with the Sturge-Weber syndrome: a study of nine cases with CT and MRI correlation. Neuroradiology. 1997;39:219–24. doi: 10.1007/s002340050398. [DOI] [PubMed] [Google Scholar]
- 34.Lin DD, Barker PB, Hatfield LA, Comi AM. Dynamic MR perfusion and proton MR spectroscopic imaging in Sturge-Weber syndrome: correlation with neurological symptoms. J Magn Reson Imaging. 2006;24:274–81. doi: 10.1002/jmri.20627. [DOI] [PubMed] [Google Scholar]
- 35.Evans AL, Widjaja E, Connolly DJ, Griffiths PD. Cerebral perfusion abnormalities in children with Sturge-Weber syndrome shown by dynamic contrast bolus magnetic resonance perfusion imaging. Pediatrics. 2006;117:2119–25. doi: 10.1542/peds.2005-1815. [DOI] [PubMed] [Google Scholar]
- 36.Guseo A. Ultrastructure of calcification in Sturge-Weber Disease. Virchows Arch A Pathol Anat Histol. 1975;366:353–6. doi: 10.1007/BF00433894. [DOI] [PubMed] [Google Scholar]
- 37.Elster AD, Chen MY. MR imaging of Sturge-Weber syndrome: role of gadopentetae dimeglumine and gradient-echo techniques. AJNR Am J Neuroradiol. 1990;11:685–689. [PMC free article] [PubMed] [Google Scholar]
- 38.Wohlwill FJ, Yakovlev PI. Histoptahology of meningo-facial angiomatosis (Sturge-Weber’s disease) Neuropathol Exp Neurol. 1957;16:341–364. doi: 10.1097/00005072-195707000-00006. [DOI] [PubMed] [Google Scholar]
- 39.Nelson JS. The neuropathology of selected neurocutaneous diseases. Semin Pediatr Neurol. 1995;2:192–199. doi: 10.1016/s1071-9091(05)80030-0. [DOI] [PubMed] [Google Scholar]