Abstract
Using 3-mercaptopropyltrimethoxysilane (MPS)-coated (PbMg1∕3Nb2∕3O3)0.63–(PbTiO3)0.37 (PMN-PT)∕tin and lead zirconate titanate∕glass piezoelectric microcantilever sensors (PEMSs) with single-chain variable fragment (scFv) immobilized on the MPS surface, we have demonstrated real-time, label-free detection of human epidermal growth factor receptor 2 (Her2) in a background of 1 mg∕ml bovine serum albumin. Coupled with a scFv with a KD of 3.4×10⁻⁸M, the MPS-insulated PMN-PT∕tin PEMS 560 μm long and 720 μm wide exhibited a Her2 concentration sensitivity of 5 ng∕ml in a background of 1 mg∕ml BSA.
Human epidermal growth factor receptor 2 (Her2, also known as ErbB-2 and Her2∕neu) is a cancer antigen that is overexpressed in approximately 20%–25% of invasive breast cancers.1 The extracellular domain (ECD) of the Her2∕neu protein is often cleaved and released into the circulation with serum concentrations elevated in 20%–50% of patients with primary breast cancer and 50%–62% of metastatic disease.2, 3 Normal individuals have a Her2 concentration between 2 and 15 ng∕ml in the blood and breast cancer patients have blood Her2 levels from 15 to 75 ng∕ml.4 The screening of Her2 on tumor biopsies is often used to evaluate whether a patient may successfully respond to therapy with trastuzumab (Herceptin), a monoclonal anti-Her2 antibody. The most common tests for the overexpression of Her2 in the United States are immunohistochemistry (IHC), and fluorescence in situ hybridization (FISH).5 Although IHC and FISH are excellent tools for Her2 screening, they require a tissue sample. Alternatively, Her2 can be detected by a commercially available enzyme-linked immunosorbent assay (ELISA) by Oncogene Science.6, 7 Although ELISA may not require a biopsy it calls for tedious labeling procedures and thus is not rapid, direct or in situ.
Piezoelectric microcantilever sensors (PEMSs) consisting of a highly piezoelectric layer, such as lead zirconate titanate8, 9, 10 (PZT) or lead magnesium niobate–lead titanate,11, 12, 13 (PbMg1∕3Nb2∕3O3)0.63–(PbTiO3)0.37 (PMN-PT) bonded to a nonpiezoelectric layer such as tin are a new type of sensors capable of label-free detection in real time.11, 12, 13 Binding of the target antigen from the solution to a receptor immobilized on the sensor surface shifts the PEMS resonance frequency. Direct, label-free detection is achieved by monitoring the PEMS resonance frequency shift in real time.8, 9, 10, 11, 12, 13
In a previous study, we have demonstrated that 3-mercaptopropyltrimethoxysilane (MPS) can be used to coat a PEMS and serve both as an electrically insulating layer and as a substrate for immobilization of antibodies. The goal of this study was to investigate MPS-insulated PEMS for direct, rapid, label-free, in situ detection of Her2 at clinically relevant concentrations in mixed protein solutions. To selectively identify one protein (Her2) a single-chain variable fragment (scFv) specific to Her2 was covalently bonded to the surface of the PEMS.12 ScFv is genetically engineered antibody fragment (receptor), which can be produced using phage display techniques. They have been successfully produced for multiple targets, including Her2.14, 15
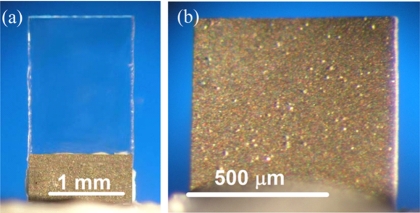
To show the generality of a MPS-coated PEMS, two types of PEMS were used in this study. Briefly, the less sensitive PZT∕glass (PEMS-A) constructed from commercial PZT 127 μm thick (T105-H4E-602, Piezo System, Cambridge, MA) 0.7 mm long, 1.4 mm wide bonded to a 150 μm thick glass layer (Fisher Scientific, Pittsburgh, PA) with a 2.2 mm long glass tip [see Fig. 1a] was used to demonstrate the real-time, label-free nature of the detection.12 A more sensitive PMN-PT∕tin PEMS (PEMS-B) 560 μm long, 720 μm wide consisting of an 8 μm thick PMN-PT layer13, 16, 17 bonded to a 4 μm thick tin layer was used to determine the concentration sensitivity [see Fig. 1b]. For electrical insulation, the PEMS were coated with MPS with a wet-solution coating method. More detailed descriptions of the PZT and PMN-PT PEMS fabrication and the MPS coating procedure can be found in Ref. 12.
Figure 1.
An optical micrograph of (a) PEMS-A, a 0.7 mm long, 1.4 mm wide PZT∕glass PEMS with a 2.2 mm long glass tip, and (b) PEMS-B, a 560 μm long, 720 μm wide PMN-PT∕Sn PEMS used in this study.
The target Her2 ECD was expressed from stably transfected HEK-293 cells and purified as previously described.18 The anti-Her2 scFv, H3, was isolated from a naive human scFv phage display library using techniques previously described.19 Specificity of the anti-Her2 H3 scFv for Her2 ECD was confirmed by surface plasmon resonance on a BIAcore 1000 instrument (BIAcore, Piscataway, NJ) and by flow cytometry against Her2 overexpressing human tumor cell lines.20 The binding kinetics of the H3 scFv have been measured by surface plasmon resonance on a BIAcore instrument using recombinant Her2 bound to the CM5 sensor chip. The scFv exhibits a ka of 1.8×10⁵ (1∕M s), a kd of 6.0×10⁻³ 1∕s and a KD 3.4×10⁻⁸M. This is consistent with a moderately low affinity for the Her2 target antigen.
Sulfosuccinimidyl-4-(N-maleimidomethyl) cyclohexane-1-carboxylate (sulfo-SMCC) (Pierce) was used as the bifunctional linker for scFv immobilization on MPS as described in a previous publication.12 For Her2 detection, scFv immobilized PEMS were then immersed in a homebuilt flow cell13 with a peristaltic pump (model 77120-62, Cole–Parmer’s Master Flex, Vernon Hills, IL) for both bovine serum albumin (BSA) blocking and Her2 detection with the PEMS’s two faces tangential to the flow at a flow rate of 0.5 ml∕min. The flow cell contained 3 ml of liquid.
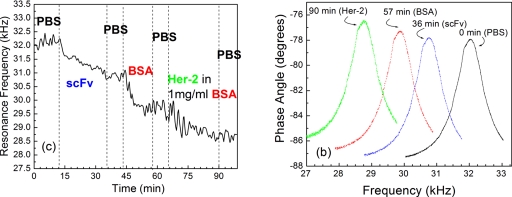
To illustrate the real-time nature of the PEMS, PEMS-A was placed in the flow cell and subjected to procedures from scFv immobilization, BSA blocking, and Her2 detection in a background of 1 mg∕ml of BSA, at a flow rate of 0.5 ml∕min. The results of this procedure are shown in Fig. 2a in the form of resonance frequency shift versus time. It started with 12 min of phosphate buffered saline (PBS) exposure. As can be seen, the resonance frequency of PEMS-A was flat with normal fluctuations. This PBS period was followed by the SMCC-linked scFv immobilization at t=12–35 min in which the resonance frequency of PEMS-A decreased with time, yielding a resonance frequency shift of roughly −1400 Hz at t=35 min. After the scFv immobilization procedure, PBS was then flown for 8 min, again to show that the resonance frequency of PEMS-A was stable with time in PBS. Between t=43 and 58 min, a solution of 10 mg∕ml BSA in PBS was flown in the flow cell to pre-emptively attach BSA to the sensor surface to minimize potential nonspecific BSA binding later in the Her2 detection in a background of BSA. Note that the resonance frequency shift due to the nonspecific BSA binding saturated at around t=50 min, yielding a resonance frequency shift of −1200 Hz at t=58 min. The saturation of nonspecific binding of BSA was important to make sure that later when PEMS-A was exposed to Her2 in a background of BSA the nonspecific binding due to BSA was minimal. Following the BSA blocking, PEMS-A was exposed to the flow of PBS at t=58–65 min, which showed negligible resonance frequency shift confirming the stability of the sensor. PEMS-A was then exposed to the flow of a 230 μg∕ml Her2 solution in a 1 mg∕ml solution of BSA in PBS att=65–90 min over which time period PEMS-A exhibited a resonance frequency shift of −950 Hz. A final background check of flow of PBS containing 1 mg∕ml BSA was conducted during t=90–100 min. As can be seen, no discernible resonance frequency shift was observed. To show the stability of the resonance peak, resonance spectra of PEMS-A at various time during the above testing are shown in Fig. 2b. As can be seen, the peak shape and the Q values remained roughly constant as the resonance peak frequency varied due to the various detection procedures during the period. The noise level of PEMS-A was about 200–300 Hz as shown in Fig. 2. However, in 1 mg∕ml BSA the signal for the resonant frequency shift was about 1100 Hz, which indicates the signal to noise ratio is above 4.
Figure 2.
(a) Resonance frequency vs time of PEMS-A: PBS at t=0–10 min, scFv immobilization at 10–35 min, PBS rinsing at 35–43 min, BSA blocking at 43–57 min, PBS rinsing at 57–65 min, and detection of Her2 at 0.1 mg∕ml in background of 1 mg∕ml BSA at 65–90 min and (b) the resonance spectra at t=0 min, 35 min (after scFv immobilization), 57 min (after BSA blocking), and 90 min (after Her2 detection). Note that throughout the detection period, the shape of the resonance peak and the Q value remained constant.
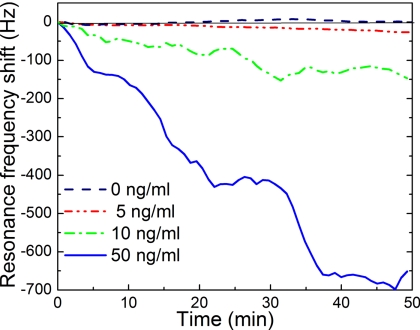
After showing the real-time nature of the detection of the PZT∕glass PEMS, the dose response sensitivity was investigated with PEMS-B at relevant Her2 concentrations because PEMS-B has been demonstrated to be more sensitive.12 First, PEMS-B was immobilized with scFv using the procedures described above. In each round of detection, PEMS-B was subject to a PBS flow for 10 min to establish the background followed by BSA blocking in a flow of 10 mg∕ml BSA in PBS until the resonance frequency of PEMS-B saturated (about 40 min). PEMS-B was then exposed to a solution containing 1 mg∕ml BSA and Her2 in one of the following concentrations: 50, 10, and 5 ng∕ml. After each detection PEMS-B was submerged in a solution of a 0.1M glycine solution titrated to pH=2.5 to release the bound Her2 from the sensor surface followed by rinsing PEMS-B with a solution of TWEEN-20 (Promega Madison WI) and flowing PBS across PEMS-B’s surface for 10 min. After the release, PEMS-B was then exposed to a different Her2 concentration in a background of 1 mg∕ml of BSA. PEMS-B was refunctionalized after three detections to minimize the degradation of the sensor from the potential damage of the scFv by the releasing solution.21 For each refunctionalization, the PEMS surface was cleaned in a 1:102 diluted Piranha solution and reinsulated with MPS as described above. A summary of PEMS-B’s resonance frequency shift versus time is shown in Fig. 3 where each curve was the average of two independent tests. As can be seen, PEMS-B yielded a resonance frequency shift of 675±160, 150±36, 40±6 Hz at t=50 min, for 50, 10, and 5 ng∕ml Her2 concentrations, respectively. For the control experiment a scFv immobilized and blocked PMN-PT PEMS is submerged in PBS with 1 mg∕ml BSA but no Her2 for 50 min. The result of the control experiment is shown as the dashed line in Fig. 3. As can be seen, there was no net shift in resonance frequency with standard deviation of about 5 Hz. Clearly, the 40±6 Hz shift at t=50 min at 5 ng∕ml was well above the standard deviation of the control (±5 Hz) or that of the detection at 5 ng∕ml (±6 Hz). The reason for the slow, almost linear response over the 50 min of detection at this concentration was in part due to the low concentration of 5 ng∕ml as well as the moderately low affinity (3.4×10⁻⁸M) of this scFv. It is also worth noting that the noise level (standard deviation) was considerably higher at a higher Her2 concentration: 160, 36, 6, and 5 Hz at 50, 10, 5, and 0 ng∕ml Her2. The same trend has been observed in in situ detection of other biological systems,13 suggesting that the noise during detection is related to binding of the antigen to the sensor surface. Furthermore, the noise level is clearly higher for PEMS-A than PEMS-B. This is a direct result of the differences between the Q values of the peaks. The Q value of PEMS-B, 90, was almost three times higher than that of PEMS-A which was about 30. This was likely due to the PEMS-B being cut with a wire saw while PEMS-A was cut by hand. The higher precision cutting allows for fewer imperfections in the geometry of PEMS-B, resulting in sharper peaks and a better Q value.
Figure 3.
Resonance frequency shift vs time of PEMS-B at 5, 10, and 50 ng∕ml of Her2 in a background of 1 mg∕ml BSA. All results were the average of two independent detections with frequency shifts of 675±160, 150±36, and 40±6 Hz at t=50 min, for 50, 10, and 5 ng∕ml Her2 concentrations, respectively. The control experiment at 0 ng∕ml of Her2 (dashed line) was obtained with a surrogate PMN-PT PEMS similar to PEMS-B. As can be seen, the surrogate PEMS 0±5 Hz at t=50 min at 0 ng∕ml of Her2.
In conclusion, we have demonstrated the real-time, label-free detection nature of Her2 detection in a background of 1 mg∕ml of BSA using MPS-coated PEMS with scFv immobilized on their surface. Furthermore, PEMS-B demonstrated that it could detect Her2 at a concentration of 5 ng∕ml in a background of 1 mg∕ml of BSA, which is lower than the 15 ng∕ml threshold. It is of interest to note that the 5 ng∕ml (∼5×10⁻¹¹M) concentration limit PEMS-B was about 700 times smaller than the KD (3.4×10⁻⁸M) of the H3 scFv used in this study.
Acknowledgments
This work was supported in part by the National Institute of Health (NIH) under Grant No. R01 EB000720, and the Nanotechnology Institute (NTI) of Southeastern Pennsylvania. And we appreciate the appropriation from the Commonwealth of Pennsylvania.
References
- Esteva F. J., Cheli C. D., Fritsche H., Fornier M., Slamon D., Thiel R. P., Luftner D., and Ghani F., Breast Cancer Res. Treat 7, R436 (2005). [DOI] [PMC free article] [PubMed] [Google Scholar]
- Fehm T., Gebauer G., and Jager W., Breast Cancer Res. Treat 75, 97 (2002). [DOI] [PubMed] [Google Scholar]
- Dittadi R., Zancan M., and Perasole A., Int. J. Biol. Markers 16, 255 (2001). [DOI] [PubMed] [Google Scholar]
- Meenakshi A., Kumar R. S., and Kumar N. S., J. Immunoassay 23, 293 (2002). [DOI] [PubMed] [Google Scholar]
- Bilous M., Dowsett M., Hanna W., Isola J., Lebeau A. Moreno A., Penault-Llorca F., Rüschoff J., Tomasic G., and Van de Vijver M., Mod. Pathol. 16, 173 (2003). [DOI] [PubMed] [Google Scholar]
- Wong W. L., Bajamonde A., Nelson B., Carney W., and Maas R. D., Proc. Am. Soc. Clin. Oncol. 19, 77a (2000). [Google Scholar]
- Tse C., Brault D., Gligorov J., Antoine M., Neumann R., Lotz J.-P., and Capeau J., Clin. Chem. 10.1373/clinchem.2004.044305 51, 1093 (2005). [DOI] [PubMed] [Google Scholar]
- Shen Z., Shih W. Y., and Shih W.-H., Appl. Phys. Lett. 10.1063/1.2219994 89, 023506 (2006). [DOI] [Google Scholar]
- Zhu Q., Shih W. Y., and Shih W.-H., Sens. Actuators B 10.1016/j.snb.2007.02.030 125, 379 (2007). [DOI] [PMC free article] [PubMed] [Google Scholar]
- Zhu Q., Shih W. Y., and Shih W.-H., Biosens. Bioelectron. 10.1016/j.bios.2007.02.005 22, 3132 (2007). [DOI] [PMC free article] [PubMed] [Google Scholar]
- Capobianco J., Shih W. Y., and Shih W.-H., Rev. Sci. Instrum. 10.1063/1.2403113 77, 125105 (2006). [DOI] [Google Scholar]
- Capobianco J., Shih W. Y., and Shih W.-H., Rev. Sci. Instrum. 10.1063/1.2727466 78, 046106 (2007). [DOI] [PubMed] [Google Scholar]
- McGovern J.-P., Shih W. Y., and Shih W.-H., Analyst (Cambridge, U.K.) 10.1039/b704579d 132, 777 (2007). [DOI] [PubMed] [Google Scholar]
- Adams G. P. and Russeva M. G., Expert Opin. Biol. Ther. 4, 217 (2004). [DOI] [PubMed] [Google Scholar]
- Robinson M. K., Weiner L. M., and Adams G. P., Drug Dev. Res. 10.1002/ddr.10345 61, 172 (2004). [DOI] [Google Scholar]
- Shih W. Y., Luo H., Li H., Martorano C., and Shih W. H., Appl. Phys. Lett. 10.1063/1.2408633 89, 242913 (2006). [DOI] [Google Scholar]
- Zhu Q., Shih W. Y., and Shih W.-H., Appl. Phys. Lett. 10.1063/1.2827201 92, 033503 (2008). [DOI] [PMC free article] [PubMed] [Google Scholar]
- Horak E., Heitner T., Robinson M. K., Simmons H. H., Garrison G., Russeva M., Furmanova P., Lou J., Zhou E., Weiner L. M., Adams G. P., and Marks J. M., Cancer Biotherapy & Radiopharmaceuticals, 20, 603 (2005). [DOI] [PubMed] [Google Scholar]
- Yuan Q.-A., Simmons H. H., Robinson M. K., Russeva M., Marasco W. A., and Adams G. P., Molecular Cancer Therapeutics 5, 2096 (2006). [DOI] [PubMed] [Google Scholar]
- Yuan Q. A., Robinson M. K., Simmons H. H., Russeva M., and Adams G. P., Cancer Immunol. Immunother 57, 367 (2008). [DOI] [PMC free article] [PubMed] [Google Scholar]
- Grogan C., Raiteri R., O’Connor G. M., Glynn T. J., Cunningham V., Kane M., Charlton M., and Leech D., Biosens. Bioelectron. 10.1016/S0956-5663(01)00276-7 17, 201 (2002). [DOI] [PubMed] [Google Scholar]


