Abstract
We developed an intra-arterial positron-probe (β+-probe) system to measure the arterial time-activity concentration in humans for quantitative compartmental modeling of positron emission tomography studies. Performance was characterized in vitro, by using a uniform phantom to calculate dead time, linearity, and absolute detector sensitivity. In vitro evaluations in a uniform phantom showed a system dead time of 2.5 μs, linear regression between measured and true count rates with R2=0.999, and detector sensitivity of 6.9–7.0 counts∕s kBq−1 ml. These met or exceeded values of previously reported systems.
INTRODUCTION
Positron emission tomography (PET) has been widely used in humans for these physiological parameters for more than two decades using freely diffusible radiotracers under physiological conditions such as 15O-labeled tracer (T1∕2=122.24 s).1 An important advantage of PET relative to other functional imaging methods, such as functional magnetic resonance imaging, is its potential for quantification in physiological units. Converting PET data from images of radiotracer concentration—often termed “raw count images”—into images of absolute physiological variables, such as ml gm−1 min−1 of blood flow is done by using compartmental modeling.2, 3, 4, 5 Compartmental modeling typically requires concurrent measurement of the concentration of the administrated radiotracer in the arterial blood throughout the period of tracer uptake (arterial time-activity concentration or ATAC).
15O-labeled water (H215O) is usually administrated as an intravenous bolus injection for a PET cerebral blood flow study. The ATAC is most commonly obtained by drawing blood from an indwelling arterial catheter. If blood samples are drawn manually, they are taken at short intervals (e.g., every 1–2 s) and subsequently weighed (to determine the blood volume obtained per syringe), counted in a well counter and decay corrected.4, 5, 6, 7, 8, 9 Alternately, blood can be sampled continuously by pumping it from the artery into a receptacle through tubing which passes through a coincidence system which detects pairs of 511 keV positron-annihilation photons.10, 11, 12, 13 The transit of blood through tubing before counting artifactually delays and disperses the ATAC, effects which need to be modeled and removed prior to use.14, 15 In humans, arterial sampling by either method is inconvenient and error prone, but does not pose a significant health risk.
When the heart or a large artery (e.g., the aorta) lie in the PET field of view, the ATAC can be obtained directly from the PET image by centering a volume of interest over an intra-arterial or intracardiac volume within the image.16, 17, 18, 19 However, image-based ATAC sampling requires a large, arterial tissue compartment lying within the field of view. When arteries smaller than the aorta are used, partial volume effects compromise accuracy. For this reason, this method has not gained wide acceptance for studies which cannot include the aorta and the brain. Therefore, an alternative method for obtaining the ATAC is needed for the brain and other organs which lie too far from a large artery to allow concurrent image-based determination.
We developed a positron-probe (β+-probe) system to measure the ATAC from the radial artery by using a plastic β+-sensitive scintillating fiber suitable for human use with PET. System performance was evaluated in vitro, by using a uniform phantom to calculate dead time, linearity, and absolute detector sensitivity. Also, degradation of the β+ probe was tested before and after sterilization for clinical human study.
MATERIALS AND METHODS
Positron-probe system
The positron-probe system was primarily designed for measurement of the ATAC in humans. It is a modification of the positron probe of Pain et al.20 The system has two probes: one placed intra-arterially and one placed outside the body, which monitors the 511 keV background. The background probe was completely covered by a light-tight black sheath. Each probe is constructed from a plastic scintillating fiber (BCF-12, Saint-Gobain Crystals, Newbury, OH); a photosensor module (H7826P, Hamamatsu Photonics, Japan); a preamplifier (C7319, Hamamatsu Photonics, Japan); and single channel analyzer (2015A, Canberra, USA), as shown in Fig. 1. Probe output is recorded by using a PC-based data acquisition card (PCI 6259, National Instruments, Austin, TX) which is controlled by LabVIEW software (Version 8.0, National Instruments, Austin, TX). The BCF-12 fiber has a diameter of 0.5 mm; an emission peak at 435 nm; a decay time of 3.2 ns; a 1∕e attenuation length of 2.7 m; and, emits ∼8000 photons∕MeV. The Hamamatsu H7826P consists of a 19 mm diameter head-on photomultiplier tube (PMT) coupled to a high-voltage power supply circuit. This photosensor module was specially designed for photon counting with a wavelength from 300 to 650 nm and was thus selected for its high sensitivity, low dark current, easy portable use, and large light input diameter. The maximum sensitivity of the H7826P is at a wavelength of ∼420 nm, which is well matched for detecting the wavelengths emitted from the BCF-12 scintillating fiber. The PMT output is directly connected to the preamplifier input of the C7319. The preamplifier output is connected to the input of 2015A single channel analyzer which performs pulse shape, control of overall gain, upper level discrimination (ULD), and lower level discrimination (LLD). The operator optimizes the 2015A settings and produces transistor-transistor logic (TTL) pulses when signals fall between the LLD and ULD settings. The TTL pulses are counted and recorded by a data acquisition board system controlled by a LabVIEW program.
Figure 1.
A schematic diagram of the positron-probe system is shown. The system requires two probes: one placed intra-arterially and one placed outside the body, to measure 511 keV background. The background probe was completely covered by light-tight black sheath. Each PSF (plastic scintillating fiber) (1) is enclosed by a light-tight sheath of shrink-wrap plastic tubing attached by luer-lock hub. Probe fibers are coupled directly to a photosensor module (2, PSM), and then to a preamplifier (3), and single channel analyzer (4, SCA). Probe counts are acquired via a data acquisition board and stored in a computer (5).
Design of the β+ probe
Probes were fabricated using a nontoxic, chemically inert Teflon (PTFE) tubing and flexible polyolefin heat-shrink tubing. Teflon tubing having an excellent resistance of high temperature was used to maintain characteristics of BCF-12 fiber while probes were coated a sheath of heat-shrink tubing, leaving an 80 mm detection zone exposed. The light-tight sleeve reduces background noise from ambient light. The schematic diagram of human β+ probe was shown in Fig. 2.
Figure 2.
Schematic diagram of β+-probe design. The probe was coated by a layer guiding Teflon tubing and three-layer light-tight sheaths by using heat shrink tubing. PSF stands for plastic scintillating fiber (BCF-12). 584 μm 905 series SMA connector (Amphenol) is used.
For human studies, the luer-lock hub securely attaches the probe to the arterial catheter and thus prevents blood loss. Cyanoacrylate adhesives (Loctite 4306 and Loctite 7701) are used to attach and fix the luer-lock hub to heat-shrink tubing. These glues are qualified by ISO-10993, which includes a series of standards for evaluating the biocompatibility of an implant prior to a clinical study. After the radial artery catheter is connected to the probe, only the 30 mm detection zone of the probe was exposed inside the radial artery.
Sterilization of the β+ probe
Prior to fabrication of the probe, Teflon tubing, heat-shrinking tubing, and SMA connector were cleaned manually by using cold and warm water and then sterilized by using ethylene oxide (EtO) gas sterilization (Steri-Vac Gas Sterilizer, model 400C, 3M, MN, USA). The 400C sterilizer is well equipped with an effective humidification system, which kills more effectively desiccated micro-organisms. The probes were fabricated wearing sterilized gloves and handling techniques. After fabrication, each probe was again cleaned using 70% isopropyl alcohol, put it into a proper sterilizing bag, and then sterilized. A detection zone of the probe was covered by plastic cover to prevent damage or bending. Each probe, which would not be reused in human study, was again sterilized using EtO gas sterilization. The BCF-12 fiber of the β+ probe consists of a polystyrene-based core and a polymethylmethacrylate (C5H8O2), cladding, which can be damaged at warm cycle (∼55 °C) since the cycle temperature is slightly above operating temperature (20–50 °C) of the fiber. Consequently, we use EtO gas sterilization using cold cycle (∼37 °C), which takes for approximately 5.5 h to be completely sterilized.
Radial phantom design
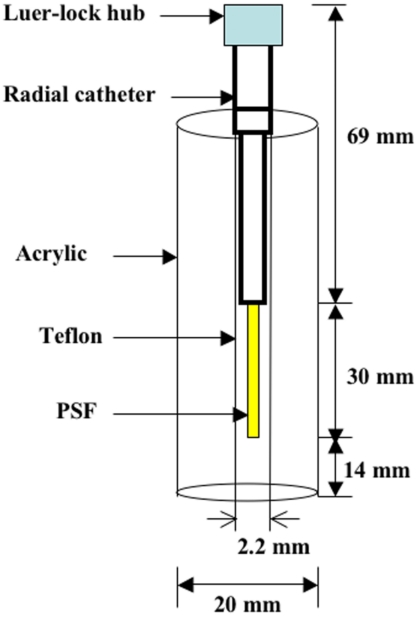
Phantom experiments were used to determine system dead time, system linearity, degradation of the probe due to sterilization, and detector sensitivity of the probe. The radial phantom was designed by using 3 mm wall-thickness clear acrylic [inner diameter (ID) 14 mm], arterial catheter, and Teflon tubing. The tubing diameter was chosen to mimic inner diameter of radial artery in human. Since the mean ID of radial artery,21 measured by high-resolution ultrasonography, was 2.3 mm, a 2.2 mm diameter tubing (ID×OD:2.2 mm×3.2 mm) was used for phantom design, as shown in Fig. 3. The phantom space between inner acrylic and outer Teflon tubing was filled into saline solution. The phantom experiments were securely performed inside a complete shielding area by using lead blocks.
Figure 3.
Schematic diagram of radial phantom. All phantom studies were performed under connecting luer-lock hub into radial catheter. 10 cm long PE 50 tubing was connected to the bottom of Teflon tubing in order to inject H215O radiotracer for phantom study. The phantom space between inner acrylic and outer Teflon tubing was filled into saline solution.
Energy spectrum
Prior to performing phantom studies, it was necessary to determine the optimal LLD setting. Optimizing LLD increased the accuracy of the system by eliminating (1) the thermal noise of the PSM and (2) β+ particles with low kinetic energy, as these are more likely to have been emitted by extra-arterial tissues. The energy spectrum of the 15O positrons was obtained with a multichannel analyzer (MCA) (Multiport II, Canberra, USA) after calibration by using 18F. The kinetic energy of 15O β+ particles corresponding to LLD voltage was calculated by using the energy spectrum and the Fermi–Kurie plot22, 23, 24 as the line intersecting the energy axis at the maximum energy of the plot. An 15O activity concentration of 60 kBq∕ml was used.
Dead time
The dead time of a counting system is defined as the minimum time elapsing between the arrival of the two consecutive particles at the detector which can be properly recorded as two separate pulses. For the β+ probe, dead time has two components: (1) the formation time of the pulse in the detector itself and (2) the processing time of the detector pulse signal through the preamplifier, and single channel analyzer to the PC-based data acquisition card. Dead time measurements were obtained for two β+ probes (intra-arterial and external) by immersing them in a homogeneous solution of H215O (∼18.5 MBq∕ml) and by observing count rates during decay from ∼92 000 to ∼25 counts∕s. These count rates were background corrected by using background levels averaged over 2 min. Concurrent counts from the two probes were assumed to be measuring the same activity concentration. The dead time of the β+-probe system was calculated by using a least-squares fitting method between observed count rate and real count rate through a nonparalyzable model, which assumes that there is a fixed dead time following each true count.25, 26 A nonparalyzable model for the β+-probe system can be mathematically expressed as
| (1) |
where r is the real count rate of β+-probe system, m is the observed count rate of β+-probe system, and τ is the dead time of β+ -probe system. The real count rate of each probe was obtained by finding the optimal region (time versus count rate) which would give less than 0.7% half-life error of the 15O half-life from the observed count rate of each probe and calculating count rate from t=0 until t=25 min through the decay formula
| (2) |
where Nt is the count rate at time t, N0 is the count rate at t=0, and Tp (=122.24 s) is the physical half-life of 15O.
Linearity
To assess the detector linearity of the β+-probe system, we measured the decay of 15O by counting the decrease in a higher activity concentration of H215O (∼21.5 MBq∕ml) in the phantom. Decay count rate was measured for 25 min. During this period, the observed count rate decreased from ∼101 000 to ∼40 counts∕s To calculate linearity, these data were corrected for decay and dead time. R-square values of two β+ probes were calculated by using a linear least-squares model.
Phantom evaluation of sterilization procedures
Before applying the probe for clinical study, it is very important to examine whether the probe has degradation due to EtO gas sterilization. To test whether EtO sterilization degraded the response of the β+ probe, we quantified sensitivity before and after sterilization by observing decay count rate from ∼79 000 to ∼40 counts∕s in a homogeneous H215O solution (∼15.0 MBq∕ml).
Absolute detector sensitivity
Absolute detector sensitivity was measured by using a phantom filled with a homogeneous calibrated concentration of H215O. A model decay count rate curve of H215O was fitted to the measured count data by using a linear least-squares method following dead time correction. The activity used for calibration ranged from 1550 to 2.7 kBq∕ml. The count rate in the detector of the β+-probe system was measured over the range of ∼11 000 to ∼15 counts∕s.
RESULTS
Energy spectrum
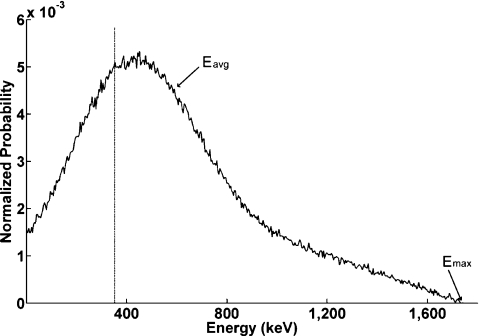
The energy spectrum was obtained by using MCA with a live time of 200 s and real time of 200.3 s with H215O activity concentration of 60 kBq∕ml (Fig. 4). The maximum energy of H215O calculated by Fermi–Kurie plot was 1737 keV with a small 0.2% error compared to the published β+ maximum energy of 15O (1733 keV).27 Based on this calibration where 1737 keV corresponded to 10 V pulse height, the β-emitter particle kinetic energy corresponding to our LLD was 347 keV. So, for all subsequent studies, energy less than 347 keV were rejected. The mean kinetic energy calculated by using the energy spectrum was 579 keV.
Figure 4.
Energy spectrum of 15O water obtained from MCA. The dash line represents LLD setting. Eavg is mean kinetic energy estimated using the energy spectrum. Emax is the maximum energy of 15O water calculated by Fermi–Kurie plot.
Dead time
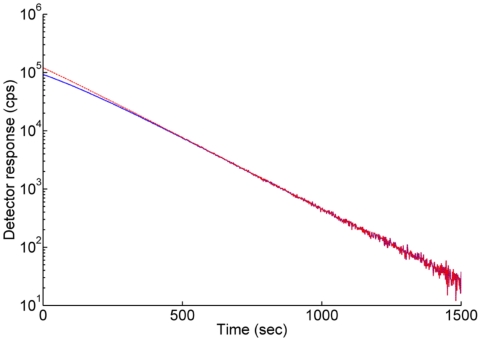
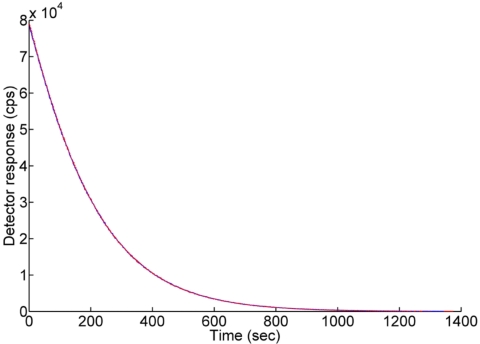
An optimal region with less than 0.7% half-life error for intra-arterial and external probes was 660–800 s, respectively (Fig. 5). In this region, the observed count rate approximates to the real count rate. The real count rates of each probe were calculated by using Eq. 2 and compared to observed count rates.
Figure 5.
Decay curves of intra-arterial β+ probe for dead time measurement. The unit of vertical axis is logarithmic having a base of 10. The solid line represents raw count corrected by background of each probe. The dash line is dead time corrected count of the probe.
The dead time of the β+-probe system was calculated by using Eq. 1 with observed and real count rates using least-squares fitting for the range between 92 000 and 5600 counts∕s (t=0 s−t=550 s). The dead time was approximately 2.5 μs which is similar to the SIC probe system of Pain et al.28 This dead time is adequate for biological kinetic measurement with concentrations up to 21 MBq∕ml. The decay curves of the β+ probe with and without dead time correction are shown in Fig. 5. Half-life values using both the intra-arterial and extra-arterial β+ probes were calculated with MATLAB by using least-squares fitting method under dead time correction. Half-life values for 15O water with both probes were 121.6 s. These values are very close to its reported value (122.24 s).
Linearity
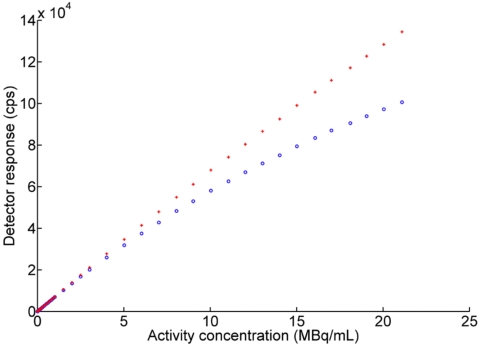
The detector response of the β+-probe system is obviously influenced by dead time in the high count rates, but was not significant at low count rates, as shown in Fig. 5. To assess detector response, detector linearity of the β+-probe system was checked with and without dead time correction through the relation between count rates and activity concentration. Before dead time correction, the system showed a non linear response above 25 000 counts∕s, which corresponded to an activity concentration of ∼4 MBq∕ml (Fig. 6). After dead time correction, the system response was linear (R2=0.999) throughout the tested range for both intra-arterial and external probes. The detector curve of the intra-arterial β+ probe was nonlinear without dead time correction, as shown in Fig. 6. These data were sufficient to measure correct count rates in low activity as well as high activity. The corrected response followed a straight-line trend from low to high activity concentration (Fig. 6). The linearity of the β+-probe system was similar to that of beta probe of Seki et al.29 using 15O water tracer with 100 kcounts∕s at 100 MBq∕ml under the geometric size between our β+ probe and their β+ probe were same.
Figure 6.
Detector response of intra-arterial β+ probe with (red cross) and without (blue circle) dead time correction.
Sterilization of the probe and absolute detector sensitivity
Sterilization is a very critical issue for an intra-arterial β+ probe relative to external β+ probe. According to observed counts, there was no degradation of β+ probes before and after sterilization using EtO gas sterilization at cold cycle, as shown in Fig. 7. This means that all characteristics having the BCF-12 fiber are maintained despite sterilization.
Figure 7.
Probe sensitivity was the same prior to (blue line) and after (red line) EtO sterilization.
The absolute sensitivities of the two probes were 7.0 and 6.9 counts∕s kBq−1 ml. The half-life value obtained for 15O was 121.6 s for both probes, corresponding closely to its reported value (122.24 s).
DISCUSSION
The performance of the β+-probe ATAC system met or exceeded expectations in each aspect tested. The maximum energy of 15O (1737 keV) estimated by Fermi–Kurie plot was in good agreement with the value (1720 keV) reported recently by Champion and Loirec.30 However, average kinetic energy of 15O (579 keV) was about 21% lower than that of Champion and Loirec30 (730 keV). This means that a measured energy spectrum of 15O is quite different from that theoretically calculated by Champion and Loirec.30 Moreover, our value is also about 18% above the average kinetic energy (492 keV) estimated by Monte Carlo simulation of Pain et al.28 using detection radius to detect 90% of positron particles emitted near the probe.
System dead time (2.5 μs) was similar to that reported by Pain et al.28 and by Wollenweber et al.31 Because the system response did not reach a ceiling (the system did not saturate), it can be readily corrected to linear response over the range of radioactivity anticipated (R2=0.999). Based on these data, this system can be used for accurately determining activity concentrations at least as high as 21.0 MBq∕ml.
Detector sensitivities were 7.0 and 6.9 counts∕s kBq−1 ml for the two probes tested at the lower radioactivity concentration than that used by Seki et al.29 These sensitivities were at least twice those of Seki et al.,29 after correcting for active detector length and activity concentration. Absolute detector sensitivity depends on an exposed detector tip length of the probe, diameter of the radial artery phantom, probe position, and positron range of radiotracer. As the length of probe increases, the sensitivity also goes up. The diameter of the artery phantom (2.2 mm) used in this study was determined by average ID of radial arteries reported by Ku et al.21 in humans. We tested detector sensitivity with respect to phantom sizes for IDs of 1.6 and 2.7 mm. We found that the sensitivity of ID 2.7 mm is about 18% higher than ID 1.6 mm using H215O radiotracer. For all studies, the probe was assumed to be aligned with tubing axis. Position is more important for the 18F radiotracer because of its short positron range in water relative to 15O. The maximum positron rage calculated theoretically by Champion and Loirec30 in water for 18F was 2.633 mm and for 15O was 9.132 mm.
While the positron-probe system requires insertion of a radial artery catheter, it still improves safety, simplicity, and accuracy over both manual and automated arterial sampling methods. Safety can be improved by decreasing the gauge of the arterial catheter (patient safety), eliminating blood sampling (patient safety) and blood handling (investigator safety). Simplicity can be improved by eliminating the need for repeated blood sampling, weighing, and counting (manual method) as well as counteroperation and curve modeling for delay∕dispersion correction (automated method). Accuracy can be improved by allowing more frequent sampling (manual method), improving detector-sensitivity corrections, and eliminating tubing-related delay and dispersion (automated method).
Probes constructed from plastic fibers which scintillate well in response to positrons have been used for several years to measure tissue time-activity concentrations in various organs, including arterial blood.20, 28, 32, 33 Positron-probe systems require a pair of detectors: one for counting the tissue site of interest (e.g., arterial blood); and, the other for measuring background noise from various sources, which is subtracted from the tissue curve. A commercially available probe (β-MicroProbe, Biospace, Newark, NJ) is fabricated from two types of plastic fiber: a β+-sensitive scintillating fiber; and, a light-conducting, nonscintillating fiber. This design requires two-optical interfaces: one joining the two fiber types; the other interfacing the nonscintillating fiber to the photomultiplier tube. A two-optical-interface design increases fabrication costs and has the potential disadvantage of collecting less scintillation. The present study characterizes the performance of a positron-probe system, in which each probe is composed of a β+-sensitive scintillating plastic fiber directly coupled to a PMT, with no intervening light-conducting material.
The commercially available positron-probe system has been validated for obtaining ATACs in a rodent model20 using 18F-deoxy-glucose (18FDG). 18FDG although widely used for PET imaging, does not place high demands on performance of a positron-probe system, as follows. 18F is a relatively long-lived positron emitter (T1∕2=110 min). This property allows it to be given at low doses and imaged for long periods (20–30 min). At low count rates, dead time is minimal and system linearity is maximal. Dead time and consequent nonlinearity is a much more significant problem for very-short-lived isotopes, such as 15O-labeled tracers, which must be delivered at much higher doses, to acquire adequate counting statistics in a brief scan period. This problem can easily be resolved by using the β+-probe system described here.
The chief limitation of the present system is the need of darkness both for phantom studies and for in vivo experiment. However, since human PET study is usually performed under dim light, the problem due to ambient light can be resolved by covering the system with a light-tight-black fabric sheet. In vivo performance evaluations using a short-lived, high-dose, first-pass radiotracer (H215O) needs to demonstrate minimal delay and no dispersion by comparison to a PET-image-derived cardiac or aortic time-activity function. Additionally, the use of the β+-probe-derived ATAC to compute brain blood flow should be validated either relative to an alternative method (e.g., intracarotid tracer administration) or relative to values obtained by the image-derived CTAC, or both.19
Another limitation of the intra-arterial β+ probe is that it prevents sampling of arterial blood for assays other than ATAC while it is in the arterial catheter. For example, PET measurements of oxygen metabolic rate using [15O]O2 require determination of the O2 content of arterial blood and the arterial hematocrit.34, 35, Because these are typically stable during the course of a study, they can be determined by drawing arterial blood samples before or after the β+ probe is placed inside the arterial catheter. As another example, some dynamic PET studies use radiopharmaceuticals which are metabolized during the course of the study and this metabolism can cause multiple chemical compounds carrying the same radio label to be concurrently present in the blood pool. In such studies, it may be necessary to obtain blood samples for fractionated analysis. However, in almost all such circumstances, the metabolic process will be sufficiently slow that venous sampling will be suitable and the β+ probe will not need to be removed during the course of the study.
In this study, we developed an intra-arterial β+-probe system with a high sampling rate of 2 or 1 Hz for obtaining arterial time activity concentrations for bolus administrations of high concentrations of short-lived, first-pass tracers, such as H215O. This extends the work of Pain et al.,20 who validated a similar system for a longer-lived, low-dose, equilibrium tracer (18FDG). In view of the excellent performance of the β+-probe system in these two extreme settings, its use for tracers with intermediate values (e.g., 11C, with a half-life of 20 min) should not require further validation. In vitro performance evaluations demonstrated high sensitivity and excellent linearity.
ACKNOWLEDGMENTS
We thank Mr. John Roby for helpful advice on constructing the β+-probe system. We thank Dr. Robert W. Laird for help obtaining energy spectra. We thank Morgan D. Stratton and Amanda M. Sullivan for technical assistance. This work was supported by Grant No. R21 NS050486 (PI: Peter T. Fox) from the NIH∕NINDS.
References
- Beebe-Wang J., Vaska P., Dilmanian F. A., Pegga S. G., and Schlyer D. J., IEEE Nuclear Science Symposium Conference2003. (unpublished), Vol. 4, p. 2496.
- Watabe H., Ikoma Y., Kimura Y., Naganawa M., and Shidahara M., Ann. Nucl. Med. 20, 583 (2006). [DOI] [PubMed] [Google Scholar]
- Ohta S., Meyer E., Fujita H., Reutens D. C., Evans A., and Gjedde A., J. Cereb. Blood Flow Metab. 10.1097/00004647-199609000-00002 16, 765 (1996). [DOI] [PubMed] [Google Scholar]
- Herscovitch P., Markham J., and Raichle M. E., J. Nucl. Med. 24, 782 (1983). [PubMed] [Google Scholar]
- Raichle M. E., Martin W. R. W., Herscovitch P., Mintun M. A., and Markham J., J. Nucl. Med. 24, 790 (1983). [PubMed] [Google Scholar]
- Fox P. T. and Raichle M. E., J. Neurophysiol. 51, 1109 (1984). [DOI] [PubMed] [Google Scholar]
- Fox P. T. and Raichle M. E., Proc. Natl. Acad. Sci. U.S.A. 10.1073/pnas.83.4.1140 83, 1140 (1986). [DOI] [PMC free article] [PubMed] [Google Scholar]
- Shidahara M., Watabe H., Kim K. M., Oka H., Sago M., Hayashi T., Miyake Y., Ishida Y., Hayashida K., Nakamura T., and Iida H., Ann. Nucl. Med. 16, 317 (2002). [DOI] [PubMed] [Google Scholar]
- Hattori N., Bergsneider M., Wu H. M., Glenn T. C., Vespa P. M., Hovda D. A., Phelps M. E., and Huang S. C., J. Nucl. Med. 45, 765 (2004). [PubMed] [Google Scholar]
- Eriksson L., Holte S., Bohm C., Kesselberg M., and Hovander B., IEEE Trans. Nucl. Sci. 10.1109/23.12815 35, 703 (1988). [DOI] [Google Scholar]
- Eriksson L. and Kanno I., Med. Prog. Technol. 17, 249 (1991). [PubMed] [Google Scholar]
- Votaw J. R. and Shulman S. D., J. Nucl. Med. 39, 509 (1998). [PubMed] [Google Scholar]
- Maguire R. P., Spyrou N. M., and Leenders K. L., Physiol. Meas 24, 237 (2003). [DOI] [PubMed] [Google Scholar]
- Iida H., Kanno I., Miura S., Murakami M., Takahashi K., and Uemura K., J. Cereb. Blood Flow Metab. 6, 536 (1986). [DOI] [PubMed] [Google Scholar]
- Meyer E., J. Nucl. Med. 30, 1069 (1989). [PubMed] [Google Scholar]
- Mejia M. A., Itoh M., Watabe H., Fujiwara T., and Nakamura T., J. Nucl. Med. 35, 1870 (1994). [PubMed] [Google Scholar]
- Watabe H., Itoh M., Mejja M., Fujiwara T., Jones A. K., Jones T., and Nakamura T., Ann. Nucl. Med. 9, 191 (1995). [DOI] [PubMed] [Google Scholar]
- Watabe H., Itoh M., Cunningham V., Lammertsma A. A., Bloomfield P., Mejja M., Fujiwara T., Jones A. K., Jones T., and Nakamura T., J. Cereb. Blood Flow Metab. 10.1097/00004647-199603000-00017 16, 311 (1996). [DOI] [PubMed] [Google Scholar]
- Yee S. H., Jerabek P. A., and Fox P. T., Nucl. Med. Commun. 10.1097/00006231-200510000-00009 26, 903 (2005). [DOI] [PubMed] [Google Scholar]
- Pain F., Laniece P., Mastrippolito R., Gervais P., Hantraye P., and Besret L., J. Nucl. Med. 45, 1577 (2004). [PubMed] [Google Scholar]
- Ku Y. M., Kim Y. O., Kim J. I., Choi Y. J., Yoon S. A., Kim Y. S., Song S. W., Yang C. W., Kim Y. S., Chang Y. S., and Bang B. K., Nephrol. Dial Transplant 21, 715 (2006). [DOI] [PubMed] [Google Scholar]
- Kurie F. N. D., Phys. Rev. 10.1103/PhysRev.73.1207 73, 1207 (1948). [DOI] [Google Scholar]
- Feister I., Phys. Rev. 10.1103/PhysRev.78.375 78, 375 (1950). [DOI] [Google Scholar]
- Konopinski E. J. and Uhlenbeck G. E., Phys. Rev. 10.1103/PhysRev.48.7 48, 7 (1935). [DOI] [Google Scholar]
- Knoll G. F., Radiation Detection and Measurement (Wiley, New York, 2000). [Google Scholar]
- Schatzel K., Kalstrom R., Stampa B., and Ahrens J., J. Opt. Soc. Am. B 6, 937 (1989). [Google Scholar]
- Kistner O. C., Schwarzschild A., and Rustad B. M., Phys. Rev. 10.1103/PhysRev.105.1339 105, 1339 (1957). [DOI] [Google Scholar]
- Pain F., Laniece P., Mastrippolito R., Pinot L., Glatigny A., Guillemin M., Hantraye P., Leviel V., Menard L., and Valentin L., IEEE Trans. Nucl. Sci. 10.1109/TNS.2002.1039570 46, 822 (2002). [DOI] [Google Scholar]
- Seki C., Okada H., Mori S., Kakiuchi T., Yoshikawa E., Nishiyama S., Tsukada H., and Yamashita T., Ann. Nucl. Med. 12, 7 (1998). [DOI] [PubMed] [Google Scholar]
- Champion C. and Loirec C. L., Phys. Med. Biol. 10.1088/0031-9155/52/22/004 52, 6605 (2007). [DOI] [PubMed] [Google Scholar]
- Wollenweber S. D., Hichwa R. D., and Ponto L. L. B., IEEE Trans. Nucl. Sci. 10.1109/23.632741 44, 1613 (1997). [DOI] [Google Scholar]
- Zimmer L., Pain F., Mauger G., Plenevaux A., Le Bars D., Mastrippolito R., Pujol J., Renaud B., and Laniece P., Eur. J. Nucl. Med. Mol. Imaging 10.1007/s00259-002-0866-6 29, 1237 (2002). [DOI] [PubMed] [Google Scholar]
- Pain F., Laniece P., Mastrippolito R., Charon Y., Comar D., Leviel V., Pujol J., and Valentin L., IEEE Trans. Nucl. Sci. 10.1109/23.826894 47, 25 (2000). [DOI] [Google Scholar]
- Mintun M. A., Raichle M. E., Martin W. R. W., and Herscovitch P., J. Nucl. Med. 25, 177 (1984). [PubMed] [Google Scholar]
- Ohta S., Meyer E., Thompson C. J., and Gjedde A., J. Cereb. Blood Flow Metab. 12, 179 (1992). [DOI] [PubMed] [Google Scholar]


