Abstract
A multichannel spectrally resolved optical tomography system to image molecular targets in small animals from within a clinical MRI is described. Long source∕detector fibers operate in contact mode and couple light from the tissue surface in the magnet bore to 16 spectrometers, each containing two optical gratings optimized for the near infrared wavelength range. High sensitivity, cooled charge coupled devices connected to each spectrograph provide detection of the spectrally resolved signal, with exposure times that are automated for acquisition at each fiber. The design allows spectral fitting of the remission light, thereby separating the fluorescence signal from the nonspecific background, which improves the accuracy and sensitivity when imaging low fluorophore concentrations. Images of fluorescence yield are recovered using a nonlinear reconstruction approach based on the diffusion approximation of photon propagation in tissue. The tissue morphology derived from the MR images serves as an imaging template to guide the optical reconstruction algorithm. Sensitivity studies show that recovered values of indocyanine green fluorescence yield are linear to concentrations of 1 nM in a 70 mm diameter homogeneous phantom, and detection is feasible to near 10 pM. Phantom data also demonstrate imaging capabilities of imperfect fluorophore uptake in tissue volumes of clinically relevant sizes. A unique rodent MR coil provides optical fiber access for simultaneous optical and MR data acquisition of small animals. A pilot murine study using an orthotopic glioma tumor model demonstrates optical-MRI imaging of an epidermal growth factor receptor targeted fluorescent probe in vivo.
INTRODUCTION
Imaging fluorescent molecular targets to characterize tissue pathology in vivo is an important objective with broad implications for drug development in small animals and clinical diagnosis. Given the availability of targeted molecular imaging agents for animal research, several small animal fluorescence tomography scanners have been developed to provide volumetric images of fluorescence activity.1, 2, 3, 4, 5, 6 Other studies have focused on the systematic development and assessment of diffuse optical fluorescence tomographic (DOFT) imaging techniques in tissue volumes relevant to human imaging, if targeted probes earn clinical approval.7, 8, 9, 10, 11 Most previous work involving human breast imaging has been completed using tissue simulating phantoms, though fluorescence tomography images of human breast using the nontargeted fluorophore indocyanine green (ICG) have very recently been published.7
Pursuing noninvasive optical molecular imaging at depth implies that the interrogating photons are measured only at the tissue surface, making the image inversion problem severely underdetermined and ill posed, even with dense source and detector configurations. The highly scattered photon field limits the resolution of diffuse optical tomographic (DOT) images and quantitative interpretation can be difficult. However, researchers have found that using tomographic data acquired at discrete near infrared (NIR) wavelengths and incorporating the spectral features of dominant tissue chromophores in the imaging algorithm improves imaging performance.12, 13, 14, 15, 16, 17, 18 In general, greater quantitative accuracy is expected as the number of wavelengths increases; however, image resolution is still relatively poor compared to many clinical imaging systems. Additional information may be used to guide image recovery by noting that variation in tissue optical properties can be loosely associated with the tissue’s anatomical structure, providing an opportunity to incorporate anatomical information from highly resolved conventional imaging systems in the recovery of images of optically relevant molecules. In practice, standard magnetic resonance (MR) images have been used to guide diffusion-based image reconstruction of endogenous tissue chromophores19, 20, 21 and recently of fluorescent molecules.8 An imaging system that combines fully resolved spectra of transmitted or emitted light and simultaneously acquired MRI data can provide a particularly rich data set for a variety of imaging applications. A design goal of the system presented here was the development of a multiwavelength capable detection system with a large spectral bandwidth, providing a platform to explore the limits of broadband spectroscopic tomography inside MRI scanners.
This work describes a unique multichannel spectrometer-based detection system for imaging fluorescence yield in small animals and breast-sized domains. The system operates in continuous wave (cw) mode, so fully quantitative imaging of tissues requires the use of frequency domain measurements obtained with a separate detector system. The broadband cw detection system facilitates the use of unique spectral fitting preprocessing techniques to decouple the fluorescence emission from background contamination. The spectroscopic detection system directly couples into a Philips 3T magnet for simultaneous MRI and optical data acquisition. In this configuration, the highly resolved MR images are used as templates for imaging fluorescence yield from emission measurements of an injected fluorophore. A custom designed and manufactured rodent coil produced by Philips Research, Hamburg integrates the fiber optic array into a small-diameter radio frequency (rf) pickup coil for imaging small animals a 3T MRI.
SYSTEM DESIGN
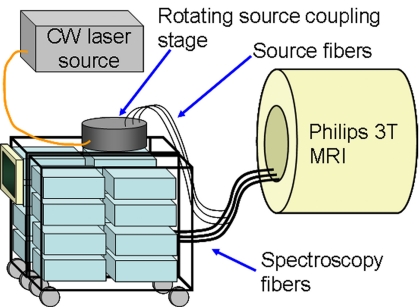
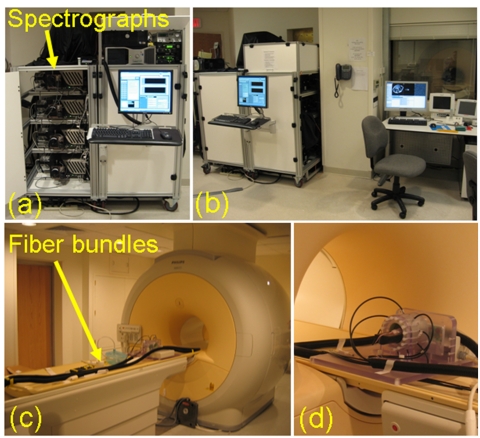
The parallel spectrometer-based tomographic imaging system, depicted in Fig. 1, couples into a Philips 3T MRI magnet and was developed to be flexible enough to acquire transmission and emission spectra in the NIR. Major system components described below include the spectrograph, detection array, fiber optic transmission of light to and from the tissue surface, the acquisition light source, and MRI coils which incorporate the fiber optic patient or rodent interfaces. Photographs of the system are presented in Fig. 2.
Figure 1.
Diagram of the MRI-coupled 16 channel spectroscopy system for fluorescence tomography. Long, bifurcated spectroscopy fibers couple contact mode source-detection directly into the MR bore (3 of 16 fiber bundles are depicted).
Figure 2.
The spectroscopy system (a) is built into two carts which can be wheeled into the MRI control room shown in (b). Four of the insight spectrographs can be seen in the cart on the left in (a). Thirteen meter long fiber bundles extend through ports in the wall directly into the MRI bore (c). The small animal coil is shown in (d) with eight fiber bundles circumscribing a murine subject.
Optical detection system
The optical detection system is composed of 16 Princeton∕Acton Insight:400F Integrated Spectroscopy Systems (Acton, MA) residing in two custom designed wheeled carts (8020, Columbia City, IN). The Insight 400F consists of a 0.3 m F3.9 imaging spectrograph and a low noise, front illuminated charge coupled device (CCD) (Pixis 400F) cooled to −70 °C. The 1340×400 pixel CCD is vertically binned to maximize detector area∕wavelength providing a binned pixel area of 0.16 mm2. Manufacturer specifications indicate a dark current of 0.0025 electrons∕pixel s and quantum efficiencies of 0.45 at 750 nm and 0.20 at 950 nm. Each spectrograph contains a motorized grating turret holding 300 and 1200 l∕mm gratings, which when coupled to the CCD, provide spectral ranges of 60 and 300 nm for a single grating position, respectively. Both gratings are blazed at 750 nm for maximum efficiency in the NIR.
The current system is designed for cw imaging only, as the CCD spectrometer detectors cannot measure rapid signals in the hundreds of megahertz frequency range. Thus, truly quantitative imaging requires acquiring data with both a frequency domain (FD) system and the CCD-based spectroscopy system. This procedure is demonstrated here, and the future hardware integration of the two is outlined in the Discussion.
Light collection and delivery
Sixteen custom designed bifurcated fiber bundles (Zlight, Latvia) channel light to and from the imaging domain. Each fiber bundle is composed of eight 13 m long and 400 μm diameter silica fibers which contact the tissue surface. Seven fibers from each bundle connect to the input system of each of the spectrographs, while the eighth, known as a source fiber, branches off to the source coupling system. Since the detection branch of each fiber bundle is fixed to a given spectrograph, the detected light path experiences no fiber-to-fiber coupling between the tissue surface and spectrometer, minimizing losses and providing fully parallel acquisition. Details of the light paths through the spectrograph system are presented elsewhere.22 The light source is sequentially coupled into one of the 16 source fibers using a precision rotating stage (Velmex, Bloomfield, NY). The detector associated with the active source fiber is deactivated, resulting in 15 full-spectrum measurements acquired in parallel for each of the 16 source positions, though the number of source-detector pairs may be reduced for smaller domains.
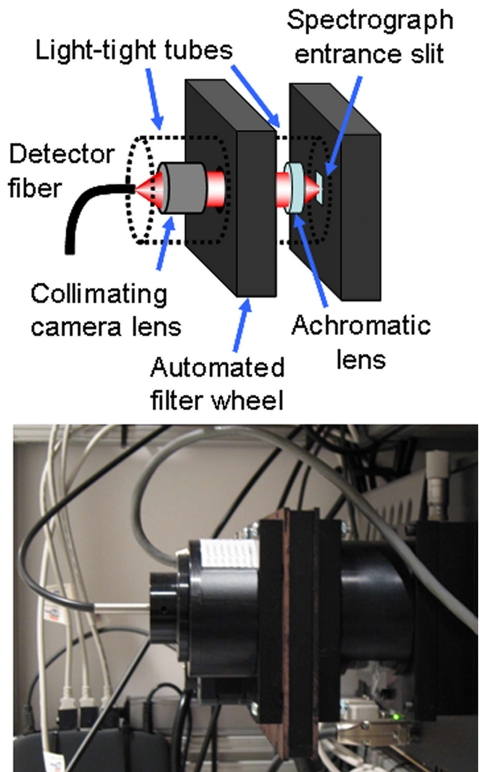
The seven fibers in the detection branch of each fiber bundle are arranged in a line. These bundles couple to the spectrographs via custom designed input optics mounted on each spectrograph, as depicted in Fig. 3. An F1.4, 25 mm focal length digital camera lens (MegaPixel, Edmund Optics, Barrington, NJ) collects and collimates almost the full cone of light emitted from the detector fibers [numerical aperture (NA)=0.37]. The collimated light passes through a fully automated six-position filter wheel containing two long pass interference filters with 650 and 720 nm cut-ons (Omega, Brattleboro, VT) for fluorescence emission acquisition. Additionally, two neutral density (ND) filters with optical densities (ODs) of 1 and 2 reside in each filter wheel to increase the dynamic range of transmission imaging. Filter wheel positions are automatically adjusted during image acquisition depending on the type of acquisition. A 25 mm diameter, 60 mm focal length NIR achromat (Thorlabs, Newton, NJ) focuses the collimated and filtered light onto the input slit. The F# matching of fiber to spectrograph utilizes the high NA of the fibers to minimize the number of fibers in the bundle. The spectrograph entrance slits are fully opened to maximize photon collection, and the magnified image of the fiber array at the slit plane defines an effective slit width of just over 1 mm. Thus, the system operates at resolutions of about 2.2 and 11.2 nm using the 1200 and 300 l∕mm gratings, respectively. The spectral resolution can be increased at the cost of throughput by reducing the input slit width.
Figure 3.
Diagram (top) and photograph (bottom) of the custom designed entrance optics. Lenses collimate the incoming light for filtering with selectable interference or ND filters and focus the light onto the spectrometer.
Usable dynamic range of the 16 bit CCD chip is over 2.8 orders of magnitude assuming a minimum signal of 100 counts above background. Controlling the camera exposure times between 0.01 and 120 s adds an additional 4 orders of magnitude for a total dynamic range approaching 7 orders of magnitude. This range applies to fluorescence emission measurements which are prefiltered using long pass filters in the single-wheel automated filter selector described above. Since transmission mode measurements are not prefiltering with long pass filters, the ND filters may be used selectively to further enhance the detection performance, resulting in a total effective dynamic range of 9 orders of magnitude. Maximum camera exposure times are limited by the desired total acquisition time and may be increased to further extend the dynamic range in cases for which total acquisition time is not limited.
Light sources
The imaging method for a given acquisition determines which light source to incorporate into the imaging sequence. Currently available sources in use include a high power tungsten white light source for broadband transmission measurements and a bank of laser diodes. Since the focus of the work presented here is fluorescence imaging, data for the presented examples were acquired using a 690 nm cw laser diode (Applied Optronics, South Plainfield, NJ) to excite the fluorophore.
Patient∕animal interface
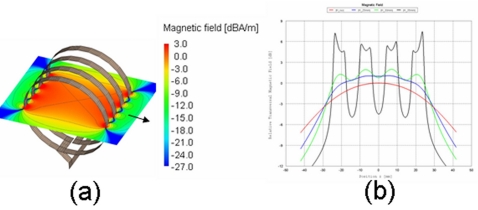
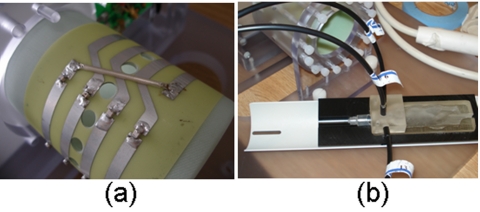
A unique MRI rodent coil designed in collaboration with Philips Research Europe (Hamburg, Germany) features 16 access holes and nylon set screws to accommodate the spectroscopy fibers in a circular array. While small magnet bore animal systems are restricted to birdcage coil configurations, larger bore commercial clinical MR scanners allow the use of solenoid coil designs. The B1-field direction of this coil must be oriented orthogonal to the main B0 field axis. For small animal imaging at 3T, the solenoid coil provides high B1 sensitivity and good field of view coverage. Calculations of electromagnetic field and coil characteristics were performed from simulations using a commercially available EM program (FEKO), which is based on the method of moments (Fig. 4).
Figure 4.
(a) Relative transversal magnetic field of the solenoid coil. The isocenter is set to 0 dB and the arrow shows the B0 direction. (b) Sensitivity profiles along the coil axis (perpendicular to the main field B0) for different distances from the isocenter.
The solenoid coil has an open inner diameter of 70 mm and is built from 8 mm wide strip conductors wound around a fiber glass cylinder. The coil support cylinder is made of glass fiber and is mechanically fixed to a sidewall. The parallel windings are connected as shown in Fig. 5 and the gap between individual strip conductors is 8 mm, providing ample space to accommodate the spectroscopy fibers. Circumscribing the fiber glass coil support cylinder is a removable polycarbonate cylinder containing nylon set screws to affix the spectroscopy fibers.
Figure 5.
(a) Photograph of the coil layout showing connected strip conductors and holes to provide access for optical fibers. The custom designed mouse bed accommodates the spectroscopy fiber bundles and fits into the rodent coil for simultaneous MR and optical acquisition (b).
The overall inductance of the solenoid is Ls=1024 μH at 127 MHz. Sixteen equidistant splits with nonmagnetic capacitors (ATC 100B) are introduced along the conductor to avoid current inhomogeneities (propagation effects). During the transmit phase, the coil is detuned by three independent parallel detuning circuits distributed along the solenoid, which make the coil transparent for the B1 transmit field. Optimized blocking radio frequency chokes prevent rf leakage and provide a high Q factor measured at QL=600 for the unloaded coil. A low noise preamplifier is directly connected to the solenoid, and optimal noise matching is performed via a low loss pi network.
For mouse brain imaging, a custom designed molded mouse bed is used, also shown in Fig. 5. The bed contains fiber optic access holes to provide stable positioning of eight spectroscopy fibers around the mouse head, reducing the optical data set to a maximum of 56 source-detector pairs.
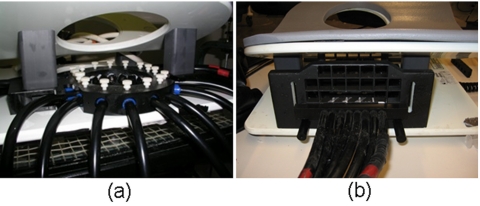
Larger volumes and patient breast imaging capabilities are provided by a fiber optic ring attached to a commercial 3T MRI breast coil (MRI Devices, Waukesha, WI), depicted in Fig. 6. The current design requires manual fiber positioning using set screws, however, spiral ring and parallel plate geometries may be implemented for more reliable positioning.
Figure 6.
The patient interface is a circular array of fibers that couples into a standard MR breast coil (a) although parallel plate geometries are also under consideration (b).
Automated acquisition
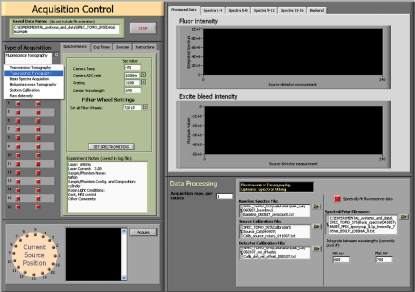
The system is operated using a Dell desktop personal computer running Windows XP Professional. Image acquisition is automated using custom programs written in LABVIEW (National Instruments, Austin, TX) developed with the SIToolkit camera∕spectrometer drivers produced by Rcubed, LLC (Lawrenceville, New Jersey). USB cables connect all camera∕spectrometer∕filter wheel units to the computer, and the motorized source-coupling stage is connected via a serial cable. A screenshot of the primary acquisition control program is provided in Fig. 7. The user interface is designed to minimize technician training. Imaging modes include fluorescence, transmission, raw data only, system calibration, and basis spectra acquisition, and once a mode is selected, only relevant options pertaining to that imaging mode appear on the screen. Exposure times may be manually set by the user or automatically determined using an optimization routine which performs test exposures to calculate ideal exposure times for image acquisition. Additional options include real-time spectrum calibration and spectral fitting and automatic neutral density filtering to preferentially decrease filter OD as a function of source-detector distance for measurements not involving fluorescence emission.
Figure 7.
Front panel of the spectroscopy system’s image acquisition program.
FLUORESCENCE TOMOGRAPHY IMAGE FORMATION
The MRI-guided finite element method (FEM) image reconstruction implementation is described extensively in a previous publication.8 In general, the approach used here is as follows.
-
(1)
Acquire FD data [photomultiplier tube (PMT) detection system] at the excitation wavelength and use these data to reconstruct for optical properties, μax and μsx′.
-
(2)
Acquire FD data (PMT detection system) at the emission wavelength and use these data to reconstruct for optical properties, μam and μsm′.
-
(3)
Acquire cw transmission data by using the fluorescence excitation laser source and the spectrometer detection system.
-
(4)
Acquire cw fluorescence emission data, calibrate these data using the data acquired in part (3), and use the reconstructed optical properties to recover fluorescence yield, a product of the fluorophore’s quantum efficiency η and its absorption coefficient, μaf(r).
Currently, frequency domain data required for parts 1, 2 are collected using a separate DOT imaging system used in clinical exams and described in Ref. 23. PMT-based frequency domain capabilities are being integrated into the spectrometer system carts to provide frequency domain and cw spectroscopic detection in a single system. These modifications are outlined in the Discussion section.
MR images simultaneously acquired with optical data are used to generate the finite element domain for optical tomography image recovery. MR images are segmented using thresholding, region-growing, and manual image manipulation in MATERIALIZE MIMICS software (Ann Arbor, MI). Source∕detector fiber optic positions are registered with reference to MR sensitive fiducials attached to the patient or animal fiber interface. Exported mask files are used to generate FEM meshes compatible with the optical tomography modeling and image reconstruction software described in Ref. 8
Two methods are used to incorporate tissue structural information derived from simultaneously acquired MR images into the optical tomography reconstruction algorithm. One approach structures the inverse regularization matrix based on segmented MR images. This is known as a “soft” priors approach since each node independently updates, allowing the recovery of tumor regions not explicitly segmented from the MR image. Alternatively, the “hard priors” approach homogenizes each segmented region and is therefore unyielding in its application of spatial guidance.24, 25
In the soft priors approach, spatial prior information is incorporated by assuming a “generalized Tikhonov” penalty term that results in a Laplacian-type regularization matrix. To recover images of optical parameters, the difference between measured fluence Φmeas at the tissue surface and calculated data ΦC is minimized. The iterative update equation for the optical properties μ=(μa,κ), where μa is the absorption coefficient, κ is the diffusion coefficient, κ=1∕3(μa+μs′), and μs′ is the reduced scattering coefficient, pertains to steps 1, 2 above and is given by
| (1) |
for the excitation and emission wavelengths x and m. Once these values are know, the fluorescence yield update can be calculated,
| (2) |
where in both update equations, J is the Jacobian matrix describing the sensitivity of boundary data to the parameter of interest, and β is a fixed fraction multiplied by the maximum value on the diagonal of JTJ. Spatial prior information is introduced in the dimensionless “filter” matrix L generated using MR images segmented into appropriate tissue regions based on MRI contrast.
The hard priors approach applies stricter constraints than the regularization-based implementation previously described. Nodal values are locked together by implicitly assuming that segmented regions in the imaging domain are homogeneous. In practice, the Jacobian matrix is calculated on a fully resolved mesh at each iteration, but then collapsed into segmented regions for the inversion process. This drastically reduces the update parameter space from the product of number of nodes and number of unknown properties to the product of number of regions and number of unknown properties. Confidence in the segmentation is critical since regions are offered no spatial latitude. Indeed, the hard priors approach is strictly a characterization-based implementation incapable of detection or uncovering false negatives, and therefore does not present as an image recovery problemper se.
OPTICAL DATA PROCESSING
The following outlines the data processing procedure for all optical data collected on the spectroscopy system (A–C) as well as additional calibration procedures for fluorescence emission measurements (D).
Baseline∕dark current correction
Each CCD displays a baseline offset for zero second acquisitions which must be subtracted from the raw spectrum. Multiple repetitions of the baseline offset spectrum were measured for each spectrometer. The median of the repetitions is used as the baseline offset spectrum to be subtracted, pixel by pixel (assuming vertical binning of the CCD chip), from each acquired spectrum. This is done for each spectrometer.
A similar method was used to correct for the dark current of the CCDs. Dark room acquisitions were recorded for a range of exposure times. Measured counts are proportional to exposure time. The counts per exposure time slope was determined per binned pixel for each spectrometer and is used to subtract dark current from recorded spectra. After baseline and dark current correction, spectra are converted to counts per second.
Detector calibration
A first order correction is applied to account for heterogeneity in throughput and wavelength dependence for all optical components between the tissue and CCD detector (i.e., detection fibers, input optics, spectrometer optics, and CCD response). Detectors were arranged to circumscribe a 6 cm diameter cylindrical Teflon phantom with an SMA connector attached to the radial center of one end. Light from a high power tungsten white light source was focused into a fiber connected to the centrally located SMA connector. Spectra were recorded with all spectrometers (usually ten repetitions), and interdetector calibration factors were calculated for every vertical pixel bin (total of 1340) for each spectrometer. This was done for each grating and grating position to be used during image acquisitions. Calibration factors are stored and used to scale detected signal in a wavelength dependent manner. This helps reduce the influence of inhomogeneities in the CCD array and partially accounts for throughput variability between detector channels.
A similar approach is used to correct for OD filtering. Since the ND filters have a wavelength dependent response, OD values for every filter were experimentally determined using the spectroscopy system. For a given spectrometer, these values were calculated for each CCD pixel (vertically binned) for each grating∕wavelength range selection. In this manner, a calibration file for a given filter setting at a given grating and wavelength setting contains 1340×16 values of optical density, accounting for number of pixels by number of spectrometers.
Source calibration
A first order interfiber source strength calibration was recorded by positioning a detector at the radial center of the Teflon cylinder described above. The detected signal from all 16 source fiber positions was used to determine source scaling factors for future acquisition.
Fluorescence emission spectral fitting and data-model calibration
Fluorescence emission light is initially decoupled from the often much more intense excitation signal using long pass interference filters which provide between 5 and 7 OD filtering efficiency depending on the filter set and the wavelength selectivity of the spectrograph grating. Even with these components in place, light reaching the CCD retains residual signal not associated with fluorescence emission from the fluorophore target, which can be a significant component of the total signal, especially for cases in which the fluorophore has a low quantum yield or is at low concentrations in the tissue. In order to further decouple the true fluorescence signals, previously recorded “basis spectra” of the residual nonfluorophore originating signal and the pure fluorescence signal are fitted to the data. Each spectrograph is used to record its own fluorescence emission basis spectra and residual excitation basis spectra in a controlled manner. All spectra are normalized to the maximum value. Fitting is accomplished by a linear least squares algorithm that minimizes the summation
| (3) |
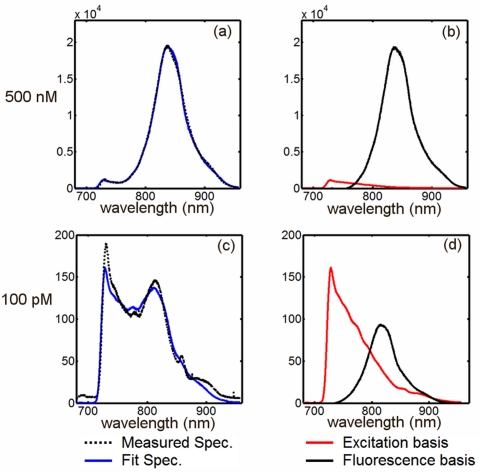
with respect to a and b, where yi is the measured intensity at a given wavelength pixel, F and G are the residual excitation and fluorescence basis spectra, a and b are the coefficients recovered in the minimization procedure, and N is the number of wavelength pixels per spectrum. The algorithm determines the amount of fluorescence emission and excitation cross-talk in the measured spectrum, the sum of which best fits the data in a least squares sense. This procedure is applied to each recorded fluorescence spectrum, a total of 240 spectra for a given acquisition. The spectral fitting procedure is demonstrated for two different ICG concentrations in a homogeneous phantom in Fig. 8. In some cases, the fluorescence peak has been observed to shift to longer wavelengths in large phantom volumes. To account for this, the minimization may incorporate the position of the peak as a free parameter. The resulting fluorescence emission peak is integrated to provide a single fluorescence intensity measurement for a given source-detector pair.
Figure 8.
A spectral fitting routine is used to decouple fluorescence spectra from the measured signal. The spectral fitting algorithm determines the relative contribution of the basis spectra [right column, (b) and (d)] which best fits the measured spectrum. Two examples are presented above, both for a 70 mm diameter homogeneous phantom containing intralipid, ink, and ICG [500 nM for graphs (a) and (b) and 100 pM for graphs (c) and (d)].
Integrated fluorescence emission measurements are calibrated in the following manner:
| (4) |
where the index i indicates a single data point or source-detector pair. is the intensity boundary data calculated from the images of μax and μsx′ recovered using the frequency domain measurements from the PMT clinical system. This calculated, or “model,” boundary data must correspond to the spectrometer fiber positions, which do not necessarily have to be identical to those used in the frequency domain system. The quotient in Eq. 4 essentially provides a scaling factor for the fluorescence measurements which accurately scales the fluorescence data to the FEM model and accounts for inter-detection channel throughput and fiber coupling discrepancies. An initial estimate for the iterative reconstruction algorithm is determined using a homogeneous fitting routine. This procedure uses the bisection method to minimize the data-model misfit, assuming a homogeneous distribution of fluorescence yield.
SYSTEM PERFORMANCE
Repeatability
An 8.6 cm diameter homogeneous phantom composed of silicone, titanium dioxide, and India ink was used to measure the repeatability of transmission mode measurements using the spectroscopy system. Optical properties of the phantom were approximately 0.004 and 1.91 mm−1 for the absorption and reduced scattering coefficients, respectively. Measurements were repeated at each source-detector position using the 690 cw laser source. For a single vertically binned pixel array, the average and maximum standard errors at the laser peak are 1.4% and 1.8%, respectively, if fiber positions were not changed in between measurements. These increase to 18.3% and 19.5% with fiber repositioning, indicating that fiber coupling is the most significant source of error in these measurements. If pixels are binned throughout the laser peak, the average and maximum standard errors change to 0.28% and 0.37% for fibers remaining in contact with the phantom and 14.8% and 16.3% for repositioned fibers.
Determining measurement repeatability in fluorescence mode is less straightforward given the signal dependence on fluorophore concentration, absorption spectrum, and quantum yield. For this study, a 70 mm diameter liquid phantom containing DPBS, 1% intralipid, India ink, and 10 nM ICG was used to determine measurement repeatability. This measure was calculated in two ways, one considered only the raw data for a given binned pixel array and resulted in a mean standard error of 0.7% and maximum standard error of 1.4% for the pixel array at the fluorescence peak. The second measure was determined based on the integrated intensity from the full calibration and spectral fitting routine, resulting in an average standard error of 0.6% and maximum standard error of 1.8%. It is clear that fiber positioning variability would dominate the data error for fluorescence measurements in this case. However, fluorescence measurement data offer a unique opportunity to account for fiber coupling variability. This is accomplished by calibrating the fluorescence measurements to the transmission measurements in the same geometry, as described in Sec. 4D. This provides inherent stability to systematic error, though is not unique to spectrometer-based detection which in and of itself does not necessarily provide a signal to noise ratio (SNR) advantage over more traditional detection schemes used for fluorescence tomography. The benefit of spectrometer based detection is improved separation of the fluorescence signal from background contamination, providing a more accurate ratio, especially for low concentrations of fluorophore.
Sensitivity
A 70 mm diameter liquid phantom containing dulbecco’s phosphate buffered saline (DPBS), 1% intralipid, and India ink was used to investigate the overall sensitivity of the system to ICG fluorescence. ICG dye dissolved in de-ionized (DI) water was added to the solution to obtain solutions ranging from 10 pM to 1 μM ICG. The optical properties of the intralipid∕ink solution μa and μs′ were approximately 0.006 and 1.6 mm−1, respectively. The optical properties at the excitation and emission wavelengths were recovered for each concentration of ICG from data collected using the clinical frequency domain system. Since the domain was known to be homogeneous, these properties were determined in a homogeneous fitting procedure only.
Fluorescence emission and excitation transmission measurements were recorded for each phantom, with a maximum allowed camera integration time of 120 s applied to the fluorescence measurements. The typical data measured across the emission spectrum are shown in Fig. 8a for a strong fluorescence signal and Fig. 8c for a weak signal. The spectral fitting procedure discussed in Sec. 4D above was used to recover the true fluorescence signal and the nonspecific background contributions, as shown in (b) and (d), respectively. Additionally, to quantitatively compare the spectral fitting procedure to more conventional means of fluorescence filtering, the measured, un-fitted spectra were integrated to simulate 720 nm long-pass filtering. In both cases, integrated values representing fluorescence emission intensities were calibrated as per Eq. 4 and used to determine homogeneous values of fluorescence yield.
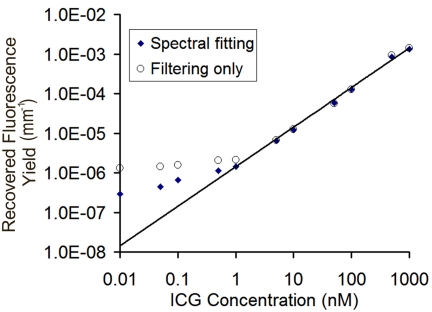
Values of fluorescence yield recovered using the two data preprocessing techniques are plotted as a function of known ICG concentration in Fig. 9. The linear fit shown in the figure was computed using the spectrally fit data with the y-intercept forced to zero and indicates a strong linear correlation of recovered fluorescence yield and ICG concentration (R2=0.99). At concentrations above 1 nM, the fluorescence yield values calculated using data that was filtered only, with no spectral fitting, very closely match the spectrally fit results. Fluorescence signals produced at these fluorophore concentrations dominate the detected signal, a finding consistent with the data shown in Fig. 8. However, fluorescence yield values recovered with spectrally fit data maintain the linear relationship at lower concentrations than those recovered using data without the spectral separation of background contamination. Clearly, the two techniques diverge at 1 nM. At this concentration, the residuals between the recovered value of fluorescence yield and the linear approximation are 0.4% and 48% for the spectrally fit and filtering-only approaches, respectively. As the fluorophore concentration drops below 1 nM, both techniques lose the consistent linear response observed at higher concentrations, though the filtered-only data show even less sensitivity to changes in fluorophore concentration. At 500 pM, the residuals increase to 57% and 192% for the spectrally fit and filtered-only data processing responses, respectively. Below this level, accurate quantification of fluorescence activity is unlikely in this phantom configuration, however, the spectrally fit data still show a stronger response to changes in fluorophore concentration down to 10 pM. The residuals calculated at the lowest concentration measured were almost five times larger without spectral fitting, clearly indicating a more sensitive, if not accurate, response of the spectral preprocessing technique. It should be noted that since fluorophore quantum yield is not explicitly known in this solution, the calculated slope of the linear regression does not provide information on the actual relationship between true and recovered concentrations, however, the linearity itself is a critical measure of system performance.
Figure 9.
Values of fluorescence yield as a function of ICG concentration in a 70 mm liquid phantom recovered using two methods to process the recorded data. One method uses the spectral-fitting technique to decouple background contamination across the fluorescence emission spectrum, while the other simply integrates the measured spectrum, as would be the case for long pass filtering alone. Values were determined using a homogeneous fitting algorithm for the background optical properties as well as the fluorescence yield.
Phantom imaging
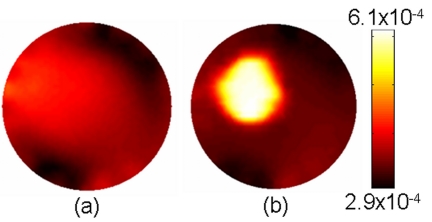
A heterogeneous liquid phantom was used to demonstrate imaging large volumes with imperfect tumor-to-background uptake. The phantom was composed of DPBS, 1% intralipid, and India ink, resulting in background optical properties of μa=0.005 mm−1 and μs′=1.4 mm−1. ICG dissolved in DI water was added to the phantom volume to obtain a 300 nM ICG solution. A thin-walled plastic cylinder was positioned between the edge and center of the phantom to simulate a 2 cm diameter tumor region. The inclusion consisted of the same solution found in the phantom background, although the ICG concentration was elevated to 1 μM, providing a total contrast of just over 3.3:1. Background optical properties were determined by imaging the phantom in a separate frequency domain clinical system and values at 785 nm were used for this experiment. The spectroscopy system was then used to acquire excitation intensity and fluorescence emission measurements. Integrated intensities were calibrated to the model as described earlier, and images were reconstructed using an algorithm without spatial guidance as well as the soft spatial priors implementation. The resulting images are shown in Fig. 10. Tumor-to-background contrast can be deciphered in both images; however, the spatially guided implementation provides a more accurate representation of the imaged domain. Inclusion borders are more clearly defined and the image represents substantially higher tumor-to-background contrast.
Figure 10.
Images of fluorescence yield for a 70 mm diameter liquid phantom containing an ICG heterogeneity. The target-to-background concentration of ICG was 3.3:1. Images reconstructed using spatial soft priors, depicted in (b), are qualitatively more accurate and in terms of recovered contrast than images recovered without the spatial priors implementation (a).
Small animal imaging
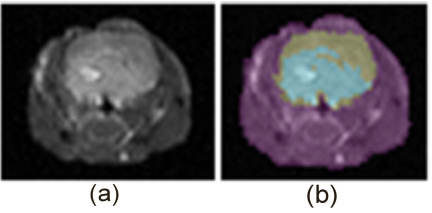
An animal pilot study demonstrates the ability of the system to image an epidermal growth factor receptor (EGFR) targeted fluorescent probe in mouse brain tumors. U-251 human glioma tumors were implanted intracranially in male nude mice 19 days prior to the imaging study. Simultaneous gadolinium enhanced T1 MRI and fluorescence tomography acquisition of the population were completed prior to IRDye® 800CW EGF Optical Probe (LI-COR Biosciences, Lincoln, NE) IV administration (1 nM) and at 24 h intervals after injection over the course of 72 h. Eight fibers were used in this study, and fiber-tissue contact positions were determined in reference to MRI sensitive fiducials on the molded mouse bed. For each imaging session, a single coronal slice was segmented into regions using MATERIALIZE MIMICS software. The example in Fig. 11 shows an MR coronal slice of one mouse 48 h after IRDye® 800CW EGF Optical Probe administration and the resulting MR image. The regionized mask was exported as a bitmap file from which a two dimensional mesh was generated for fluorescence reconstruction.
Figure 11.
A gadolinium enhanced T1-weighted image shows a coronal slice of a tumor bearing mouse head (a). The image is segmented into three regions using MIMICS software (b), the largest region (violet) identifies the tissue outside of the brain, the second largest region (gray) is the brain itself, and the smallest region (light blue) marks the tumor. The segmented image is used to generate an FEM mesh for spatially guided fluorescence reconstruction.
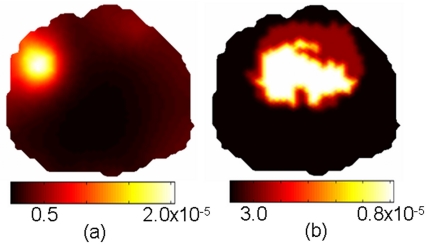
The spectral fitting technique described in Sec. 4D was used to generate integrated intensity values of fluorescence emission from basis spectra of EGF Optical Probe fluorescence. Reconstructed images with and without the use of hard spatial priors are presented in Fig. 12. The conventional diffuse tomography approach makes no use of the internal tissue structure although the outer boundary of the domain was used in this case. Fluorescence yield values recovered using this approach are highly surface weighted, showing an elevated region of fluorescence activity near the surface of the mouse head, well outside the actual location of the tumor. The diffuse, Gaussian shape of the elevated region is typical of fluorescent molecular tomography imaging without spatial guidance.3, 5, 26, 27, 28, 29, 30, 31 The use of hard priors, as implemented here, transforms the imaging problem to one of quantification since the recovery of the tumor region size and location is not the ultimate objective. In this case, the tumor region outline is given by a region-growing threshold of the enhanced MR image, and the fluorescence recovery algorithm estimates the fluorescence uptake in that predefined region. An important test will be how the hard priors implementation handles false positives in healthy regions, and nontumor bearing mice, introduced by incorrect MR segmentation, and these studies are ongoing.
Figure 12.
Reconstructed images of fluorescence yield for a tumor bearing mouse using only the outer boundary for spatial priors (a) and using spatial hard priors (b).
DISCUSSION
An MRI-coupled optical tomography system has been developed to image fluorescence yield in a variety of tissue volumes. A unique rodent coil specifically developed for this system provides high resolution MR images of small animals. Through a variety of spatial prior implementations, these images provide the imaging template upon which the fluorescence activity is reconstructed. The system’s high sensitivity, low noise CCD detectors were shown to be stable and provide repeatable measurements, the most significant error originating from fiber coupling errors. Fluorescence emission intensity may be scaled to the excitation laser transmitted intensity to account for these errors.
Characterizing the system’s sensitivity to fluorophore concentration is complex, given the dependence on concentration, absorption spectra, excitation filtering, and quantum yield. Sensitivity results of a commonly used fluorophore in a reasonably sized phantom were presented and demonstrated a linear response of the fluorescence yield fit to fluorophore concentration down to 1 nM using spectral fitting data preprocessing. Without spectral fitting, recovered values for 1 nM and below are inaccurate, and the sensitivity slope begins to flatten at these concentrations. This reduction in sensitivity is also observed for spectrally fit data, although the decrease in the response slope is less dramatic and does not show up until concentrations of 500 pM. Below this level, there is still a modest response to changing fluorophore concentrations, although the recovered values are clearly inaccurate. This is not caused by a drop in measurement SNR per se, as the measured signal even at 10 pM is strong and stable, but may be due to systematic bias in the spectral fitting routine itself, inaccuracies in the basis spectra, or the presence of a contaminating signal with similar spectral characteristics to ICG.
Preliminary imaging studies demonstrate an ability to image low fluorescence contrast (3.3:1 ratio) in relatively large tissue volumes (70 mm diameter), contingent upon the availability of spatial prior information provided by the MRI. Additionally, it was also shown that quantifying the uptake of a targeted fluorophore in a mouse glioma model is feasible and dramatically benefits from the inclusion of structural information, through the synergy of MR imaging and fluorescence estimation of the regionized image. A larger mouse population study is currently underway to further characterize in vivo imaging performance, and quantify the variation in estimated uptake of fluorophores in tumors.
The work presented here required the use of a separate frequency domain imaging system to obtain background optical properties and calibrate the fluorescence data to the algorithmic model. This is inconvenient at best and limits many of the advantages of the MRI-coupled imaging system. Importantly, the lack of FD imaging capabilities integrated into the imaging system, background optical properties may not be acquired without repositioning the subject. Integrating PMT-based frequency domain detection into the spectroscopy system is underway. The rotating source coupling stage was constructed with 15 PMT detectors in a design identical to that previously reported.23 In this configuration, the source branch of the spectroscopy fibers will serve as both light delivery and pickup channels for the PMT’s.
The unique system introduced here provides rich spectral information in a variety of diffuse optical imaging modes including broadband NIR transmission and fluorescence at present. In fluorescence mode, the spectrograph system offers several advantages over filtered intensity measurements as spectrally resolved detection provides exceptional wavelength selectivity for excitation filtering. The excitation contamination and nonspecific background can be dramatically suppressed to improve the ability to quantify low level fluorescence, as was shown here. The system may also be used in the future to acquire emission data from multiple fluorophores simultaneously, contingent upon the individual fluorescence peaks being resolved well enough for the spectral fitting technique to extract the contribution from each fluorophore.
ACKNOWLEDGMENTS
This work was funded by the National Institutes of Health Grants No. RO1 CA109558, RO1 CA69544, and U54 CA105480, Philips Research Hamburg, as well as Department of Defense Breast Cancer predoctoral fellowship BC051058.
References
- Deliolanis N., Lasser T., Hyde D., Soubret A., Ripoll J., and Ntziachristos V., Opt. Lett. 10.1364/OL.32.000382 32, 382 (2007). [DOI] [PubMed] [Google Scholar]
- Meyer H., Garofalakis A., Zacharakis G., Psycharakis S., Mamalaki C., Kioussis D., Economou E. N., Ntziachristos V., and Ripoll J., Appl. Opt. 10.1364/AO.46.003617 46, 3617 (2007). [DOI] [PubMed] [Google Scholar]
- Patwardhan S. V., Bloch S. R., Achilefu S., and Culver J. P., Opt. Express 10.1364/OPEX.13.002564 13, 2564 (2005). [DOI] [PubMed] [Google Scholar]
- Ripoll J., Schulz R. B., and Ntziachristos V., Phys. Rev. Lett. 10.1103/PhysRevLett.91.103901 91, 103901 (2003). [DOI] [PubMed] [Google Scholar]
- Schulz R. B., Ripoll J., and Ntziachristos V., IEEE Trans. Med. Imaging 10.1109/TMI.2004.825633 23, 492 (2004). [DOI] [PubMed] [Google Scholar]
- Zacharakis G., Ripoll J., Weissleder R., and Ntziachristos V., IEEE Trans. Med. Imaging 10.1109/TMI.2004.843254 24, 878 (2005). [DOI] [PubMed] [Google Scholar]
- Corlu A., Choe R., Durduran T., Rosen M. A., Schweiger M., Arridge S. R., Schnall M. D., and Yodh A. G., Opt. Express 10.1364/OE.15.006696 15, 6696 (2007). [DOI] [PubMed] [Google Scholar]
- Davis S. C., Dehghani H., Wang J., Jiang S., Pogue B. W., and Paulsen K. D., Opt. Express 10.1364/OE.15.004066 15, 4066 (2007). [DOI] [PubMed] [Google Scholar]
- Godavarty A., Eppstein M. J., Zhang C., and Sevick-Muraca E. M., Radiology 10.1148/radiol.2343031725 235, 148 (2005). [DOI] [PubMed] [Google Scholar]
- Godavarty A., Thompson A. B., Roy R., Gurfinkel M., Eppstein M. J., Zhang C., and Sevick-Muraca E. M., J. Biomed. Opt. 10.1117/1.1691027 9, 488 (2004). [DOI] [PubMed] [Google Scholar]
- Godavarty A., Zhang C., Eppstein M. J., and Sevick-Muraca E. M., Med. Phys. 10.1118/1.1639321 31, 183 (2004). [DOI] [PubMed] [Google Scholar]
- Choe R., Corlu A., Lee K., Durduran T., Konecky S. D., Grosicka-Koptyra M., Arridge S. R., Czerniecki B. J., Faker D. L., Chance B., Rosen M. A., and Yodh A., Med. Phys. 10.1118/1.1869612 32, 1128 (2005). [DOI] [PubMed] [Google Scholar]
- Corlu A., Choe R., Durduran T., Lee K., Schweiger M., Arridge S. R., Hillman E. M., and Yodh A., Appl. Opt. 10.1364/AO.44.002082 44, 2082 (2005). [DOI] [PubMed] [Google Scholar]
- Corlu A., Durduran T., Choe R., Schweiger M., Hillman E. M., Arridge S. R., and Yodh A. G., Opt. Lett. 10.1364/OL.28.002339 28, 2339 (2003). [DOI] [PubMed] [Google Scholar]
- Li A., Zhang Q., Culver J., Miller E., and Boas D., Opt. Lett. 10.1364/OL.29.000256 29, 256 (2004). [DOI] [PubMed] [Google Scholar]
- Srinivasan S., Pogue B. W., Brooksby B., Jiang S., Dehghani H., Kogel C., Wells W. A., Poplack S. P., and Paulsen K. D., Technol. Cancer Res. Treat. 4, 513 (2005). [DOI] [PubMed] [Google Scholar]
- Srinivasan S., Pogue B. W., Jiang S., Dehghani H., Kogel C., Soho S., Gibson J. J., Tosteson T. D., Poplack S. P., and Paulsen K. D., Acad. Radiol. 13, 195 (2006). [DOI] [PubMed] [Google Scholar]
- Srinivasan S., Pogue B. W., Jiang S., Dehghani H., and Paulsen K. D., Appl. Opt. 10.1364/AO.44.001858 44, 1858 (2005). [DOI] [PubMed] [Google Scholar]
- Brooksby B., Jiang S., Kogel C., Doyley M., Dehghani H., Weaver J. B., Poplack S. P., Pogue B. W., and Paulsen K. D., Rev. Sci. Instrum. 10.1063/1.1819634 75, 5262 (2004). [DOI] [Google Scholar]
- Guven M., Yazici B., Intes X., and Chance B., Phys. Med. Biol. 10.1088/0031-9155/50/12/008 50, 2837 (2005). [DOI] [PubMed] [Google Scholar]
- Intes X., Maloux C., Guven M., Yazici B., and Chance B., Phys. Med. Biol. 10.1088/0031-9155/49/12/N01 49, N155 (2004). [DOI] [PubMed] [Google Scholar]
- Pogue B. W., Li Z., Carpenter C., Laughney A., Krishnaswamy V., Davis S. C., Jiang S., and Paulsen K. D., International Society for Optical Engineering (SPIE) BiOS at Photonics West, San Jose, California, 2008. (unpublished).
- McBride T. O., Pogue B. W., Jiang S., Osterberg U. L., and Paulsen K. D., Rev. Sci. Instrum. 10.1063/1.1344180 72, 1817 (2001). [DOI] [Google Scholar]
- Dehghani H., Pogue B. W., Jiang S., Brooksby B., and Paulsen K. D., Appl. Opt. 10.1364/AO.42.003117 42, 3117 (2003). [DOI] [PubMed] [Google Scholar]
- Schweiger M. and Arridge S. R., Phys. Med. Biol. 10.1088/0031-9155/44/11/302 44, 2703 (1999). [DOI] [PubMed] [Google Scholar]
- Ntziachristos V., Tung C. H., Bremer C., and Weissleder R., Nat. Med. 8, 757 (2002). [DOI] [PubMed] [Google Scholar]
- Graves E., Ripoll J., Weissleder R., and Ntziachristos V., Med. Phys. 10.1118/1.1568977 30, 901 (2003). [DOI] [PubMed] [Google Scholar]
- Ntziachristos V., Schellenberger E. A., Ripoll J., Yessayan D., Graves E., A.Bogdanov, Jr., Josephson L., and Weissleder R., Proc. Natl. Acad. Sci. U.S.A. 10.1073/pnas.0401137101 101, 12294 (2004). [DOI] [PMC free article] [PubMed] [Google Scholar]
- Graves E. E., Weissleder R., and Ntziachristos V., Current Molecular Medicine 4, 419 (2004). [DOI] [PubMed] [Google Scholar]
- Zacharakis G., Ripoll J., Weissleder R., and Ntziachristos V., IEEE Trans. Med. Imaging 10.1109/TMI.2004.843254 24, 878 (2005). [DOI] [PubMed] [Google Scholar]
- Graves E. E., Yessayan D., Turner G., Weissleder R., and Ntziachristos V., J. Biomed. Opt. 10, 0440191 (2005). [DOI] [PubMed] [Google Scholar]


