Abstract
A prototype small animal imaging system was created for coupling fluorescence tomography (FT) with x-ray microcomputed tomography (microCT). The FT system has the potential to provide synergistic information content resultant from using microCT images as prior spatial information and then allows overlay of the FT image onto the original microCT image. The FT system was designed to use single photon counting to provide maximal sensitivity measurements in a noncontact geometry. Five parallel detector locations are used, each allowing simultaneous sampling of the fluorescence and transmitted excitation signals through the tissue. The calibration and linearity range performance of the system are outlined in a series of basic performance tests and phantom studies. The ability to image protoporphyrin IX in mouse phantoms was assessed and the system is ready for in vivo use to study biological production of this endogenous marker of tumors. This multimodality imaging system will have a wide range of applications in preclinical cancer research ranging from studies of the tumor microenvironment and treatment efficacy for emerging cancer therapeutics.
INTRODUCTION
In the past decade, considerable development has gone into assessing the clinical potential for near infrared red (NIR) diffuse optical tomography as a noninvasive modality for functional and metabolic imaging of human tissue.1, 2, 3, 4 Similarly, imaging fluorescence (Fl) in vivo has been investigated to monitor drug uptake, enhance contrast in diseased tissue,5, 6, 7 and resolve molecular activity.8, 9 Though encouraging, many of these studies utilize planar imaging techniques to produce superficial surface-weighted maps of the underlying fluorophore distribution. Most planar systems are inherently incapable of imaging deeper than a centimeter into the tissue, due to the diffusive nature of NIR light propagation in the tissue which makes the remitted signal inherently surface weighted.10 Tomography-based systems, in comparison, are able to provide deeper three-dimensional (3D) volumetric maps of the Fl distribution and provide a modest amount of spatial resolution, with improved sensitivity to quantify lower contrasts.11, 12 In this study a new Fl tomography (FT) system that couples with microCT x-ray imaging is presented and its functionality is demonstrated.
Recently a few small animal Fl optical imagers have been designed for tomography, with first generation devices submerging the animal in a chamber containing a matching fluid.13, 14, 15, 16, 17 The most recent systems have utilized direct fiber coupling to the animal18 or fully noncontact excitation and collection of the diffuse Fl and transmission (Tr) diffusion using a charge coupled device (CCD).19 Though these systems have demonstrated the ability to reconstruct volumetric images of the spatial distribution of Fl, they share a similar characteristic that can degrade imaging performance. Specifically, the Fl and Tr measurements in these systems are acquired sequentially and often as much as 30 min apart. This has the potential to lead to Fl-to-Tr ratio inconsistency, ultimately resulting in image artifacts or suboptimal quantification and∕or target localization. These errors are a direct result of animal motion, variations in localized Fl as a result of drug uptake characteristics, photobleaching, or source strength variations between data sets. In this work, the customized instrumentation was designed to allow fully noncontact parallel detection of the Fl and Tr measurements to resolve these data acquisition issues.
Studies of a priori approaches to diffuse tomography have been ongoing for sometime,12, 20, 21 with promising results shown for imaging of breast cancers22, 23, 24 and small animals.25 Yet diffuse imaging is plagued by low resolution recovery of the interior because the reconstruction problem is an ill-posed inversion problem. To combat this, diffuse tomography data can be used to perform region-based spectroscopy, rather than stand alone imaging tool. If prior information about the location and structure of a lesion can be provided by an anatomical imaging modality, such as microCT, MRI, or ultrasound, it is known that the Fl could be quantified more reliably. The incorporation of a priori structures in small animal imaging has only recently been demonstrated with MRI information,18 with no truly hybrid microCT∕FT work published to date, though some studies have demonstrated CT-Fl fusion images for coregistration in studies involving lung26 and brain cancer.9 Many challenges exist in creating a truly useful hybrid microCT∕Fl imaging system, as a result of complications arising due to shielding a combined system, or accurately positioning of the animal and virtually placing the sources and detectors for accurate sequential imaging.
A strong rationale for such a system is that microCT offers poor soft tissue contrast, limiting its in vivo tumor imaging abilities to a few anatomical sites, primarily the lungs and liver.27, 28, 29 Contrast agents have been shown to improve results but very low x-ray tube voltages are still necessary to achieve adequate contrast,30 often resulting in an unrealistically long acquisition times. As such, the incorporation of functional imaging capabilities from FT has the potential to enhance the information content in microCT images by providing increased sensitivity to detecting cancerous tissues. In a complementary fashion, the anatomical information from the microCT can be utilized in the FT reconstruction to improve the quantitative accuracy in recovering volumetric images of exogenous optical contrast. Ultimately, a multimodality imaging system combining microCT and FT would have a wide range of applications in preclinical cancer research ranging from studies of the tumor microenvironment and treatment efficacy for emerging cancer therapeutics.
This paper describes the design and implementation of a new system designed to be used in small animal imaging studies. The system construction and testing are described in detail and phantom data is presented to highlight the system.
SYSTEM DESIGN
Overview
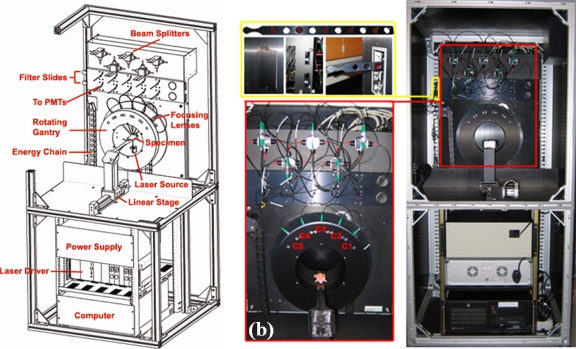
The FT system is illustrated in Fig. 1a and shown pictorially in Fig. 1b. The system was designed to utilize a rotating gantry, allowing use of a single source with a fan-beam configuration of detectors that rotate around the surface of the specimen. To achieve this without damaging the fibers, the source and detection fibers are housed in an energy chain design that controls the wrapping of the fibers around the bore of the gantry as it turns. In this configuration, fully noncontact excitation and detection is achieved and a flexible number of measurements can be obtained. Five optical channels, C1–C5 use focalized detection to collect the diffuse Tr of excitation and Fl signals at the surface of the specimen. A modified GE eXplore Locus microcomputed tomography (microCT) animal bed is fully compatible between the two systems, allowing fully noncontact measurements to be acquired for FT and animals to quickly be moved between systems. In both systems, the bed connects to a linear stage which translates the animal into a user selected region of interest. Removable filter slides, shown in the top left of Fig. 1b are motorized and allow users to easily install new filter sets for imaging different fluorophores. Slides containing ten filters or two sets each, are used in both Fl and Tr channels. LABVIEW based control allows users to easily select between filter positions and the default position is set to block the incident light thereby protecting the photomultiplier tubes from damage.
Figure 1.
A schematic of the FT system shown in (a) and the constructed system is illustrated in (b). Removable filter slides allow users to easily install different filter sets as necessary for imaging a range of fluorophores, as depicted in the top left of (b). The bottom left part of (b) illustrates the modified mouse bed, holding a mouse phantom, along with a close-up view of the rotating gantry housing the five fiber coupled optical focusers, C1–C5.
Instrumentation
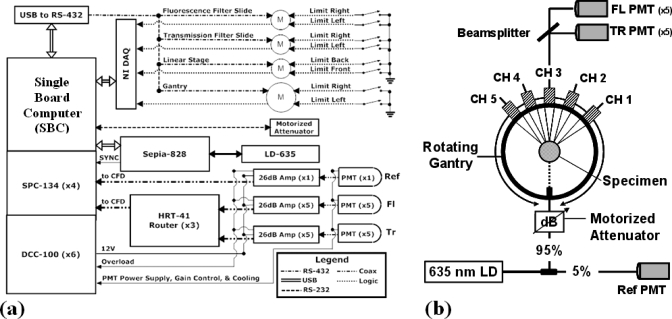
A hardware schematic of the FT scanner is shown in Fig. 2a and the optical system design is shown in Fig. 2b. The system consists of a customized 2.0 GHz single-board computer (Chassis Plans, San Diego, CA) equipped with 4 Gbytes of memory, and time-correlated single photon counting (TCSPC) instrumentation cards (Becker and Hickl, Berlin, Germany). Custom LABVIEW (National Instruments, Austin, TX) software programs have been developed to allow automated control of the data acquisition.
Figure 2.
The block diagram of the system hardware is shown in (a). LABVIEW based control of the laser, TCSPC instrumentation and motors controlling the gantry, linear stage, and filter slides allow full automation of the data acquisition. The fan-beam detection geometry is shown in (b). Here, a single excitation source position is used and the diffuse signals at the surface of the specimen are collected using focalized detection. The detected signals are then separated, and directed to two sets of PMTs dedicated to Fl and Tr signals at each fiber channel.
A computer controlled Sepia-828 laser diode driver module (PicoQuant, Berlin, Germany) controls the pumping to a gain-switched 635 nm pulsed diode laser modulated at 80 MHz. The diode is coupled to a 50 μm fiber optic beamsplitter that delivers 5% of the signal to a reference channel and the other 95% toward a collimated source fiber directed at the specimen. A computer controlled motorized attenuator in line with the source fiber can be dynamically adjusted to ensure that the detected Tr and Fl signals fall within the linear range of the photomultiplier tubes (PMTs). Diffuse Fl and excitation signals measurements are then collected in a Tr configuration, by five optical focusers with an angular separation of 22.5°, having a 97 mm working distance. The source-detector geometry was optimized using a simulation study and by empirically comparing reconstruction results for different fan-beam geometries. The focusers are coupled to 400 μm fibers (numerical aperature: 0.37), which were selected in order to maximize the signal intensity while minimizing dispersion. The detected signals are then split by beamsplitters, with 5% and 95% being directed to the Tr and Fl channels, respectively. The light is then collimated and spectrally separated using filters. An additional 2 optical density (OD) neutral density filter is used to attenuate the light in the transmission channel. In the Fl channels signals are separated using 650 nm cutoff long pass interference filters, for filtering Pp-IX Fl. Hamamatsu H7422P-50 PMTs detect the incident photons and generate a single analog pulse for each detected photon on each of ten channels. These pulses are then amplified by 26 dB (26 dB A), to ensure they fall within the suitable range of operation for the single photon counting instrumentation (SPC-134) and directed to routers (HRT-41). The routers, which allow up to four PMTs to be connected to a single device, interface directly with the TCSPC modules used in this system. The four TCSPC modules are synchronized with the laser oscillator at 80 MHz with three of the SPC modules dedicated to managing the signals coming from the ten PMTs connected to the three HRT-41 routers. The fourth SPC module is dedicated to the reference channel.
A USB to RS-432 link is used to communicate between the computer and the Intelligent Motion Systems M-Drive M23 and M34 motors used in controlling the filter slides, linear stage, and gantry. Mechanical limit switches are used in homing all devices and mechanical stops on the gantry prevent over rotating and the subsequent damage of optical equipment. National Instruments data acquisition hardware is used to close the feedback loop and receives logical high signals sent by the motors when a motion sequence has completed.
SYSTEM CHARACTERIZATION
Alignment: Centering
Many diffuse optical tomography systems rely on fiber based contact measurements for detection, often resulting in large coupling errors at the optical fiber-tissue interface. These errors are unpredictable and can introduce image artifacts, hinder contrast recovery, and in extreme cases render entire data sets useless. Noncontact imaging has the potential to minimize the coupling related noise up to the point where is negligible when well calibrated Fl-to-Tr ratio data is used. Here, highly accurate optical alignment is achieved using a custom alignment jig in Fig. 3a, designed to fit precisely into the gantry’s bore. The six cutouts correspond to the position of the source and detection channels and interface with the extension housing the laser source on the gantry. Optical alignment is achieved using a 1 mm pinhole located in the center of the jig and by maximizing the transmitted optical power with a power meter, as shown in Fig. 3b. Detector alignment is achieved by repositioning the jig and injecting the source into the optical lens. The light converges at the pinhole and the lens system is adjusted until optimal. Similarly, mechanical alignment of the linear stage is achieved using the setup shown in Fig. 3c. Here, an optical post is connected to the linear stage and adjusted until it slides freely through a precision reamed hole in the center of the optical alignment jig. In this configuration, radial symmetry of the Fl and microCT imagers can be achieved, allowing the sources and detectors to be placed virtually with very high accuracy. Specifically, the positional accuracy of the stage and gantry were determined to be 5 μm and 0.025° (arc length), respectively. The detection channel optics have a 97 mm working distance, corresponding to a 0.015° arc length of positioning error at the surface of a 25 mm diameter specimen.
Figure 3.
A photograph of the alignment jig is shown in (a). The jig fits precisely into the gantry allowing the optics to be radially aligned by maximizing the light signal through a pinhole, as shown in (b). Mechanical alignment is depicted in (c) and is performed to ensure the stage translates through the center of the gantry, allowing the source∕detector information to be placed virtually, given the microCT contour information.
Excitation source: Pump rate and temporal signature
The Sepia-828 laser diode driver allows for fully automated LABVIEW control of the diode’s pump rate and has the capacity to support up to 8 pulsed diode lasers. At this time the system has a single gain-switched 635 nm diode that was selected for imaging protoporphyrin IX Fl.
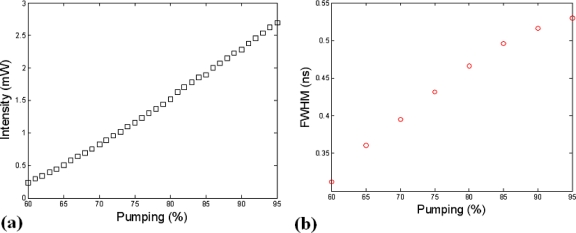
To determine the optimal pump rate for this application, the output intensity and full width at half maximum (FWHM) of the time domain pulse at the surface of the specimen were monitored as the gain was adjusted from the diode’s threshold to 95% of the maximum rating. The plots of intensity and FWHM as a function of the pump rate are shown in Figs. 4a, 4b, respectively. Based on these results a pump rate of 80% was selected corresponding to 1.52 mW of optical power at the surface of the specimen and a FWHM of ∼465 ps. The signal FWHM is the parameter that is setting the temporal resolution of the instrument. The latter is not critical for the study presented here as continuous wave (CW) measurements alone are being used. However, FWHM studies remained part of this analysis as it is an essential parameter in lifetime imaging, time resolved diffuse optical, and Fl molecular tomography, all of which are potential future areas of investigation and could be performed using this instrument.
Figure 4.
Plots of the 635 nm pulsed diode laser’s intensity (a) and temporal FWHM (b) are shown as a function of the driver’s pumping capability.
Detector characterization: Linearity, integration time, and optical power
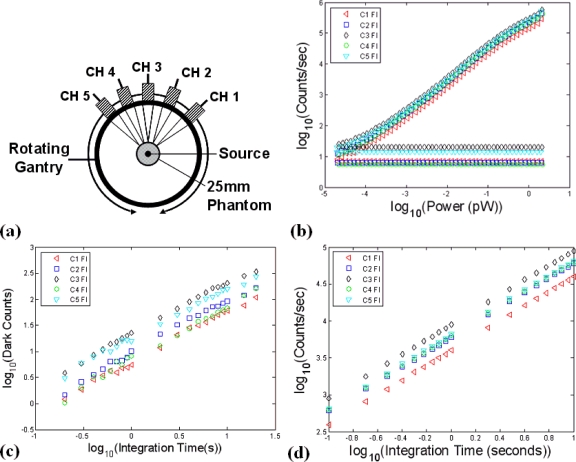
Detection linearity was examined as a function of increased integration time and input optical power using the experimental setup portrayed in Fig. 5a. To ensure all channels would detect the same intensity simultaneously, a collimated source fiber was used to inject the laser light into the center of a homogenous 25 mm phantom and diffuse Tr measurements were collected by the five detection channels (C1–C5), located several millimeters away from one another. In this setup, the same intensity is detected by the five optical channels, assuming the diffusive phantom is sufficiently homogenous and the detection spots are radially aligned with the center of the gantry. Out of focus detection could also result in a deviation in the relative intensity measurements and should be avoided during detector characterization. Results for the detector linearity, over an input optical power range of 2 pW–0.02 fW is shown for the Fl detection channels in Fig. 5b. The flat lines at the bottom of the figure correspond to the noise floor for each detector channel, as determined by the dark count rate. Dark counts arise due to thermally generated electrons in the semiconductor material, and increase linearly based on the integration time used. A plot of the dark counts as a function of integration time over the range 100 ms–10 s is shown in Fig. 5c. Using this information, a polynomial fit is applied to create a channel specific look-up that is used to remove the dark counts from the intensity data in performing the intensity calibration.
Figure 5.
In (a), the setup used to assess PMT linearity is shown. By using a collimated source and injecting it orthogonally into the center of a 25 mm cylindrical phantom, a diffuse uniform source is obtained and the same optical power was sampled by all channels simultaneously, allowing the relative sensitivities to be examined. PMT linearity over the entire dynamic range was also examined by examining the count rate as a function of input optical power (b). Plots of the dark count rate as a function of integration time are shown in (c) and the PMT time linearity response is shown in (d).
Detector linearity as a function of increased integration time was also examined, as shown in Fig. 5d. Here, the results are again shown for the five Fl detectors and indicate that a highly linear response can be obtained by varying the collection time of the TCSPC boards. The ability to increase integration time is one benefit of TCSPC instrumentation as it allows higher signal-to-noise ratios to be obtained in very low light applications.
DATA CALIBRATION AND IMAGE FORMATION
Intensity calibration: Correction for integration time and dark counts
Intensity calibration for each temporal point-spread function was achieved by integrating the detected counts and then normalizing each signal to account for the number of dark counts as well as changes in integration time and source∕detector attenuation levels for each channel
| (1) |
Here, represents the calibrated intensity measurement for a single channel and is the fluence expressed as the total number of photons detected by the TCSPC instrumentation. The dark counts for each channel are computed and subtracted from the integrated counts . This calculation is performed for each detector and then scaled by the integration time and attenuation level, as was applied to the source (ODsource) and detection channels (ODdetection).
Relative intensity calibration: Correction between channels
The raw data is then calibrated to account for channel-to-channel detection system variations which are a result of interchannel variability in the fiber coupling, beam splitter efficiency, and PMT radiant sensitivity. This is achieved by dividing each raw measurement by channel specific scaling factors (SFs) precomputed from the plots of detector linearity as a function of input optical power shown in Fig. 5b. Using the same experimental setup and by injecting a source fiber into the center of a highly homogenous phantom, the same absolute intensity will be observed by all detection channels and the relative intensities can be computed. Specifically, SFs were computed by normalizing each channel as follows:
| (2) |
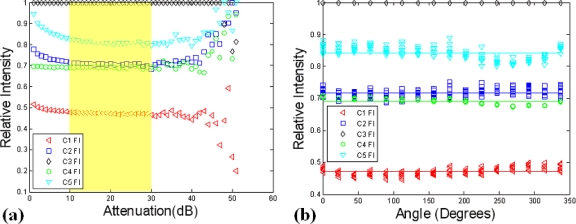
where represents the CW intensity measurement at channel i for each level of attenuation (dB) applied to the source. SFi were then created for each of the ten detection channels by dividing each relative intensity by the maximum CW intensity for that attenuation level. Results over the entire dynamic range of the TCSPC system for the five Fl detection channels are illustrated in Fig. 6a. From this figure it is apparent that SFs are linear over two orders of magnitude, corresponding to a detectable intensity range of approximately 200–2 fW, as highlighted yellow in this figure. To account for phantom inhomogeneity and the possibility of out of focus detection, the experiment was repeated using only the linear range and by rotating the gantry in increments of 22.5° around the periphery of the phantom. The results are depicted in Fig. 6b. Calibrated relative intensity measurements are then computed as follows:
| (3) |
The previously computed raw intensity measurements were divided by the channel specific SFi to yield calibrated relative intensity measurements .
Figure 6.
In (a) the relative intensity of each detection channel was calculated over the entire dynamic range of the TCPSC system using the experimental setup in Fig. 5a. The results were used to determine the useful dynamic range and determine the relative SFs (b). The SF results were then used in calibrating raw data files.
Tomographic data calibration
A more detailed explanation of data calibration in FT has been previously presented in detail.31, 32 Here, to minimize the impact of excitation light leakage through the Fl filter as well as to minimize endogenous background Fl, a point-by-point difference technique was applied to the Fl intensity measurements as follows:
| (4) |
where i denotes the measurement number and the subscript fl refers to the Fl emission signals. The subscripts hetero and homo denote heterogeneous (postcontrast) and homogenous (precontrast) Fl data sets, respectively. The adjusted Fl data was then divided by the heterogeneous Tr data set at the excitation wavelength and finally scaled to the Tr fluence generated by to yield a calibrated Fl data set .
| (5) |
Image reconstruction
Fl yield reconstructions were performed using NIRFAST, a nonlinear, finite-element (FEM) solver designed to model frequency domain Tr and Fl light transport in tissue. A detailed presentation of the theoretical formulation for Fl reconstruction as utilized by NIRFAST has previously been presented.31, 33 Fl yield reconstructions were performed by minimizing the least square difference between the calibrated Fl data and model FEM generated forward data.
| (6) |
where M and N represent the number of experimental measurements and the number of unknowns to be recovered, respectively; and are the measured and model intensity data, respectively, and λ is the regularization parameter. Values of ημaf at each point within the model are given by μ while μ0 is the initial parameter estimate. For evaluations, excitation and emission optical properties were assumed to be equal and an absorption coefficient μax=μam=0.01 mm−1, reduced scattering coefficient were held constant, as Fl only reconstructions were performed.
The anatomical images were obtained from x-ray microCT and then segmented using region growing segmentation software (MIMICS, Materialize Inc., Leuven, Belgium). Binary masks representing the distinct regions of tissue, the phantom and target volumes in this work, were then exported to a custom Matlab script allowing region labeled FEM meshes to be generated. The virtual locations of each source and corresponding set of measurements were then calculated by determining the intersection points at the surface of the phantom, given the contour information from the μCT. This method of source∕detector positioning was determined to be robust.
FLUORESCENCE-TO-TRANSMISSION RATIO
Calibration validation
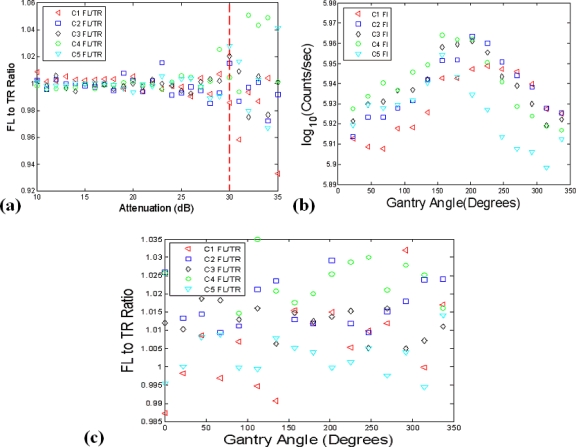
The Fl-to-Tr ratio data has previously been shown to reduce coupling errors at the air-tissue interface and minimize the influence of tissue heterogeneities.32, 34 Here, in an effort to verify that the raw and relative intensity calibration has been performed properly, ratio data was examined using the data previously used in computing the SFs. A uniform intensity was sampled by all channels and only the linear region for the instrument response [see Fig. 6a] was utilized, so a Fl-to-Tr ratio of one can be expected for properly calibrated data. The ratio results for 30 consecutive samples, obtained at a fixed gantry angle are depicted in Fig. 7a and indicate that a 1.2% error can be expected when the Fl-to-Tr ratio is taken over the linear range of the PMTs. It is also significant to note that the data calibration begins to break down below 30 dB or 2 fW, at an approximate count rate of 500 counts∕s, as shown in Fig. 7a. As a result, the laser source power is dynamically adjusted so that this minimum threshold will be met, or if not possible the data is excluded during the reconstruction process.
Figure 7.
In (a), the data calibration process was analyzed by taking the Fl-to-Tr ratio measurements of the calibrated relative intensity data. Using the experimental setup depicted in Fig. 5a, a Fl-to-Tr ratio of one can be expected for well calibrated data. The validity of absolute intensity data values were also examined in (b) and determined to be problematic, based on an observed 11% standard deviation in the data that should be calibrated to the same value. The Fl-to-Tr data type appeared more resistant to errors from possible misalignment of the stage with respect to the gantry’s center of rotation, as shown in (c).
The variation in calibrated intensity as a function of the gantry angle was also investigated to examine the impact of phantom inhomogeneities and possible misalignments of the stage with respect to the gantry’s center of rotation. The experimental setup previously employed in Fig. 5a was again utilized and calibrated intensity measurements were acquired (N=10) at 16 angles as the gantry was rotated over a range of 0°–360°. The results are illustrated in Fig. 7b and indicate that an 11% deviation in the calibrated intensity can be expected in the intensity data. This discrepancy is likely due to phantom inhomogeneity and gantry-phantom misalignments. This is corrected when the Fl-to-Tr ratio is implemented, however, as shown in Fig. 7c. In this scenario an average error of 0.6% was observed in the ratio data when all channels are considered.
Out of focus detection
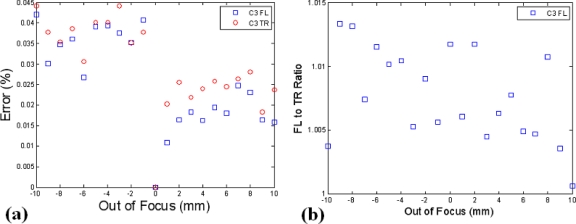
To examine the impact of out of focus detection and the benefits ratio data might provide, the setup depicted in Fig. 5a was again used, but with a linear translating stage attached to allow the working distance plane to be systematically adjusted. The system utilizes focalized detection designed to operate at a working distance of 97 mm. Here, a ±10 mm offset was applied, as this is within a reasonable range of what can be expected for a mouse positioned in the system. The percent error in detected intensity was calculated using the 0 mm position as the reference, corresponding to the operation at the proper working distance. These results are highlighted in Fig. 8a and indicate that absolute intensity errors of up to several percent can occur between working distances of 97 and 107 mm. Again, the Fl-to-Tr ratio should be resistant to errors from this, with a standard deviation error of only 0.8% apparent in this data set, as shown in Fig. 8b.
Figure 8.
The position of a 25 mm phantom was systematically adjusted between the proper working distance and ±10 mm out of focus. The percent deviation in calibrated intensity relative to the proper working distance is shown in (a) and the Fl-to-Tr ratio results are highlighted in (b).
EXPERIMENTS
Phantoms
Phantoms used in this work were created by ART, Inc. Both the homogenous and heterogeneous phantoms contained an 8 mm target, consisted of intrinsic optical properties μax=0.01 mm−1, μsx=1 mm−1, and an isotropic diffusion coefficient (Dx=0.337 mm). NIRFAST meshes were assigned these optical properties values at both the excitation and emission wavelengths. The refractive index for tissue was assumed to be n=1.33. The fluorophore lifetime (τ) was set to zero because light transport modeling for total light intensity (the only type of data considered here) to a good approximation does not depend on lifetime.
Reconstruction linearity
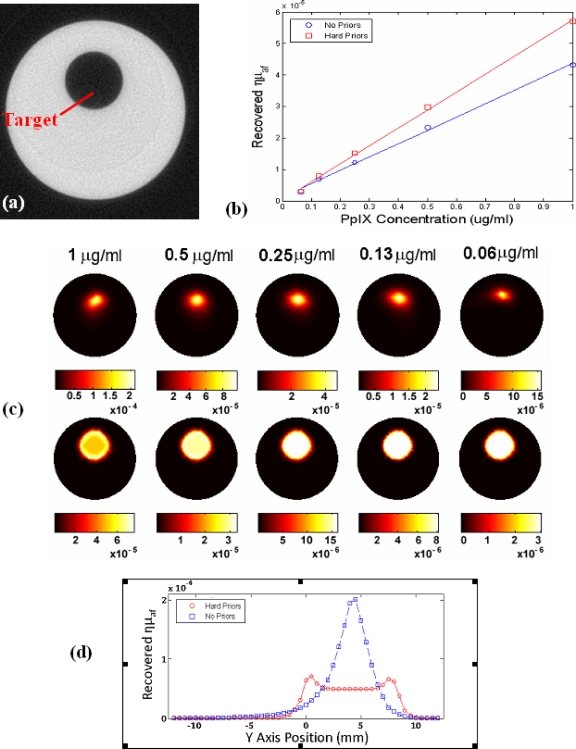
To assess the linearity in reconstructing Fl yield, a 25 mm diameter phantom (μa=0.1 mm−1. ) containing an 8 mm diameter fluorescent target was imaged with and without spatial hard priors. The phantom was first scanned in the microCT in Fig. 9a to obtain the boundary information required for placing the optical sources, as well as the location of the target, to be used in the hard prior reconstruction. The target volume was then filled with a Pp-IX∕intralipid emulsion and imaged over a range of concentrations from 1 to 0.0625 μg∕ml. Linearity results of the recovered Fl yield are shown with and without spatial hard priors in Fig. 9b. The corresponding images are shown in Fig. 9c and are representative of system performance, and Fig. 9d shows a profile plot through the highest pair of concentrations, illustrating the difference between no prior information and the type of recovery with prior information. Here, the recovered Fl yield is shown with and without spatial hard priors in the bottom and top of Fig. 9c, respectively. From these results it is apparent that the recovered size and fluorescent yield are underestimated when the spatial prior information is not used and that the quantification can be improved using the prior structural information.
Figure 9.
A cross sectional μCT image of the 25 mm diameter resin phantom is shown in (a). System linearity was examined by filling the target region with a range of protoporphyrin IX concentrations with Intralipid to match the phantom. The recovered Fl yield values (ημaf), from tomography were as shown in (b). The corresponding images are shown without prior information (top) and with (bottom) priors in (c). In (d) a profile plot is shown for the reconstruction of the highest concentration, showing the cross section vertically through the inhomogeneity, for the two cases of with and without prior information in the reconstruction.
Imaging irregular geometries
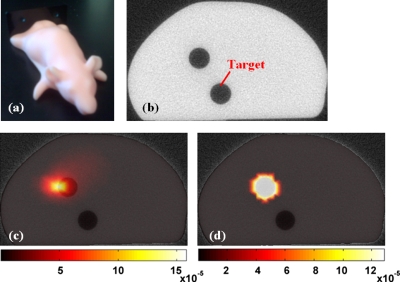
The system was intentionally designed as a fully noncontact system and as such the potential errors associated with irregular geometries are critical to analyze. To address this aspect an anthropomorphic mouse phantom was used (Caliper Life Sciences, Hopkinton, MA) to test the system in the typically realistic mouse imaging application. This was done to asses the inherent impact of measurements obtained out of focus and non-normal to the detection geometry. The phantom, shown in Fig. 10a was scanned with the microCT system to obtain the anatomical and boundary contour information, Fig. 10b. This particular phantom comes equipped with removable 3 mm diameter rods to allow various manufacturer supplied fluorophores to be imaged. In this experiment, only the top target was utilized, and was filled with 5 μg∕ml of a liquid protoporphyrin IX∕intralipid mixture to ensure perfect coupling at the phantom∕target interface. The second lower cylindrical hole target had no Fl present, but was filled with a homogenous intralipid mixture. The reconstructed Fl images are shown overlaid on the corresponding microCT slice without and with the spatial hard priors information in Figs. 10c, 10d, respectively.
Figure 10.
An image of the mouse phantom is shown in (a), with an anatomical image obtained from the microCT shown in (b) in the plane of FT imaging. The superimposition of the microCT and corresponding Fl image is shown in (c) with diffuse tomography and in (d) with the use of spatial prior information from the μCT scan.
DISCUSSION
The challenges in construction and testing of a small animal imaging system are many and this work has been an effort to build a system to addresses the demands for the molecular imaging applications rodents are commonly used in. The design goals used to create this system were as follows:
-
(1)
provide maximal sensitivity for optical tomographic data using single photon counting,
-
(2)
utilize a noncontact interface which is compatible with microCT imaging,
-
(3)
acquire Fl and Tr signals in parallel,
-
(4)
provide a total imaging time of several minutes, and
-
(5)
image with multiple detectors in parallel.
Each of these goals has been met with this system and the basic calibration stages have been outlined in this paper. Both of which are necessary critical steps in establishing the credibility of the device, prior to using it in small animal imaging studies where biological applications will be the focus.
Important observations in this calibration have been that there is a linear range in which the Fl- to-Tr ratio is well calibrated and it will be critical to ensure in software control that it is not operated outside this range. Additionally, the use of the Fl-to-Tr ratio is an important way to self-normalize the data and ensure that the model-based reconstruction is successful.
In both the cylindrical and mouse phantom results, as we have empirically observed, target localization can be achieved with reasonable accuracy. However the Fl yield quantification is not highly accurate and so the reconstructed images are not presented as calibrated concentration units but rather as yield values. Careful calibration of the data with ex vivo validation are required prior to trying to report the recovered images in concentration units, but this could be achieved with further in vivo testing.
On the instrumentation side of things, improvements are being considered to dynamically improve the signal to noise of each data measurement, which may improve the reconstruction value accuracy. Nonetheless, the linearity of reconstruction is excellent, and so imaging with a calibration to the true value or to look at relative changes in concentration is certainly feasible. Future work will focus on validating the changes seen in phantoms and animal models with the system as well as on developing reconstruction algorithms for 3D imaging.
ACKNOWLEDGMENTS
This work was collaboratively funded by NIH Research Grant No. R01CA120368 at Dartmouth College and ART Inc., Montreal, PQ, Canada.
References
- Ntziachristos V., Yodh A. G., Schnall M., and Chance B., Proc. Natl. Acad. Sci. U.S.A. 10.1073/pnas.040570597 97, 2767 (2000). [DOI] [PMC free article] [PubMed] [Google Scholar]
- Pogue B. W., Poplack S. P., McBride T. O., Wells W. A., Osterman K. S., Österberg U. L., and Paulsen K. D., Radiology 218, 261 (2001). [DOI] [PubMed] [Google Scholar]
- Ntziachristos V., Yodh A. G., Schnall M. D., and Chance B., Neoplasia 10.1038/sj.neo.7900244 4, 347 (2002). [DOI] [PMC free article] [PubMed] [Google Scholar]
- Corlu A., Choe R., Durduran T., Lee K., Schweiger M., Arridge S. R., Hillman E. M., and Yodh A. G., Appl. Opt. 10.1364/AO.44.002082 44, 2082 (2005). [DOI] [PubMed] [Google Scholar]
- Sevick-Muraca E. M., Houston J. P., and Gurfinkel M., Curr. Opin. Chem. Biol. 10.1016/S1367-5931(02)00356-3 6, 642 (2002). [DOI] [PubMed] [Google Scholar]
- Ntziachristos V., Bremer C., and Weissleder R., Eur. Radiol. 13, 195 (2003). [DOI] [PubMed] [Google Scholar]
- Weissleder R., Nat. Rev. Cancer 10.1038/nrc701 2, 11 (2002). [DOI] [PubMed] [Google Scholar]
- Weissleder R., Tung C. H., Mahmood U., and A.Bogdanov, Jr., Nat. Biotechnol. 10.1038/7933 17, 375 (1999). [DOI] [PubMed] [Google Scholar]
- Ntziachristos V., Tung C. H., Bremer C., and Weissleder R., Nat. Med. 8, 757 (2002). [DOI] [PubMed] [Google Scholar]
- Pogue B. W., Gibbs S. L., and Chen B., Technol. Cancer Res. Treat. 3, 15 (2004). [DOI] [PubMed] [Google Scholar]
- Ntziachristos V., Ripoll J., Wang L. V., and Weissleder R., Nat. Biotechnol. 10.1038/nbt1074 23, 313 (2005). [DOI] [PubMed] [Google Scholar]
- Brooksby B., Pogue B. W., Jiang S., Dehghani H., Srinivasan S., Kogel C., Tosteson T., Weaver J. B., Poplack S. P., and Paulsen K. D., Proc. Natl. Acad. Sci. U.S.A. 10.1073/pnas.0509636103 103, 8828 (2006). [DOI] [PMC free article] [PubMed] [Google Scholar]
- Ntziachristos V. and Weissleder R., Med. Phys. 10.1118/1.1470209 29, 803 (2002). [DOI] [PubMed] [Google Scholar]
- Graves E. E., Ripoll J., Weissleder R., and Ntziachristos V., Med. Phys. 10.1118/1.1568977 30, 901 (2003). [DOI] [PubMed] [Google Scholar]
- Schulz R. B., Ripoll J., and Ntziachristos V., IEEE Trans. Med. Imaging 10.1109/TMI.2004.825633 23, 492 (2004). [DOI] [PubMed] [Google Scholar]
- Patwardhan S. V., Bloch S. R., Achilefu S., and Culver J. P., Opt. Express 10.1364/OPEX.13.002564 13, 2564 (2005). [DOI] [PubMed] [Google Scholar]
- D'Andrea C., Spinelli L., Comelli D., Valentini G., and Cubeddu R., Phys. Med. Biol. 10.1088/0031-9155/50/10/009 50, 2313 (2005). [DOI] [PubMed] [Google Scholar]
- Davis S. C., Pogue B. W., Springett R., Leussler C., Mazurkewitz P., Tuttle S. B., Gibbs-Strauss S. L., Jiang S., Dehghani H., and Paulsen K. D., Rev. Sci. Instrum. 10.1063/1.2919131, 79, 064302 (2008). [DOI] [PMC free article] [PubMed] [Google Scholar]
- Deliolanis N., Lasser T., Hyde D., Soubret A., Ripoll J., and Ntziachristos V., Opt. Lett. 10.1364/OL.32.000382 32, 382 (2007). [DOI] [PubMed] [Google Scholar]
- Barbour R. L., Graber H. L., Chang J., Barbour S. S., Koo P. C., and Aronson R., IEEE Comput. Sci. Eng. 10.1109/99.476370 2, 63 (1995). [DOI] [Google Scholar]
- Brooksby B., “Combined near-infrared tomography and MRI to improve breast tissue chromophore and scattering assessment,” Ph.D. thesis, Dartmouth College, 2005. [Google Scholar]
- Zhu Q., Chen N., and Kurtzman S. H., Opt. Lett. 10.1364/OL.28.000337 28, 337 (2003). [DOI] [PMC free article] [PubMed] [Google Scholar]
- Zhu Q., Kurtzma S. H., Hegde P., Tannenbaum S., Kane M., Huang M., Chen N. G., Jagjivan B., and Zarfos K., Neoplasia 10.1593/neo.04526 7, 263 (2005). [DOI] [PMC free article] [PubMed] [Google Scholar]
- Carpenter C. M., Pogue B. W., Jiang S., Dehghani H., Wang X., Paulsen K. D., Wells W. A., Forero J., Kogel C., Weaver J. B., Poplack S. P., and Kaufman P. A., Opt. Lett. 10.1364/OL.32.000933 32, 933 (2007). [DOI] [PubMed] [Google Scholar]
- Xu H., Springett R., Dehghani H., Pogue B. W., Paulsen K. D., and Dunn J. F., Appl. Opt. 10.1364/AO.44.002177 44, 2177 (2005). [DOI] [PubMed] [Google Scholar]
- Zacharakis G., Kambara H., Shih H., Ripoll J., Grimm J., Saeki Y., Weissleder R., and Ntziachristos V., Proc. Natl. Acad. Sci. U.S.A. 10.1073/pnas.0504628102 102, 18252 (2005). [DOI] [PMC free article] [PubMed] [Google Scholar]
- Zacharakis G., Kambara H., Shih H., Ripoll J., Grimm J., Saeki Y., Weissleder R., and Ntziachristos V., Proc. Natl. Acad. Sci. U.S.A. 10.1073/pnas.0504628102 102, 18252 (2005). [DOI] [PMC free article] [PubMed] [Google Scholar]
- Weber S. M., Peterson K. A., Durkee B., Qi C., Longino M., Warner T., Lee F. T., and Weichert J. P., J. Surg. Res. 119, 41 (2004). [DOI] [PubMed] [Google Scholar]
- Ohta S., Lai E. W., Morris J. C., Bakan D. A., Klaunberg B., Cleary S., Powers J. F., Tischler A. S., Abu-Asab M., Schimel D., and Pacak K., Int. J. Cancer 119, 2236 (2006). [DOI] [PMC free article] [PubMed] [Google Scholar]
- Paulus M. J., Gleason S. S., Kennel S. J., Hunsicker P. R., and Johnson D. K., Neoplasia 10.1038/sj.neo.7900069 2, 62 (2000). [DOI] [PMC free article] [PubMed] [Google Scholar]
- Kepshire D. S., Davis S. C., Dehghani H., Paulsen K. D., and Pogue B. W., Appl. Opt. 10.1364/AO.46.001669 46, 1669 (2007). [DOI] [PubMed] [Google Scholar]
- Soubret A., Ripoll J., and Ntziachristos V., IEEE Trans. Med. Imaging 10.1109/TMI.2005.857213 24, 1377 (2005). [DOI] [PubMed] [Google Scholar]
- Davis S. C., Dehghani H., Wang J., Jiang S., Pogue B. W., and Paulsen K. D., Opt. Express 10.1364/OE.15.004066 15, 4066 (2007). [DOI] [PubMed] [Google Scholar]
- Ntziachristos V. and Weissleder R., Opt. Lett. 10.1364/OL.26.000893 26, 893 (2001). [DOI] [PubMed] [Google Scholar]


