

Abstract
In the brain, ischemic preconditioning (IPC) diminishes mitochondrial dysfunction after ischemia and confers neuroprotection. Activation of ε protein kinase C (εPKC) has been proposed to be a key neuroprotective pathway during IPC. We tested the hypothesis that IPC increases the levels of εPKC in synaptosomes from rat hippocampus, resulting in improved synaptic mitochondrial respiration. Preconditioning significantly increased the level of hippocampal synaptosomal εPKC to 152% of sham-operated animals at 2 d of reperfusion, the time of peak neuroprotection. We tested the effect of εPKC activation on hippocampal synaptic mitochondrial respiration 2 d after preconditioning. Treatment with the specific εPKC activating peptide, tat-ψεRACK (tat-ψε-receptor for activated C kinase), increased the rate of oxygen consumption in the presence of substrates for complexes I, II, and IV to 157, 153, and 131% of control (tat peptide alone). In parallel, we found that εPKC activation in synaptosomes from preconditioned animals resulted in altered levels of phosphorylated mitochondrial respiratory chain proteins: increased serine and tyrosine phosphorylation of 18 kDa subunit of complex I, decreased serine phosphorylation of FeS protein in complex III, increased threonine phosphorylation of COX IV (cytochrome oxidase IV), increased mitochondrial membrane potential, and decreased H2O2 production. In brief, ischemic preconditioning promoted significant increases in the level of synaptosomal εPKC. Activation of εPKC increased synaptosomal mitochondrial respiration and phosphorylation of mitochondrial respiratory chain proteins. We propose that, at 48 h of reperfusion after ischemic preconditioning, εPKC is poised at synaptic mitochondria to respond to ischemia either by direct phosphorylation or activation of the εPKC signaling pathway.
Keywords: cerebral ischemia, phosphorylation, electron transport chain, neuroprotection, cell death, hippocampus
Introduction
Ischemic preconditioning (IPC) refers to the protection conferred by a mild ischemic challenge against a subsequent, normally lethal, ischemic insult. In the brain, IPC is a transient phenomenon. The cellular and subcellular mechanisms that support IPC remain unclear (for review, see Kirino, 2002; Dirnagl et al., 2003; Kapinya, 2005; Gidday, 2006). IPC in both heart and brain activates the ε protein kinase C (εPKC) signaling cascade, a key pathway that plays a critical role in neuroprotection afforded against lethal ischemia (Di-Capua et al., 2003; Raval et al., 2003; Lange-Asschenfeldt et al., 2004; Bright and Mochly-Rosen, 2005; Chou and Messing, 2005; Li et al., 2005; Perez-Pinzon et al., 2005; Long et al., 2006).
Several signaling pathways downstream of εPKC have been described, including the following: the Src family of protein tyrosine kinases, the mitogen-activated protein kinase (MAPK) p38, the MAPK/extracellular signal-regulated kinase (ERK) kinase MEK1/2, and the serine/threonine kinase Akt (Bolli et al., 1998; Bolli, 2000; Lange-Asschenfeldt et al., 2004; Weber et al., 2005; Greco et al., 2006; Kim et al., 2007). These signaling pathways (and potentially many others yet to be identified) evoke posttranslational modifications of existing proteins as well as transcriptional activation and de novo protein synthesis that result in neuroprotection. Inhibition of apoptosis by εPKC involves mitochondria (Baines et al., 2003). Baines et al. (2002) demonstrated that transgenic mice expressing activated εPKC formed εPKC–ERK “modules” in cardiac mitochondria. Several protective mitochondrial targets for εPKC have been demonstrated including the following: (1) εPKC interaction with subunit IV of the mitochondrial respiratory chain cytochrome c oxidase complex, resulting in increase in its activity in cardiac myocytes (Ogbi et al., 2004; Ogbi and Johnson, 2006); (2) preservation of coupled oxidative phosphorylation, prevention of loss of mitochondrial cytochrome c, and conservation of mitochondrial membrane potential (Δψm) in response to anoxia–reoxygenation (McCarthy et al., 2005); and (3) inhibition of mitochondrial permeability transition pore (MPTP) opening by direct interaction with pore components (Baines et al., 2003). However, in the context of ischemic preconditioning in the brain, the effect of εPKC activation on mitochondrial function remains to be elucidated.
The central aim of the present study was to investigate the interaction of εPKC with neuronal mitochondria. In a preliminary study, we showed that IPC increased the levels of εPKC in synaptosomes. Here, we specifically asked whether activation of εPKC after ischemic preconditioning enhanced mitochondrial function in hippocampal synaptosomes. We used synaptosomes as a model system to study the effect of εPKC on mitochondrial function in neurons. The main advantages of using the synaptosomal preparation are as follows: (1) synaptosomes are anucleated mammalian “mini-cells” containing mitochondria, presynaptic vesicles, and containing cytoplasmic metabolic pathways and protein synthesis machinery [for details, see review (Nicholls, 2003)]; (2) mitochondria residing in synaptosomes represent neuronal mitochondria; (3) these mitochondria play an important role in neurotransmitter release by buffering calcium and providing energy to maintain ionic gradients across synaptic plasma membrane, all key factors affected by ischemia/reperfusion; and (4) with proper care, synaptosomes can be harvested at different times after an ischemic insult, thus more closely representing the state of neuronal mitochondria in vivo.
Materials and Methods
Chemicals.
All chemicals were of analytical grade and were purchased from Sigma-Aldrich (St. Louis, MO). The protein assay kit was purchased from Bio-Rad (Hercules, CA).
Animal model.
All animal procedures were performed in accordance with the Guide for the Care and Use of Laboratory Animals published by the National Institutes of Health and approved by the Animal Care and Use Committee of the University of Miami. Male Sprague Dawley rats weighing 250–300 g were fasted overnight and then anesthetized with 4% isoflurane and 70% nitrous oxide (in a balance of oxygen) by inhalation. The femoral arteries were cannulated for blood pressure measurements and for arterial sampling of blood gases. Arterial blood gases (model ABL-500; Radiometer, Copenhagen, Denmark), plasma glucose levels (One Touch glucose monitor; LifeScan, Milpitas, CA), and hematocrit were measured throughout the experiment. Our goal was to maintain blood gases in the normal range (arterial pCO2, 35–40 mmHg; pO2, 120–140 mmHg). If blood gases were not maintained within this range throughout the period of surgery and data collection, the rats were killed and not included in the analysis. After endotracheal intubation and artificial ventilation with 1% isoflurane and 70% nitrous oxide (in a balance of oxygen), the rats were immobilized with pencuronium (0.75 mg/kg, i.v.). Both common carotid arteries were exposed by a midline ventral incision and gently dissected free of surrounding nerve fibers. Ligatures of polyethylene (PE-10) tubing, contained within a double-lumen SILASTIC tubing, were passed around each carotid artery. Brain temperature was monitored with a 33 gauge thermocouple implanted in the temporalis muscle (Dietrich et al., 1993). The temperature was maintained at 36.5–37°C throughout the experiment by a small warming lamp placed above the animal's head.
Induction of ischemic preconditioning.
Before preconditioning, blood was gradually withdrawn from the femoral vein into a heparinized syringe to reduce systemic blood pressure to 50 mmHg. Cerebral ischemia then was produced by tightening the carotid ligatures bilaterally. We previously showed that this procedure promotes loss of ion homeostasis (anoxic depolarization as measured with potassium-selective microelectrodes), as well as histopathological changes (Perez-Pinzon et al., 1997). To allow postischemic reperfusion, the carotid ligatures were removed, and the shed blood was reinjected into the femoral vein. This infusion usually restored mean arterial blood pressure to 130–140 mmHg. The vessels were inspected to verify that perfusion was reestablished. The ischemia was of 2 min duration. The two experimental groups were as follows: (1) sham, sham surgery was performed on the animals; and (2) IPC, 2 min of ischemia (IPC) was induced.
Isolation of hippocampal synaptosomes.
Hippocampal synaptosomes were isolated according to previously published procedures (Dunkley et al., 1988) with a minor modification. In brief, rats were decapitated under isoflurane anesthesia after IPC or sham operation. The hippocampus was removed immediately and immersed into cold (4°C) isolation medium. The average weight of hippocampus in all animal groups was ∼120 mg (pooled from both hemispheres). Isolation medium consisted of 250 mm sucrose, 1 mg/ml bovine serum albumin (fraction V) (BSA), 1.0 mm ethylenediaminetetra-acetic acid, and 0.25 mm dithiothreitol, pH 7.4. Tissue was minced with a pair of scissors and rinsed thoroughly with the isolation medium. The minced tissue was homogenized in a hand-operated glass Teflon homogenizer by seven up-and-down strokes. The homogenate was diluted to yield 10% (w/v) homogenate. The homogenate was centrifuged at 500 × g for 5 min in Sorvall (Newton, CT) RC5 centrifuge. The supernatant was collected in another tube. To improve yield of synaptosomes, the pellet was rehomogenized and diluted to 10% (w/v). This rehomogenization step is a modification to the previously published procedures (Dunkley et al., 1988). The resulting homogenate was centrifuged at 500 × g for 5 min in Sorvall RC5 centrifuge. The supernatant then was pooled with the supernatant obtained from the previous centrifugation. The pooled supernatant was layered on the Percoll gradient. The gradients were prepared in 3.0 ml polycarbonate tubes and consisted of 0.6 ml each of 23, 15, 10, and 3% (v/v) Percoll. The gradients were centrifuged at 32,500 × g for 5 min. The synaptosomes were collected from the junction of 10–15 and 15–23% Percoll layers.
The synaptosomes were washed once with isolation media, using 3.0 ml polycarbonate tubes, by centrifugation at 15,000 × g for 10 min. The resulting pellet was washed with 0.25 m sucrose by centrifugation at 15,000 × g for 10 min. The resulting synaptosomal pellet was suspended in 0.25 m sucrose to give ∼0.75–1.5 mg of protein per milliliter. Experiments on synaptosomes were conducted using this respective final suspension. The entire procedure was completed within 1–1.5 h. All synaptosomal isolation procedures were performed at 4°C.
Isolation of soluble fraction.
This method is adapted from a previously published technique (Mackay and Mochly-Rosen, 2001). The hippocampus was homogenized in cell lysis buffer (4 mm ATP, 100 mm KCl, 10 mm imidazole, 2 mm EGTA, 1 mm MgCl2, 20% glycerol, 0.05% Triton X-100, 17 μg/ml PMSF, 20 μg/ml soybean trypsin inhibitor, 25 μg/ml leupeptin, and 25 μg/ml aprotinin). The homogenate was then centrifuged at 4°C at 1000 × g for 10 min. The supernatant (soluble fraction) was carefully collected and recentrifuged at 16,000 × g for 15 min to exclude any contaminating pellet material. The resulting supernatant was used as a source of soluble fraction.
Ex vivo εPKC activation.
Activation of εPKC was induced by incubating synaptosomes with either tat carrier peptide or tat-ψε-receptor for activated C kinase (tat-ψεRACK) (εPKC activator) (Dorn et al., 1999; Schwarze et al., 1999) (KAI Pharmaceuticals, South San Francisco, CA) (1 μm final concentration) for 15 min at 4°C.
Polarographic studies in isolated synaptosomes.
Substrate oxidation rates and phosphorylating capacities of isolated synaptosomes were determined polarographically and were performed essentially according to the procedure of Hofhaus et al. (1996). For respiration studies, synaptosomes were permeabilized with 0.007% digitonin. In brief, oxygen consumption was measured polarographically in respiration medium consisting of 150 mm sucrose, 25 mm Tris-HCl, pH 7.4, and 10 mm potassium phosphate buffer, pH 7.4, using a 0.25-ml-capacity incubation chamber with a water jacket (30°C) and a Clark-type oxygen electrode (Hansatech Instruments, Norfolk, UK). The medium inside of the chamber was stirred continuously with a magnetic stir bar. The signal from the oxygen electrode was amplified, digitized, and acquired using Oxygraph hardware and software (Hansatech Instruments).
The respiratory control index (RCI) was measured in the presence of 5 mm pyruvate and 2.5 mm malate. The RCI is defined as the ratio of the respiratory rate in presence and absence of ADP (i.e., state 3/state 4). For substrate oxidation, 0.03–0.05 mg of synaptosomal protein was added into the assay. The experiment was performed in the recording medium described above. The rate of respiration in presence of 5 mm pyruvate plus 2.5 mm malate, NADH-linked substrates, was measured in the presence of excess ADP (0.5 mm final concentration). The rate of oxygen consumption was recorded for 2–3 min. The complex I reaction was inhibited by addition of 10 μl of rotenone (5 mm). Next, 8 mm succinate plus 4 mm glycerol-3-phosphate was added. The rate of oxygen consumption was recorded for 2–3 min. The reaction was inhibited by addition of 10 μl of antimycin (10 μm), a complex III inhibitor. In the same assay, 0.5 mm ascorbate plus 200 mm N,N,N′,N′-tetramethyl-p-phenylenediamine (TMPD) was added. The rate of oxygen consumption was recorded for 1–2 min. This reaction was inhibited by addition of potassium cyanide (1.8 mm).
In brief, the summary of the above mentioned sets of substrates are given as follows: (1) pyruvate plus malate (promotes complex I activity and respiration rate reflects the net efficiency of complexes I, III, and IV); (2) succinate plus glycerol-3-phosphate (promotes complex II activity and reflects efficiency of complexes II, III, and IV); and (3) ascorbate plus TMPD (promotes complex IV activity and reflects efficiency of complex IV).
Spectrophotometric studies in isolated synaptosomes.
The measurement of the specific activity of the individual complexes of the respiratory chain was performed using absorbance-based spectrophotometric assays, as described by Rustin et al. (1994). Assays for each of the four complexes were performed at 37°C. The volume of reaction was 1.0 ml in the case of each complex. Each assay is described in detail below.
Measurements of rotenone-sensitive NADH-decylubiquinone oxidoreductase (complex I).
The assay was performed with 20–40 μg of synaptosomal protein at 340 nm using the acceptor decylubiquinone (50 μm) and 0.8 mm NADH as a donor, in 10 mm Tris-HCl buffer, pH 8.0, medium containing 1 mg/ml BSA. To make the mitochondrial internal membrane permeable to NADH, mitochondria were incubated with H2O for 3 min at 37.5°C. Using 3 μm rotenone allowed us to quantify the rotenone-sensitive activity.
Measurements of succinate phenazine methosulfate dichlorophenol indophenol reductase (complex II).
The assay was performed with 5–10 μg of synaptosomal protein at 600 nm using 100 μm 2,6-dichlorophenol indophenol as the acceptor and 16 mm succinate as the donor in a medium containing 10 mm KH2PO4, pH 7.8, 2 mm ethylenediaminetetra-acetic acid, and 1 mg/ml BSA in the presence of 1 mm methyl phenazine methosulfate, 3 μm rotenone, 0.2 mm ATP, and 0.3 mm potassium cyanide as described previously (Barrientos et al., 1998). The addition of 10 mm malonate inhibited the oxidation of succinate.
Measurements of decylubiquinone cytochromec reductase (complex III).
The assay was performed with 1–5 μg of synaptosomal protein at 550 nm using 40 μm cytochrome c (oxidized) as the acceptor and 50 mm duroquinol as the donor in the medium containing 10 mm KH2PO4, pH 7.8, 2 mm ethylenediaminetetra-acetic acid, and 1 mg/ml BSA in the presence of 0.3 μm rotenone, 10 mm succinate, 0.2 mm ATP, and 0.3 mm KCN. The addition of 0.4 μm antimycin A allowed us to distinguish between the reduction of cytochrome c catalyzed by complex III and the nonenzymatic reduction of cytochrome c by the reduced quinone. The initial rate of cytochrome c reduction was used for the calculation of activity.
Measurement of cytochromec oxidase (complex IV).
The assay was performed with 7–15 μg of synaptosomal protein at 550 nm using 50 μm cytochrome c (reduced) as the donor, in an isosmotic medium (10 mm phosphate buffer, 0.3 μm sucrose, pH 6.5, 1 mg/ml BSA) after making the external mitochondrial membrane permeable with 2.5 mm lauryl maltoside. The initial rate of cytochrome c reduction was used for the calculation of activity.
Immunoprecipitation and immunoblotting.
Immunoprecipitation was performed to study phosphorylation of 18 kDa subunit of complex I, Fe-S subunit of complex III, and cytochrome oxidase IV (COX IV) subunit of complex IV phosphorylation in different experimental conditions. The total synaptosomal fraction (500 μg) was dissolved with 0.3% SDS, sonicated two times for 5 s each, and then immediately adjusted to 0.1% of the SDS concentration in “immunobuffer” consisting of 50 mm Tris-HCl, 1% Triton X-100, 1% CHAPS (3-[(3-cholamidopropyl)dimethylammonio]-1-propanesulfonate), and 0.5% NP-40, pH 7.4, and incubated for 20 min at room temperature. The immunoprecipitation was performed using protein A-Sepharose beads (Sigma-Aldrich) and anti-phospho-threonine, anti-phospho-serine, and anti-phospho-tyrosine mouse monoclonal antibodies (Sigma-Aldrich) per the manufacturer's instructions. The samples were washed twice with immunobuffer after overnight incubation of samples with protein A-Sepharose beads (Sigma-Aldrich) and anti-phospho-threonine, anti-phospho-serine, or anti-phospho-tyrosine. The resulting pellet was used for immunoblotting using anti-18 kDa subunit of complex I, anti-Fe-S subunit of complex III, or anti-COX IV subunit of complex IV antibody. To determine the levels of εPKC, γPKC, δPKC, cytochrome c, synaptophysin, and β-actin, 40 μg of protein from either synaptosomal or soluble fraction was separated using 12% PAGE. The immunoblotting was performed using anti-εPKC, anti-γPKC, anti-δPKC, anti-cytochrome c, anti-synaptophysin, and/or anti-β-actin antibodies. Immunoreactivity was detected using enhanced chemiluminescence (ECL Western blotting detection kit; GE Healthcare, Little Chalfont, Buckinghamshire, UK). Western blot images were digitized at eight-bit precision by means of a CCD-based camera (8–12 bits) (Xillix Technologies, Vancouver, British Columbia, Canada) equipped with a 55 mm Micro-Nikkor lens (Nikon, Tokyo, Japan). The camera was interfaced to an image acquisition and analysis system (MCID model M2; Imaging Research, St. Catherines, Ontario, Canada). The digitized immunoblots were subjected to densitometric analysis using MCID software.
Electron microscopy and immunogold labeling.
The synaptosomal pellets were obtained as described (see above, Isolation of hippocampal synaptosomes). For immunogold labeling pellets were fixed in 4% paraformaldehyde, 0.1% glutaraldehyde in 0.1 m phosphate buffer, pH 7.5, and washed with three times in 0.15 m phosphate buffer, pH 7.5, for 15 min each. The pellets were then dehydrated in an ascending series of ethanol to 100%. The pellets were then treated with water miscible resin LR white overnight at room temperature, as previously described for intact tissue (Jansen et al., 2001; Mungarro-Menchaca et al., 2002). Finally, pellets were embedded in LR white in gelatin capsule for 24 h at 60°C. The sections of 60 nm thickness were collected on 200 meshed nickel grids. Subsequently sections on nickel grids were incubated on a Parafilm in a drop of blocking buffer containing 1% goat serum, 0.1 m glycine, 250 mm sucrose, and 50 mm Tris acetate, pH 7.2, for 1 h at room temperature. The sections were treated with primary antibody (1:200 dilution; rabbit polyclonal antisera to εPKC) for 2 h at room temperature. After incubation with primary antibody, sections were washed by passing grids three times over 9–12 drops of washing buffer containing 250 mm sucrose, 50 mm Tris acetate, pH 7.2, and grids were kept for 10–15 min in last drop of washing buffer. The sections were incubated on top of secondary antibody (1:10 dilution; raised in goat anti-rabbit IgG) adsorbed to 10 nm gold particles for 30 min. The sections were washed with Tris-acetate buffer as above followed by washing with distilled water and fixed in 3% glutaraldehyde in PBS for 5 min. After washing with distilled water, the grids were stained with uranyl acetate (10 min) and counterstained with lead citrate (1 min) before observation. Sections were observed under Carl Zeiss (Jena, Germany) EM 10 C/CR electron microscope operating at 60 kV.
Measurement of mitochondrial membrane potential.
Mitochondrial membrane potential (Δψm) was determined using 5,5′,6,6′-tetrachloro-1,1,3,3′-tetraethylbenzimidazolyl-carbocyanine iodide (JC-1). Synaptosomes were suspended in physiological buffer (154 mm NaCl, 5.6 mm KCl, 2.3 mm CaCl2, 1.0 mm MgCl2, 3.6 mm NaHCO3, 5 mm glucose, 5 mm HEPES, pH 7.2) and were loaded with JC-1 (30 μm) for 15 min at 37°C. After sedimentation and washing, synaptosomes were resuspended in physiological buffer at a density of ∼8 mg/ml synaptosomal protein concentration. For fluorescence measurements, 5 μl aliquots were diluted in 200 μl of physiological buffer. Fluorescence intensity was determined at 37°C in a M5 fluorescence spectrophotometer (Molecular Devices, Sunnyvale, CA). At the end of the experiments, FCCP (carbonyl cyanide-p-trifluoromethoxyphenylhydrazone) (1 μm final concentration) was added as a negative control. Δψm is expressed as ratio of fluorescence at 590 nm (red; aggregated in the mitochondria) divided by fluorescence at 525 nm (green; nonaggregated in the cytosol).
Measurement of the rate of hydrogen peroxide production.
The rate of hydrogen peroxide production was measured using Amplex Red hydrogen peroxide assay kit (Invitrogen, Carlsbad, CA) per the manufacturer's instructions. In brief, H2O2 release from synaptosomes was measured in 100 μl of reaction mixture containing 50 μm Amplex Red reagent, 0.01 U of horseradish peroxidase, 145 mm NaCl, 5.7 mm sodium phosphate, 4.86 mm KCl, 0.54 mm CaCl2, 1.22 mm MgSO4, 5.5 mm glucose, pH 7.35, and 50–100 μg of synaptosomal protein at 37°C. After excitation at 545 nm, the fluorescence emission was measured at 590 nm. The fluorescence was recorded for up to 20 min. The linear rate of reaction was considered to be the rate of H2O2 production.
Induction of ischemia in synaptosomes and isolation of soluble (cytosolic) fraction.
Oxygen/glucose deprivation (OGD) (an in vitro model of ischemia) was induced by incubating synaptosomes in 50 mm HEPES, pH 7.4, 144 mm NaCl, 5 mm KCl, 1.2 mm CaCl2, 1.2 mm MgCl2, and 10 mm sucrose bubbled with 95% N2 and 5% CO2 at 30°C (Seyedi et al., 2002). At the end of 60 min of OGD, the samples were placed inside a nitrogen cell bomb and put under a pressure of 1200 psi for 7.5 min (Brown et al., 2004). The samples obtained after nitrogen compression were centrifuged at 16,000 × g for 15 min. The resulting supernatant was considered as the soluble (cytosolic) fraction and was subjected to immunoblotting analysis to determine cytochrome c levels.
RNA isolation and TaqMan gene expression assay.
Synaptosomes were isolated as described previously except isolation medium consisted of 15 U of RNase inhibitor. Total RNA was isolated using QIAGEN (Valencia, CA) miRNeasy mini kit. A total of 1–2 μg of total RNA was reverse-transcribed using High-Capacity cDNA Reverse Transcription kits (Applied Biosystems, Foster City, CA), according to the manufacturer's instructions. Real-time TaqMan PCR was performed to evaluate the transcript level of εPKC both in the synaptosomes and crude homogenate. β-Actin was used as a reference gene. The following gene-specific probe/primer pair mixtures were used from Applied Biosystems and purchased as an Assay-on-Demand kit: β-actin (Rm00667869_m1) and εPKC (Rn01769089_m1). Twenty-five microliter PCR were run using 50 ng cDNA template on a 7300 PCR Sequence Detection System (Applied Biosystems). After an initial denaturation step at 95°C for 10 min, all the samples were amplified for 55 cycles, each one consisting of denaturation at 95°C for 15 s and annealing/extension at 60°C for 1 min. A standard curve for each gene was constructed using increasing amounts of cDNA from synaptosomes and crude homogenate of each sham animal used as control (n = 3), and the amount of cDNA or RNA in the samples (IPC; n = 3) was calculated by interpolating the Ct (threshold cycle) values with the standard curve of each gene. All sample measurements were performed in triplicate.
Protein analysis.
Proteins were measured using the Bio-Rad protein assay kit based on the method of Bradford (1976). Bovine serum albumin was used as standard.
Statistical analysis.
The results are expressed as mean ± SEM. The results are presented as percentage change from sham-operated animals. Statistical significance was determined with Student's t test.
Results
Subcellular localization of εPKC after IPC
Previously, we demonstrated that IPC induces a neuroprotective state 48 h after the treatment (Perez-Pinzon et al., 1997; Raval et al., 2003; Dave et al., 2005, 2006). This neuroprotective state could also be activated by direct activation of εPKC (Raval et al., 2003). To identify the subcellular functional targets of εPKC, we fractionated hippocampal homogenates into soluble (cytosolic) and synaptosomal fractions at various time points after in vivo IPC. We found a significant but transient decrease in the relative amount of εPKC in the soluble fraction of hippocampal homogenates at 1 h after in vivo IPC (Fig. 1A). These rapid changes are in contrast to the increases in synaptosomal levels of εPKC at 24 and 48 h after IPC (Fig. 1B). These findings suggest that, after IPC, the level of εPKC is increased in synaptosomes at later reperfusion times associated with the late phase of IPC neuroprotection (24–48 h).
Figure 1.

IPC increases εPKC in synaptosomes at 24–48 h of reperfusion. Immunoblot of εPKC isozyme in soluble (A) and synaptosomal (B) fraction of hippocampus belonging to sham (n = 6) and IPC-treated (n = 6) animals at 1, 3, 24, and 48 h after sham/preconditioning. Immunoblots (typical images are shown on top of each bar) were subjected to densitometric analysis, and levels of εPKC are expressed as percentage of control (sham) animals. Results are expressed as mean ± SEM. *p < 0.05 versus control.
To further confirm our immunoblotting results, we qualitatively determined the presence of εPKC in synaptosomal fractions of hippocampus after IPC using the immunogold electron microscopy technique. We observed relatively higher staining of εPKC in synaptosomes isolated from hippocampus of preconditioned rats compared with sham-operated control (Fig. 2).
Figure 2.

Immunogold staining of εPKC in synaptosomes at 48 h of reperfusion after IPC. Electron micrographs showing synaptosomes isolated from hippocampus of sham (n = 3) and IPC-treated (n = 3) rats. A and B depict immunogold staining of εPKC in synaptosomes obtained from hippocampus of sham and IPC rat, respectively, at 48 h of reperfusion. The arrows depict immunogold/εPKC reactivity. Scale bar, 100 nm.
In the next set of experiments, we asked whether this phenomenon is specific to εPKC or other PKCs may be involved. We determined the levels of δPKC and γPKC in synaptosomes at 48 h of reperfusion after IPC. We did not observe any significant difference between the levels of either δPKC or γPKC in synaptosomal fractions of sham and IPC groups. Our results suggest that IPC promotes specifically increased levels of εPKC in the synaptosomal fraction, but not other PKCs (e.g., δPKC and γPKC).
Effect of IPC on the level of εPKC mRNA in synaptosomes
Higher levels of εPKC in synaptosomes could be attributable to three possibilities: (1) redistribution of εPKC after IPC, (2) increased presynaptic εPKC synthesis, and (3) increased stability of εPKC protein. Using quantitative real-time PCR, we measured the levels of εPKC mRNA in synaptosomes and whole homogenate relative to the levels of β-actin. We normalized εPKC levels against β-actin (Fig. 3). The ratio of εPKC to β-actin was 1.05 ± 0.02 and 1.31 ± 0.14 for hippocampal homogenate from sham (n = 3) and IPC animals (n = 3), respectively. In hippocampal synaptosomes, the ratio of εPKC to β-actin was higher by ∼63% after in vivo preconditioning (1.51 ± 0.12; n = 3; p < 0.02) compared with sham (0.92 ± 0.09; n = 3). Our results demonstrate that the ratios of mRNA levels of εPKC and β-actin were higher in synaptosomal fraction isolated from IPC animals (Fig. 3).
Figure 3.

IPC increases the levels of εPKC mRNA in synaptosomes at 48 h of reperfusion. mRNA was measured using RT-PCR in homogenate and synaptosomal fractions of hippocampus of animals belonging to sham (n = 3) or IPC (n = 3) groups. The data are expressed as a ratio of εPKC and β-actin. Results are expressed as mean ± SEM. *p < 0.02 versus sham.
Effect of εPKC activation on synaptic mitochondrial respiration after IPC
Because apoptosis is decreased in heart after εPKC activation at mitochondrial targets (Baines et al., 2003; Ogbi et al., 2004; McCarthy et al., 2005; Ogbi and Johnson, 2006), we hypothesized that, 48 h after IPC, higher levels of synaptosomal εPKC enhance mitochondrial function. In synaptosomes from sham-operated animals, activation of εPKC with the specific peptide activator tat-ψεRACK did not significantly alter mitochondrial respiration compared with carrier peptide (tat)-treated synaptosomes (Fig. 4). In hippocampal synaptosomes collected after IPC, εPKC activation with tat-ψεRACK significantly increased the rate of oxygen consumption in the presence of pyruvate plus malate (157 ± 17%) (p < 0.05), succinate plus glycerol-3-phosphate (153 ± 16%) (p < 0.05), and ascorbate plus TMPD (131 ± 21%) (p < 0.05) compared with carrier peptide (tat)-treated synaptosomes (Fig. 4). The results suggest that, because of the higher levels of synaptosomal εPKC and/or targeted redistribution of εPKC to mitochondria, the effect of εPKC activation on mitochondrial respiration is more robust in hippocampal synaptosomes isolated 48 h after IPC.
Figure 4.

Activation of εPKC increases the rate of mitochondrial respiration in synaptosomes isolated from hippocampus of ischemic preconditioned rats. Hippocampal synaptosomes were isolated at 48 h of reperfusion from sham (n = 6) or IPC-treated (n = 6) animals. This figure depicts substrate oxidation rates in hippocampal synaptosomes treated with tat or ψεRACK in both experimental groups. The results are expressed as mean ± SEM of percentage of oxygen consumption in tat-treated group. *p < 0.05, ψεRACK versus tat-treated synaptosomes.
Effect of εPKC activation on synaptic mitochondrial respiratory chain enzyme activity after IPC
Our data strongly suggest that activation of εPKC enhances mitochondrial respiration after IPC. To identify the specific enzyme targets of εPKC in the mitochondrial respiratory chain, we measured the activities of complexes I–IV of mitochondrial electron transport chain (ETC). The activity of complexes I, III, and IV were not significantly altered by εPKC activation in synaptosomes isolated from sham animals (Fig. 5). However, in synaptosomes isolated from IPC-treated animals, the activity of complexes I, III, and IV were increased 161 ± 7% (p < 0.05), 185 ± 27% (p < 0.05), and 149 ± 14% (p < 0.05) in tat-ψεRACK-treated synaptosomes when compared with tat-treated synaptosomes (Fig. 5). These results run parallel to the substrate-oxidation assays reported above (Fig. 4). Both assays report enhanced activity in complexes I, III, and IV after εPKC activation and IPC. We report here for the first time that, in addition to the enhanced activity of complex IV, activation of εPKC also results in increased activity of complex I and III in hippocampal synaptosomal mitochondria 48 h after IPC.
Figure 5.

Activation of εPKC increases the activity of mitochondrial respiratory chain complexes I, III, and IV in synaptosomes isolated from hippocampus of ischemic preconditioned rats. Hippocampal synaptosomes were isolated at 48 h of reperfusion from sham (n = 6) or IPC (n = 6)-treated animals. Complex I, II, III, and IV activities in synaptosomes treated with tat or ψεRACK in both experimental groups. The results are expressed as mean ± SEM of percentage of oxygen consumption in tat-treated group. *p < 0.05, ψεRACK versus tat-treated synaptosomes.
To rule out the possible effect of synaptogenesis and/or mitogenesis after IPC, we compared our results that we obtained from tat-ψεRACK-treated synaptosomes with tat carrier peptide-treated synaptosomes. These synaptosomes were obtained in parallel batches; thus, the number of mitochondria was identical for each paired treatment.
Effect of εPKC activation on phosphorylation of hippocampal mitochondrial ETC proteins
It has been reported that the activity of the mitochondrial respiratory chain enzymes is modulated by phosphorylation of their component subunits (Papa et al., 1996, 2002; Lee et al., 2002; Raha et al., 2002; Ogbi et al., 2004; He and Lemasters, 2005; Ogbi and Johnson, 2006). Thus, we asked whether εPKC activation altered the phosphorylation state of enzymes involved in ETC activities of each of the complexes. We measured the levels of proteins phosphorylated at serine, threonine, and tyrosine sites in three enzyme subunits representing complexes I, III, and IV. Phosphorylation of these proteins is known to modulate respective electron transport chain complex activity (Papa et al., 1996, 2002; Raha et al., 2002; Ogbi et al., 2004; He and Lemasters, 2005; Ogbi and Johnson, 2006). We selected the 18 kDa subunit of complex I, Fe-S protein of complex III, and COX IV of complex IV. The level of 18 kDa protein phosphorylation was very low, requiring the use of femto-ECL solution with overnight film exposure. Serine and tyrosine phosphorylation of 18 kDa protein of complex I was higher by 302 ± 20% (p < 0.05) and 376 ± 73% (p < 0.05) after activation of εPKC in synaptosomes from preconditioned animals versus sham-operated animals (Fig. 6A). Threonine phosphorylation of 18 kDa protein was not altered by IPC. After εPKC activation, the complex III Fe-S protein serine phosphorylation decreased to 51 ± 14% (p < 0.05) (Fig. 6B). Activation of εPKC increased COX IV phosphorylation at serine (197 ± 47%; p < 0.05) and threonine (236 ± 45%; p < 0.05) amino acids in hippocampal mitochondria from preconditioned animals compared with sham-operated animals (Fig. 6C). In addition to the previously reported COX IV phosphorylation in heart (Ogbi et al., 2004; Ogbi and Johnson, 2006), we show in the present study that activation of εPKC results in increased phosphorylation of 18 kDa and decreased phosphorylation Fe-S proteins in synaptosomal mitochondria.
Figure 6.

Activation of εPKC increases phosphorylation of hippocampal mitochondrial electron transport chain proteins in rats subjected to ischemic preconditioning. Hippocampal synaptosomes were isolated at 48 h of reperfusion from sham (n = 6) or IPC-treated (n = 6) animals. The extent of 18 kDa subunit of complex I (A), Fe-S subunit of complex III (B), and COX IV subunit of complex IV (C) phosphorylation was measured in synaptosomes treated with tat or ψεRACK in both experimental groups by immunoprecipitation using anti-phospho-serine, anti-phospho-threonine, and anti-phospho-tyrosine antibodies followed by Western blotting using anti-18 kDa complex I, anti Fe-S subunit of complex III, and anti-COX IV subunit of complex IV antibody, respectively. The results are expressed as mean ± SEM of percentage of phosphorylation in ψεRACK-treated synaptosomes isolated from hippocampus of sham-treated animals. *p < 0.05, IPC versus sham.
Effect of εPKC activation on mitochondrial membrane potential (Δψm) and respiratory control index
The electrochemical potential across the mitochondrial membrane is critical for ATP production and cell viability. We tested whether activation of εPKC also affects the Δψm of synaptosomal mitochondria. Synaptosomes were isolated from the hippocampus of sham and preconditioned animals at 48 h of reperfusion. Δψm was measured using JC-1 as a function of εPKC activation. The Δψm was not significantly different in tat-treated hippocampal synaptosomes from sham and IPC animals, indicating that IPC alone does not alter Δψm (Fig. 7A). Activation of εPKC significantly hyperpolarized the Δψm from IPC-treated rats compared with sham-operated rats (20 ± 8%; p < 0.05) (Fig. 7A). Our results demonstrate that activation of εPKC in hippocampal synaptosomes from preconditioned animals leads to significant mitochondrial hyperpolarization.
Figure 7.
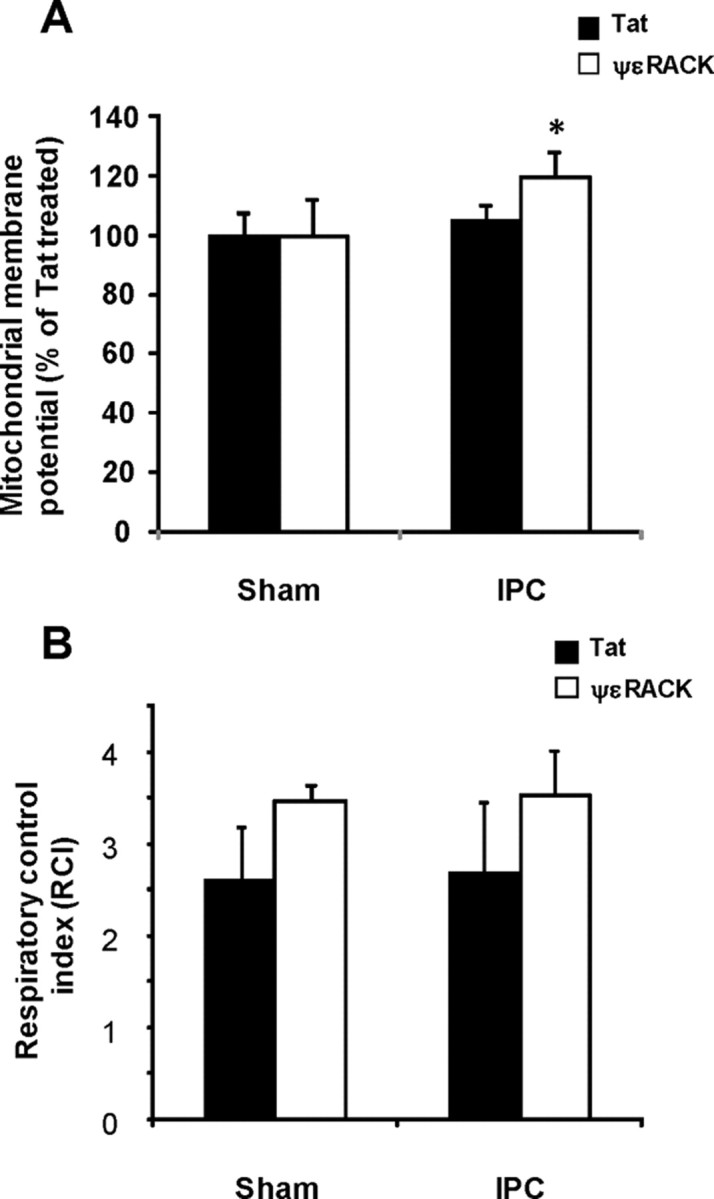
Effect of εPKC activation on mitochondrial membrane potential and respiratory control index in hippocampal synaptosomes isolated from ischemic preconditioned rats. Hippocampal synaptosomes were isolated at 48 h of reperfusion from sham (n = 6) or IPC-treated (n = 6) animals. A, The respiratory control index was measured as described in Materials and Methods in synaptosomes treated with tat or ψεRACK in both experimental groups. B, The mitochondrial membrane potential was measured using JC-1 in synaptosomes treated with tat or ψεRACK in both experimental groups. The synaptosomes were excited at 488 nm and the emissions at 520 and 590 nm were recorded. The mean ± SEM of ratio of fluorescence at 590 nm/fluorescence at 520 nm are presented in the figure. *p < 0.05, ψεRACK versus tat-treated synaptosomes.
In a parallel study, we also determined RCI in digitonin permeabilized synaptosomes isolated from the hippocampus of sham and preconditioned animals at 48 h of reperfusion. The RCI was not significantly different among all four experimental groups studied (Fig. 7B). However, a trend toward increased RCI was observed in tat-ψεRACK-treated synaptosomes compared with respective tat-treated synaptosomes. The results of RCI values suggest that there was a trend of higher coupling in tat-ψεRACK-treated synaptosomes compared with respective tat-treated synaptosomes.
Effect of εPKC activation on hydrogen peroxide production
Activation of εPKC in synaptosomes from ischemia-preconditioned rat hippocampus results in both increased rate of respiration (Fig. 4) and increased complex I, III, and IV activities (Fig. 5). To determine the effect of increased electron transport chain activity on free radical release, next we measured the rate of hydrogen peroxide production in our experimental conditions using the Amplex Red fluorometric assay and a fluorescence plate reader (Fig. 8). The representative spectrofluorometer traces for measurements of H2O2 production are presented in Figure 8A. We observed that activation of εPKC in synaptosomes from hippocampus of sham-operated rats resulted in minor but significant decrease (16% of TAT-treated synaptosomes; n = 4; p < 0.05) in the rate of H2O2 production compared with Tat-treated synaptosomes (Fig. 8B). Similarly, in synaptosomes from hippocampus of ischemic preconditioned rats resulted in a decreased rate of H2O2 production (28%; p < 0.05) (Fig. 8B). However, difference in the rate of H2O2 production after εPKC activation with tat-ψεRACK in sham or IPC groups was not significantly different. These results indicate that increased electron transport chain activity after εPKC activation did not increase the rate of H2O2 production, but rather decreased it. This effect was independent of IPC-induced changes in εPKC levels because we did not observe any statistically significant difference in the rate of H2O2 production between tat-ψεRACK-treated synaptosomes isolated from sham or IPC animals.
Figure 8.
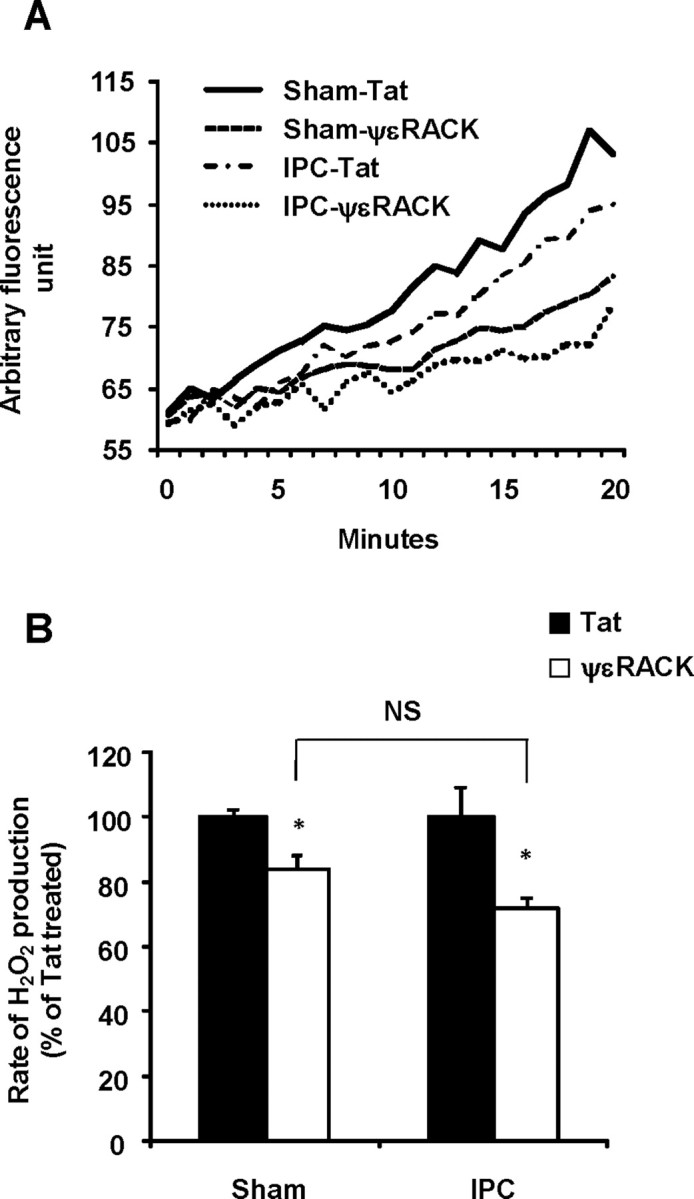
Activation of εPKC decreases hydrogen peroxide production in hippocampal synaptosomes isolated from ischemic preconditioned rats. Hippocampal synaptosomes were isolated at 48 h of reperfusion from sham (n = 4) or IPC-treated (n = 4) animals. The rate of hydrogen peroxide production in synaptosomes was measured using Amplex Red in synaptosomes treated with tat or ψεRACK in both experimental groups. A, The representative spectrofluorometer traces for measurements of H2O2 production. B, The percentage mean ± SEM of the rate of H2O2 production is presented in the figure. *p < 0.05, ψεRACK versus tat-treated synaptosomes.
Effect of increased εPKC levels on cytochrome c release after in vitro oxygen glucose deprivation
It is known that a transient increase in [Ca2+]i activates phospholipase C-induced release of 1,4,5-inositol triphosphate and DAG, which can stimulate Ca2+-independent isozymes of PKC, such as γPKC and εPKC (Raval et al., 2003; Lange-Asschenfeldt et al., 2004). It is expected that during lethal ischemia, increased intracellular calcium results in activation of εPKC. To determine whether activation of εPKC during lethal ischemia had any effect on ischemic outcome, we measured cytochrome c release from mitochondria in synaptosomes subjected to 60 min of oxygen glucose deprivation in presence of tat carrier peptide or tat-εV1-2 (εPKC inhibitor) (Seyedi et al., 2002) (Fig. 9). In synaptosomes isolated from hippocampus of sham-operated rats, the release of cytochrome c after 60 min of OGD was ∼57% (p < 0.05) higher in the tat-εV1-2-treated group compared with the tat-treated group. However, in the case of synaptosomes isolated from hippocampus of rats subjected to IPC, the release of cytochrome c after 60 min of OGD was ∼24% (p < 0.05) higher in the tat-εV1-2-treated group compared with the tat-treated group. The effect of εPKC inhibition was 27% (p < 0.05) higher in synaptosomes isolated from hippocampus of sham-operated rats compared with ischemic preconditioned rats.
Figure 9.

Activation of εPKC decreases the release of cytochrome c in hippocampal synaptosomes isolated from ischemic preconditioned rats when subjected to in vitro ischemia. Hippocampal synaptosomes were isolated at 48 h of reperfusion from sham (n = 4) or IPC-treated (n = 4) animals. The release of cytochrome c into cytosol was measured by immunoblotting in synaptosomes subjected to 60 min of oxygen/glucose deprivation in presence of tat carrier peptide or tat-εV1-2 (εPKC inhibitor). Immunoblots (typical images are shown at top) were subjected to densitometric analysis, and the ratio of levels of cytochrome c/β-actin are expressed as percentage of control (sham) animals. Results are expressed as mean ± SEM. *p < 0.05 versus control.
Discussion
εPKC is a key protective pathway after IPC and plays an important role in protection against lethal ischemia in brain (Di-Capua et al., 2003; Raval et al., 2003; Lange-Asschenfeldt et al., 2004; Bright and Mochly-Rosen, 2005; Chou and Messing, 2005; Li et al., 2005; Perez-Pinzon et al., 2005; Long et al., 2006). In the brain, IPC leads to activation of εPKC in hippocampus, the most vulnerable part of brain to global cerebral ischemia (Hatakeyama et al., 1988). Blocking of εPKC activation after IPC resulted in loss of neuroprotection (Raval et al., 2003). Based on these results and previous studies from our group lead us to suggest that εPKC translocation after IPC is an essential step in the observed improved mitochondrial respiratory capacities presented in the current study. First, we know that εPKC translocated early to mitochondria after IPC (Raval et al., 2007). And, second, IPC was able to improve mitochondrial functions after cerebral ischemia (Dave et al., 2001).
εPKC targets synapses
Mitochondria are a major target of mediators of IPC, including εPKC. In heart, εPKC translocates to mitochondria and exerts anti-apoptotic effects. The results described here indicate that after IPC, εPKC levels are increased in hippocampal synaptosomes during the late reperfusion phase. Our results regarding the levels of εPKC in synaptosomes are normalized to the level of synaptophysin to diminish the potential impact of a change in the number of synapses. Our conclusion that εPKC translocated to synaptosomes after IPC was based on immunoblotting data. These demonstrate that IPC redistributes εPKC to crucial neuronal locations susceptible to ischemia such as synaptic mitochondria. However, additional corroboration of this phenomenon remains to be confirmed in intact neurons and synapses. Widespread expression of εPKC in both neurons and glia renders these experiments technically challenging.
The mechanism by which εPKC translocates to synaptosomes after IPC remains undefined. Redistribution of εPKC in the late phase of IPC has not been reported in any other organ and may be a unique for the brain. Increased levels of εPKC mRNA in synaptosomes suggests that increased protein levels may arise from de novo protein synthesis in synaptosomes after IPC. This finding also suggests increased εPKC mRNA stability in synaptosomes as the levels of εPKC mRNA was not increased significantly in homogenate. How IPC increases εPKC mRNA stability in synaptosomes remains to be investigated. A clue to this question arises from previous studies that demonstrated synaptic activity dependent increase in specific mRNA in synaptodendritic region (Havik et al., 2003; Shin et al., 2004). Similarly we conjecture that increased levels of εPKC mRNA is part of synaptic plasticity induced by the IPC stimulus. Future studies will address this question.
Activation of εPKC during lethal ischemic insults
In vivo, widespread depolarization and loss of ionic gradients during ischemia results in elevated calcium in the presynaptic terminal. We previously showed that influx of calcium may activate εPKC indirectly via diacylglycerol (DAG) (Raval et al., 2003; Lange-Asschenfeldt et al., 2004). After activation, εPKC phosphorylates its target proteins resulting in either direct modulation of its primary functional targets or initiating the εPKC signaling pathway with downstream targets.
Functional impact of εPKC activation
The physiological role of εPKC in presynaptic terminals is diverse. For example, presynaptic activation of metabotropic glutamate receptors is known to activate Ca2+-independent εPKC (Pastorino et al., 2000). Presynaptic activation of εPKC may be responsible for the enhanced availability of synaptic vesicles for exocytosis during intense bouts of presynaptic activity (Prekeris et al., 1996). Furthermore, activation of εPKC to synaptic-vesicle membranes results in phosphorylation and increased activity of GAD-65 (glutamic acid decarboxylase 65) (Wei et al., 2004). In summary, εPKC has numerous synaptic targets, both excitatory and inhibitory. The specific impact of enhanced εPKC levels and activity in the presynaptic terminals after IPC likely depends on the type of synapse and thus is an important target for future research.
The impact of εPKC activation on presynaptic mitochondria is not known. After εPKC activation, εPKC protein is found in mitochondria. Low levels of εPKC are also present in mitochondria under control conditions (Ohnuma et al., 2002; Kilts et al., 2005; Costa et al., 2006). Changes in mitochondrial physiology after εPKC activation may affect neurotransmitter release by affecting an energy-dependent Ca2+ buffering capacity (Siegal et al., 1999; Augustine, 2001). Thus, the increased activity of mitochondrial complexes elicited by εPKC activation after IPC likely improves calcium buffering by mitochondria in the synaptic terminal, potentially resulting in less glutamate release and thus amelioration of excitotoxicity after ischemia.
Interaction of εPKC with mitochondrial targets
The direct interaction of εPKC and mitochondrial membrane proteins is not known. In general, once isozymes of PKC are activated they translocate to target membranes and bind to the isozyme-specific receptor for activated C kinase: an adapter protein that brings PKC closer to its target protein (Schechtman and Mochly-Rosen, 2001). It is known that there are certain mitochondrial proteins that translocate to mitochondria without a mitochondrial targeting sequence. These proteins interact and bind to binding sites present on either outer or inner mitochondrial membrane (Herrmann and Hell, 2005). It is possible that, in a similar manner, εPKC interacts and phosphorylates its target protein in inner mitochondrial membrane via binding to binding sites/adapter proteins on the mitochondrial inner membrane. Direct physical interaction between εPKC and mitochondrial proteins has been demonstrated recently (Jaburek et al., 2006).
To examine the effect of εPKC activation on activity of individual respiratory chain complexes, we used enzyme-specific assays. These assays demonstrated that the activity of complexes I, III, and IV were higher after IPC and subsequent εPKC activation. Our results are consistent with a previous study in heart, which demonstrated complex IV to be a target of εPKC (Ogbi et al., 2004; Ogbi and Johnson, 2006). In contrast to our current results, complex I was previously shown to be inhibited 4 h after εPKC activation in renal proximal tubular cells (Nowak et al., 2004). A major difference between our experimental approaches is that we chose to examine the effect of εPKC at 15 min because a previous study demonstrated that maximum COX IV phosphorylation occurs between 10 and 30 min after εPKC activation (Ogbi et al., 2004). In addition, this difference may also indicate significant differences between renal proximal tubular cell mitochondria and synaptic mitochondria.
Because εPKC is a serine/threonine kinase (Jaken, 1996), the effect of εPKC activation on 18 kDa subunit complex I may be either or both direct and indirect (i.e., via other kinases), because we observed increases at both serine and tyrosine sites. At complex III, we found decreased phosphorylation of the Fe-S subunit. This likely reflects the activation of phosphatases downstream of εPKC. We hypothesize that lower phosphorylation may be responsible for higher complex III activity. Finally, we observed higher phosphorylation of COX IV consistent with previous studies of εPKC mitochondrial targets (Ogbi et al., 2004; Ogbi and Johnson, 2006). To our knowledge, this is the first demonstration of alterations in the phosphorylation status of complexes I and III after εPKC activation. Here, we demonstrate that activation of the εPKC signaling pathway after IPC leads to phosphorylation and dephosphorylation of mitochondrial electron transport chain enzymes and subsequent enhancement of mitochondrial respiration in hippocampal synapses.
εPKC activation leads to increased mitochondrial ETC efficiency
The net effect of εPKC action after IPC may indeed be a hyperpolarized Δψm. This increased hyperpolarization may protect synaptic mitochondria by diminishing depolarization during ischemia (McCarthy et al., 2005). Hyperpolarized mitochondria will have higher capacity of ATP production (Boss et al., 2000). A previous study demonstrated that higher rate of mitochondrial respiration after activation of εPKC will lead to a greater ATP producing capacity in response to anoxia–reoxygenation in heart (McCarthy et al., 2005). We hypothesize that higher rate of respiration and activity of mitochondrial ETC complexes after εPKC activation results in higher ATP production in synaptosomal mitochondria after lethal ischemia, which in turn enhances energy-dependent recovery of ion gradients (e.g., the Na+/K+ATPase).
In tandem with the loss of ATP, ischemia causes the release of free radicals; both events are neurodegenerative. A previous study demonstrated that increased complex IV activity leads to lower mitochondrial free radical generation (Campian et al., 2004). Previous work also demonstrated that, on activation, εPKC translocates to mitochondria and interacts with components of MPTP resulting in inhibition of its opening (Baines et al., 2003). It is likely that after IPC-induced redistribution and subsequent activation during lethal ischemia, εPKC will decrease free radical production and cytochrome c release with decreased probability of opening the MPTP in synaptic mitochondria.
Paradoxically, our results showed that inhibition of εPKC appeared to have a greater effect on cytochrome c release in synaptosomes from sham-operated animals compared with ischemic preconditioned animals. This suggests that other antiapoptotic signaling pathways are also activated by IPC, which renders mitochondria more resistant to cytochrome c release (Duan et al., 1999; Zhan et al., 2001; Liu et al., 2002). This further corroborates the complexity of neuroprotective mechanisms induced by IPC.
Conclusions
The results of the present study are summarized in Figure 10. In conclusion, our results demonstrate that εPKC concentrated in hippocampal synapses after IPC. Subsequent activation of εPKC improves mitochondrial function in terms of rate of respiration and Δψm consistent with the prevention of mitochondrial dysfunction after lethal ischemia. Our results confirm the important role of εPKC not only during the induction of IPC but at the time of ischemia. Our results also point out the potential activation of other signaling pathways, possibly independent of εPKC.
Figure 10.

Schematic diagram representing action of εPKC on synaptosomal mitochondria after IPC. Our results suggest that IPC results in the redistribution of εPKC to crucial neuroprotective targets such as synaptic mitochondria. The levels of εPKC in synaptosomes isolated from hippocampus of ischemic preconditioned animals are higher compared with sham-operated animals at 48 h of reperfusion. We observed that activation of εPKC leads to increased rate of mitochondrial electron transport chain activity by modulating phosphorylation status of mitochondrial electron transport chain complexes. We also observed that activation of εPKC results in lower reactive oxygen species (H2O2) production and a moderate increase in mitochondrial membrane potential. Synaptosomal mitochondria are less susceptible to in vitro ischemia when εPKC activation was induced.
Footnotes
This work was supported by National Institutes of Health Grants NS34773, NS05820, NS045676, and NS054147.
References
- Augustine GJ. How does calcium trigger neurotransmitter release? Curr Opin Neurobiol. 2001;11:320–326. doi: 10.1016/s0959-4388(00)00214-2. [DOI] [PubMed] [Google Scholar]
- Baines CP, Zhang J, Wang GW, Zheng YT, Xiu JX, Cardwell EM, Bolli R, Ping P. Mitochondrial PKCepsilon and MAPK form signaling modules in the murine heart: enhanced mitochondrial PKCepsilon-MAPK interactions and differential MAPK activation in PKCepsilon-induced cardioprotection. Circ Res. 2002;90:390–397. doi: 10.1161/01.res.0000012702.90501.8d. [DOI] [PubMed] [Google Scholar]
- Baines CP, Song CX, Zheng YT, Wang GW, Zhang J, Wang OL, Guo Y, Bolli R, Cardwell EM, Ping P. Protein kinase Cepsilon interacts with and inhibits the permeability transition pore in cardiac mitochondria. Circ Res. 2003;92:873–880. doi: 10.1161/01.RES.0000069215.36389.8D. [DOI] [PMC free article] [PubMed] [Google Scholar]
- Barrientos A, Kenyon L, Moraes CT. Human xenomitochondrial cybrids. Cellular models of mitochondrial complex I deficiency. J Biol Chem. 1998;273:14210–14217. doi: 10.1074/jbc.273.23.14210. [DOI] [PubMed] [Google Scholar]
- Bolli R. The late phase of preconditioning. Circ Res. 2000;87:972–983. doi: 10.1161/01.res.87.11.972. [DOI] [PubMed] [Google Scholar]
- Bolli R, Dawn B, Tang XL, Qiu Y, Ping P, Xuan YT, Jones WK, Takano H, Guo Y, Zhang J. The nitric oxide hypothesis of late preconditioning. Basic Res Cardiol. 1998;93:325–338. doi: 10.1007/s003950050101. [DOI] [PMC free article] [PubMed] [Google Scholar]
- Boss O, Hagen T, Lowell BB. Uncoupling proteins 2 and 3: potential regulators of mitochondrial energy metabolism. Diabetes. 2000;49:143–156. doi: 10.2337/diabetes.49.2.143. [DOI] [PubMed] [Google Scholar]
- Bradford MM. A rapid and sensitive method for the quantitation of microgram quantities of protein utilizing the principle of protein-dye binding. Anal Biochem. 1976;72:248–254. doi: 10.1006/abio.1976.9999. [DOI] [PubMed] [Google Scholar]
- Bright R, Mochly-Rosen D. The role of protein kinase C in cerebral ischemic and reperfusion injury. Stroke. 2005;36:2781–2790. doi: 10.1161/01.STR.0000189996.71237.f7. [DOI] [PubMed] [Google Scholar]
- Brown MR, Sullivan PG, Dorenbos KA, Modafferi EA, Geddes JW, Steward O. Nitrogen disruption of synaptoneurosomes: an alternative method to isolate brain mitochondria. J Neurosci Methods. 2004;137:299–303. doi: 10.1016/j.jneumeth.2004.02.028. [DOI] [PubMed] [Google Scholar]
- Campian JL, Qian M, Gao X, Eaton JW. Oxygen tolerance and coupling of mitochondrial electron transport. J Biol Chem. 2004;279:46580–46587. doi: 10.1074/jbc.M406685200. [DOI] [PubMed] [Google Scholar]
- Chou WH, Messing RO. Protein kinase C isozymes in stroke. Trends Cardiovasc Med. 2005;15:47–51. doi: 10.1016/j.tcm.2005.01.003. [DOI] [PubMed] [Google Scholar]
- Costa AD, Jakob R, Costa CL, Andrukhiv K, West IC, Garlid KD. The mechanism by which the mitochondrial ATP-sensitive K+ channel opening and H2O2 inhibit the mitochondrial permeability transition. J Biol Chem. 2006;281:20801–20808. doi: 10.1074/jbc.M600959200. [DOI] [PubMed] [Google Scholar]
- Dave KR, Saul I, Busto R, Ginsberg MD, Sick TJ, Perez-Pinzon MA. Ischemic preconditioning preserves mitochondrial function after global cerebral ischemia in rat hippocampus. J Cereb Blood Flow Metab. 2001;21:1401–1410. doi: 10.1097/00004647-200112000-00004. [DOI] [PubMed] [Google Scholar]
- Dave KR, Lange-Asschenfeldt C, Raval AP, Prado R, Busto R, Saul I, Perez-Pinzon MA. Ischemic preconditioning ameliorates excitotoxicity by shifting glutamate/gamma-aminobutyric acid release and biosynthesis. J Neurosci Res. 2005;82:665–673. doi: 10.1002/jnr.20674. [DOI] [PubMed] [Google Scholar]
- Dave KR, Saul I, Prado R, Busto R, Perez-Pinzon MA. Remote organ ischemic preconditioning protect brain from ischemic damage following asphyxial cardiac arrest. Neurosci Lett. 2006;404:170–175. doi: 10.1016/j.neulet.2006.05.037. [DOI] [PubMed] [Google Scholar]
- Di-Capua N, Sperling O, Zoref-Shani E. Protein kinase C-epsilon is involved in the adenosine-activated signal transduction pathway conferring protection against ischemia-reperfusion injury in primary rat neuronal cultures. J Neurochem. 2003;84:409–412. doi: 10.1046/j.1471-4159.2003.01563.x. [DOI] [PubMed] [Google Scholar]
- Dietrich WD, Busto R, Alonso O, Globus MY, Ginsberg MD. Intraischemic but not postischemic brain hypothermia protects chronically following global forebrain ischemia in rats. J Cereb Blood Flow Metab. 1993;13:541–549. doi: 10.1038/jcbfm.1993.71. [DOI] [PubMed] [Google Scholar]
- Dirnagl U, Simon RP, Hallenbeck JM. Ischemic tolerance and endogenous neuroprotection. Trends Neurosci. 2003;26:248–254. doi: 10.1016/S0166-2236(03)00071-7. [DOI] [PubMed] [Google Scholar]
- Dorn GW, II, Souroujon MC, Liron T, Chen CH, Gray MO, Zhou HZ, Csukai M, Wu G, Lorenz JN, Mochly-Rosen D. Sustained in vivo cardiac protection by a rationally designed peptide that causes epsilon protein kinase C translocation. Proc Natl Acad Sci USA. 1999;96:12798–12803. doi: 10.1073/pnas.96.22.12798. [DOI] [PMC free article] [PubMed] [Google Scholar]
- Duan C, Yan F, Song X, Lu GW. Changes of superoxide dismutase, glutathione perioxidase and lipid peroxides in the brain of mice preconditioned by hypoxia. Biol Signals Recept. 1999;8:256–260. doi: 10.1159/000014595. [DOI] [PubMed] [Google Scholar]
- Dunkley PR, Heath JW, Harrison SM, Jarvie PE, Glenfield PJ, Rostas JA. A rapid Percoll gradient procedure for isolation of synaptosomes directly from an S1 fraction: homogeneity and morphology of subcellular fractions. Brain Res. 1988;441:59–71. doi: 10.1016/0006-8993(88)91383-2. [DOI] [PubMed] [Google Scholar]
- Gidday JM. Cerebral preconditioning and ischaemic tolerance. Nat Rev Neurosci. 2006;7:437–448. doi: 10.1038/nrn1927. [DOI] [PubMed] [Google Scholar]
- Greco S, Storelli C, Marsigliante S. Protein kinase C (PKC)-delta/-epsilon mediate the PKC/Akt-dependent phosphorylation of extracellular signal-regulated kinases 1 and 2 in MCF-7 cells stimulated by bradykinin. J Endocrinol. 2006;188:79–89. doi: 10.1677/joe.1.06433. [DOI] [PubMed] [Google Scholar]
- Hatakeyama T, Matsumoto M, Brengman JM, Yanagihara T. Immunohistochemical investigation of ischemic and postischemic damage after bilateral carotid occlusion in gerbils. Stroke. 1988;19:1526–1534. doi: 10.1161/01.str.19.12.1526. [DOI] [PubMed] [Google Scholar]
- Havik B, Rokke H, Bardsen K, Davanger S, Bramham CR. Bursts of high-frequency stimulation trigger rapid delivery of pre-existing alpha-CaMKII mRNA to synapses: a mechanism in dendritic protein synthesis during long-term potentiation in adult awake rats. Eur J Neurosci. 2003;17:2679–2689. doi: 10.1046/j.1460-9568.2003.02712.x. [DOI] [PubMed] [Google Scholar]
- He L, Lemasters JJ. Dephosphorylation of the Rieske iron-sulfur protein after induction of the mitochondrial permeability transition. Biochem Biophys Res Commun. 2005;334:829–837. doi: 10.1016/j.bbrc.2005.06.170. [DOI] [PubMed] [Google Scholar]
- Herrmann JM, Hell K. Chopped, trapped or tacked—protein translocation into the IMS of mitochondria. Trends Biochem Sci. 2005;30:205–211. doi: 10.1016/j.tibs.2005.02.005. [DOI] [PubMed] [Google Scholar]
- Hofhaus G, Shakeley RM, Attardi G. Use of polarography to detect respiration defects in cell cultures. Methods Enzymol. 1996;264:476–483. doi: 10.1016/s0076-6879(96)64043-9. [DOI] [PubMed] [Google Scholar]
- Jaburek M, Costa AD, Burton JR, Costa CL, Garlid KD. Mitochondrial PKC epsilon and mitochondrial ATP-sensitive K+ channel copurify and coreconstitute to form a functioning signaling module in proteoliposomes. Circ Res. 2006;99:878–883. doi: 10.1161/01.RES.0000245106.80628.d3. [DOI] [PubMed] [Google Scholar]
- Jaken S. Protein kinase C isozymes and substrates. Curr Opin Cell Biol. 1996;8:168–173. doi: 10.1016/s0955-0674(96)80062-7. [DOI] [PubMed] [Google Scholar]
- Jansen AP, Dreckschmidt NE, Verwiebe EG, Wheeler DL, Oberley TD, Verma AK. Relation of the induction of epidermal ornithine decarboxylase and hyperplasia to the different skin tumor-promotion susceptibilities of protein kinase C alpha, -delta and -epsilon transgenic mice. Int J Cancer. 2001;93:635–643. doi: 10.1002/ijc.1395. [DOI] [PubMed] [Google Scholar]
- Kapinya KJ. Ischemic tolerance in the brain. Acta Physiol Hung. 2005;92:67–92. doi: 10.1556/APhysiol.92.2005.1.9. [DOI] [PubMed] [Google Scholar]
- Kilts JD, Grocott HP, Kwatra MM. G alpha(q)-coupled receptors in human atrium function through protein kinase C epsilon and delta. J Mol Cell Cardiol. 2005;38:267–276. doi: 10.1016/j.yjmcc.2004.11.011. [DOI] [PubMed] [Google Scholar]
- Kim E, Raval AP, Defazio RA, Perez-Pinzon MA. Ischemic preconditioning via epsilon protein kinase C activation requires cyclooxygenase-2 activation in vitro. Neuroscience. 2007;145:931–941. doi: 10.1016/j.neuroscience.2006.12.063. [DOI] [PMC free article] [PubMed] [Google Scholar]
- Kirino T. Ischemic tolerance. J Cereb Blood Flow Metab. 2002;22:1283–1296. doi: 10.1097/01.WCB.0000040942.89393.88. [DOI] [PubMed] [Google Scholar]
- Lange-Asschenfeldt C, Raval AP, Dave KR, Mochly-Rosen D, Sick TJ, Perez-Pinzon MA. Epsilon protein kinase C mediated ischemic tolerance requires activation of the extracellular regulated kinase pathway in the organotypic hippocampal slice. J Cereb Blood Flow Metab. 2004;24:636–645. doi: 10.1097/01.WCB.0000121235.42748.BF. [DOI] [PubMed] [Google Scholar]
- Lee I, Bender E, Kadenbach B. Control of mitochondrial membrane potential and ROS formation by reversible phosphorylation of cytochrome c oxidase. Mol Cell Biochem. 2002;234–235:63–70. [PubMed] [Google Scholar]
- Li J, Niu C, Han S, Zu P, Li H, Xu Q, Fang L. Identification of protein kinase C isoforms involved in cerebral hypoxic preconditioning of mice. Brain Res. 2005;1060:62–72. doi: 10.1016/j.brainres.2005.08.047. [DOI] [PubMed] [Google Scholar]
- Liu D, Lu C, Wan R, Auyeung WW, Mattson MP. Activation of mitochondrial ATP-dependent potassium channels protects neurons against ischemia-induced death by a mechanism involving suppression of Bax translocation and cytochrome c release. J Cereb Blood Flow Metab. 2002;22:431–443. doi: 10.1097/00004647-200204000-00007. [DOI] [PubMed] [Google Scholar]
- Long C, Gao Y, Gao G, Han S, Zu P, Fang L, Li J. Decreased phosphorylation and protein expression of ERK1/2 in the brain of hypoxic preconditioned mice. Neurosci Lett. 2006;397:307–312. doi: 10.1016/j.neulet.2005.12.045. [DOI] [PubMed] [Google Scholar]
- Mackay K, Mochly-Rosen D. Arachidonic acid protects neonatal rat cardiac myocytes from ischaemic injury through epsilon protein kinase C. Cardiovasc Res. 2001;50:65–74. doi: 10.1016/s0008-6363(00)00322-9. [DOI] [PubMed] [Google Scholar]
- McCarthy J, McLeod CJ, Minners J, Essop MF, Ping P, Sack MN. PKCepsilon activation augments cardiac mitochondrial respiratory post-anoxic reserve—a putative mechanism in PKCepsilon cardioprotection. J Mol Cell Cardiol. 2005;38:697–700. doi: 10.1016/j.yjmcc.2005.02.010. [DOI] [PubMed] [Google Scholar]
- Mungarro-Menchaca X, Ferrera P, Moran J, Arias C. beta-Amyloid peptide induces ultrastructural changes in synaptosomes and potentiates mitochondrial dysfunction in the presence of ryanodine. J Neurosci Res. 2002;68:89–96. doi: 10.1002/jnr.10193. [DOI] [PubMed] [Google Scholar]
- Nicholls DG. Bioenergetics and transmitter release in the isolated nerve terminal. Neurochem Res. 2003;28:1433–1441. doi: 10.1023/a:1025653805029. [DOI] [PubMed] [Google Scholar]
- Nowak G, Bakajsova D, Clifton GL. Protein kinase C-epsilon modulates mitochondrial function and active Na+ transport after oxidant injury in renal cells. Am J Physiol. 2004;286:F307–F316. doi: 10.1152/ajprenal.00275.2003. [DOI] [PubMed] [Google Scholar]
- Ogbi M, Johnson JA. Protein kinase Cepsilon interacts with cytochrome c oxidase subunit IV and enhances cytochrome c oxidase activity in neonatal cardiac myocyte preconditioning. Biochem J. 2006;393:191–199. doi: 10.1042/BJ20050757. [DOI] [PMC free article] [PubMed] [Google Scholar]
- Ogbi M, Chew CS, Pohl J, Stuchlik O, Ogbi S, Johnson JA. Cytochrome c oxidase subunit IV as a marker of protein kinase Cepsilon function in neonatal cardiac myocytes: implications for cytochrome c oxidase activity. Biochem J. 2004;382:923–932. doi: 10.1042/BJ20040468. [DOI] [PMC free article] [PubMed] [Google Scholar]
- Ohnuma Y, Miura T, Miki T, Tanno M, Kuno A, Tsuchida A, Shimamoto K. Opening of mitochondrial K(ATP) channel occurs downstream of PKC-epsilon activation in the mechanism of preconditioning. Am J Physiol. 2002;283:H440–H447. doi: 10.1152/ajpheart.00434.2001. [DOI] [PubMed] [Google Scholar]
- Papa S, Sardanelli AM, Cocco T, Speranza F, Scacco SC, Technikova-Dobrova Z. The nuclear-encoded 18 kDa (IP) AQDQ subunit of bovine heart complex I is phosphorylated by the mitochondrial cAMP-dependent protein kinase. FEBS Lett. 1996;379:299–301. doi: 10.1016/0014-5793(95)01532-9. [DOI] [PubMed] [Google Scholar]
- Papa S, Sardanelli AM, Scacco S, Petruzzella V, Technikova-Dobrova Z, Vergari R, Signorile A. The NADH: ubiquinone oxidoreductase (complex I) of the mammalian respiratory chain and the cAMP cascade. J Bioenerg Biomembr. 2002;34:1–10. doi: 10.1023/a:1013863018115. [DOI] [PubMed] [Google Scholar]
- Pastorino L, Colciaghi F, Gardoni F, Albani-Torregrossa S, Pellegrini-Giampietro DE, Moroni F, De Graan PN, Cattabeni F, Di Luca M. (+)-MCPG induces PKCepsilon translocation in cortical synaptosomes through a PLD-coupled mGluR. Eur J Neurosci. 2000;12:1310–1318. doi: 10.1046/j.1460-9568.2000.00023.x. [DOI] [PubMed] [Google Scholar]
- Perez-Pinzon MA, Xu GP, Dietrich WD, Rosenthal M, Sick TJ. Rapid preconditioning protects rats against ischemic neuronal damage after 3 but not 7 days of reperfusion following global cerebral ischemia. J Cereb Blood Flow Metab. 1997;17:175–182. doi: 10.1097/00004647-199702000-00007. [DOI] [PubMed] [Google Scholar]
- Perez-Pinzon MA, Dave KR, Raval AP. Role of reactive oxygen species and protein kinase C in ischemic tolerance in the brain. Antioxid Redox Signal. 2005;7:1150–1157. doi: 10.1089/ars.2005.7.1150. [DOI] [PubMed] [Google Scholar]
- Prekeris R, Mayhew MW, Cooper JB, Terrian DM. Identification and localization of an actin-binding motif that is unique to the epsilon isoform of protein kinase C and participates in the regulation of synaptic function. J Cell Biol. 1996;132:77–90. doi: 10.1083/jcb.132.1.77. [DOI] [PMC free article] [PubMed] [Google Scholar]
- Raha S, Myint AT, Johnstone L, Robinson BH. Control of oxygen free radical formation from mitochondrial complex I: roles for protein kinase A and pyruvate dehydrogenase kinase. Free Radic Biol Med. 2002;32:421–430. doi: 10.1016/s0891-5849(01)00816-4. [DOI] [PubMed] [Google Scholar]
- Raval AP, Dave KR, Mochly-Rosen D, Sick TJ, Perez-Pinzon MA. εPKC is required for the induction of tolerance by ischemic and NMDA-mediated preconditioning in the organotypic hippocampal slice. J Neurosci. 2003;23:384–391. doi: 10.1523/JNEUROSCI.23-02-00384.2003. [DOI] [PMC free article] [PubMed] [Google Scholar]
- Raval AP, Dave KR, Defazio RA, Perez-Pinzon MA. εPKC phosphorylates the mitochondrial K+ATP channel during induction of ischemic preconditioning in the rat hippocampus. Brain Res. 2007;1184:345–353. doi: 10.1016/j.brainres.2007.09.073. [DOI] [PMC free article] [PubMed] [Google Scholar]
- Rustin P, Chretien D, Bourgeron T, Gerard B, Rotig A, Saudubray JM, Munnich A. Biochemical and molecular investigations in respiratory chain deficiencies. Clin Chim Acta. 1994;228:35–51. doi: 10.1016/0009-8981(94)90055-8. [DOI] [PubMed] [Google Scholar]
- Schechtman D, Mochly-Rosen D. Adaptor proteins in protein kinase C-mediated signal transduction. Oncogene. 2001;20:6339–6347. doi: 10.1038/sj.onc.1204778. [DOI] [PubMed] [Google Scholar]
- Schwarze SR, Ho A, Vocero-Akbani A, Dowdy SF. In vivo protein transduction: delivery of a biologically active protein into the mouse. Science. 1999;285:1569–1572. doi: 10.1126/science.285.5433.1569. [DOI] [PubMed] [Google Scholar]
- Seyedi N, Koyama M, Mackins CJ, Levi R. Ischemia promotes renin activation and angiotensin formation in sympathetic nerve terminals isolated from the human heart: contribution to carrier-mediated norepinephrine release. J Pharmacol Exp Ther. 2002;302:539–544. doi: 10.1124/jpet.302.2.539. [DOI] [PubMed] [Google Scholar]
- Shin CY, Kundel M, Wells DG. Rapid, activity-induced increase in tissue plasminogen activator is mediated by metabotropic glutamate receptor-dependent mRNA translation. J Neurosci. 2004;24:9425–9433. doi: 10.1523/JNEUROSCI.2457-04.2004. [DOI] [PMC free article] [PubMed] [Google Scholar]
- Siegal GJ, Agranoff BW, Albers RW, Fisher SK, Uhler MD. Philadelphia: Lippincott, Williams and Wilkins; 1999. Basic neurochemistry, molecular, cellular, and medical aspects, Ed 6. [Google Scholar]
- Weber NC, Toma O, Wolter JI, Obal D, Mullenheim J, Preckel B, Schlack W. The noble gas xenon induces pharmacological preconditioning in the rat heart in vivo via induction of PKC-epsilon and p38 MAPK. Br J Pharmacol. 2005;144:123–132. doi: 10.1038/sj.bjp.0706063. [DOI] [PMC free article] [PubMed] [Google Scholar]
- Wei J, Davis KM, Wu H, Wu JY. Protein phosphorylation of human brain glutamic acid decarboxylase (GAD)65 and GAD67 and its physiological implications. Biochemistry. 2004;43:6182–6189. doi: 10.1021/bi0496992. [DOI] [PubMed] [Google Scholar]
- Zhan RZ, Wu C, Fujihara H, Taga K, Qi S, Naito M, Shimoji K. Both caspase-dependent and caspase-independent pathways may be involved in hippocampal CA1 neuronal death because of loss of cytochrome c from mitochondria in a rat forebrain ischemia model. J Cereb Blood Flow Metab. 2001;21:529–540. doi: 10.1097/00004647-200105000-00007. [DOI] [PubMed] [Google Scholar]