

Abstract
AIMS
Midazolam (MDZ) is a benzodiazepine used as a CYP3A4 probe in clinical and in vitro studies. A glucuronide metabolite of MDZ has been identified in vitro in human liver microsome (HLM) incubations. The primary aim of this study was to understand the in vivo relevance of this pathway.
METHODS
An authentic standard of N-glucuronide was generated from microsomal incubations and isolated using solid-phase extraction. The structure was confirmed using proton nuclear magnetic resonance (NMR) and 1H-13C long range correlation experiments. The metabolite was quantified in vivo in human urine samples. Enzyme kinetic behaviour of the pathway was investigated in HLM and recombinant UGT (rUGT) enzymes. Additionally, preliminary experiments were performed with 1′-OH midazolam (1′-OH MDZ) and 4-OH-midazolam (4-OH MDZ) to investigate N-glucuronidation.
RESULTS
NMR data confirmed conjugation of midazolam N-glucuronide (MDZG) standard to be on the α-nitrogen of the imidazole ring. In vivo, MDZG in the urine accounted for 1–2% of the administered dose. In vitro incubations confirmed UGT1A4 as the enzyme of interest. The pathway exhibited atypical kinetics and a substrate inhibitory cooperative binding model was applied to determine Km (46 µM, 64 µM), Vmax (445 pmol min−1 mg−1, 427 pmol min−1 mg−1) and Ki (58 µM, 79 µM) in HLM and rUGT1A4, respectively. From incubations with HLM and rUGT enzymes, N-glucuronidation of 1′-OH MDZ and 4-OH MDZ is also inferred.
CONCLUSIONS
A more complete picture of MDZ metabolism and the enzymes involved has been elucidated. Direct N-glucuronidation of MDZ occurs in vivo. Pharmacokinetic modelling using Simcyp™ illustrates an increased role for UGT1A4 under CYP3A inhibited conditions.
Keywords: 1′-hydroxymidazolam, 4-hydroxymidazolam, glucuronidation, in vitro metabolism, in vivo metabolism, midazolam
WHAT IS ALREADY KNOWN ABOUT THIS SUBJECT
Midazolam is extensively metabolized and is eliminated in urine predominantly as conjugates of 1′-hydroxymidazolam.
Midazolam is known to undergo N-glucuronidation in vitro by UGT1A4.
In vitro 1′-hydroxymidazolam is O-glucuronidated by UGT2B4 and UGT2B7, and N-glucuronidated by UGT1A4.
WHAT THIS STUDY ADDS
N-glucuronide of midazolam has been quantified in human urine, indicating for the first time that this route of metabolism occurs in vivo.
Metabolism of 4-hydroxymidazolam has been compared with that of 1′-hydroxymidazolam in vitro.
This study provides further evidence, in vitro and in vivo, of the importance of N-glucuronidation in the metabolism of midazolam and its metabolites.
Introduction
Midazolam (MDZ) is a short-acting benzodiazepine used clinically to relieve anxiety during induction of anaesthesia [1, 2]. In human liver microsomes (HLM) the compound is extensively metabolized by CYP3A4 and 3A5 to two primary metabolites, 1′-hydroxymidazolam (1′-OH MDZ) and 4-hydroxymidazolam (4-OH MDZ) [3, 4]. The compound has been widely used in the clinic as a probe substrate for CYP3A [5, 6]. MDZ is rapidly eliminated from the body almost exclusively by metabolic processes [7]. Plasma concentrations of the main hydroxylated metabolite, 1′-OH MDZ, are relatively high, representing 40–100% of unchanged drug [8, 9]. However, the hydroxylated metabolites can be further metabolized and are excreted from the body as conjugates. Urinary analysis has revealed that 60–80% of the administered dose is eliminated as 1′OH MDZ conjugate [9]. Elevated levels of 1′-OH MDZ glucuronide have also been reported in renally impaired patients receiving MDZ [10, 11]. Recently, a novel glucuronidated metabolite of MDZ (MDZG) was identified in vitro, in hepatocytes and liver microsomes [12, 13] and has been confirmed as a quaternary direct N-glucuronide [13]. UGT1A4 has been identified as the specific UGT enzyme involved in its formation [12, 13]. In vitro studies with 1′-OH MDZ have also identified a quaternary N-glucuronide, again mediated through UGT1A4 [14]. To date these quaternary N-glucuronides have not been reported in vivo.
The UGT enzyme family is made up of 15 isoforms mediating the phase II metabolism of a large range of therapeutic compounds [15]. The reactions catalysed by these enzymes involve the conjugation of glucuronic acid to a nucleophilic function such as an amino, acid or hydroxyl group. UGT1A4 is capable of metabolizing a structurally diverse set of substrates, including formation of quaternary nitrogen-linked glucuronides. UGT1A4 preferentially conjugates nucleophilic nitrogens over oxygens [15]. Due to the enzymes preference for N-glucuronidation, it is not surprising that it is responsible for the N-glucuronidation of MDZ and 1′-OH MDZ. Similarly, the nitrogen that is more likely to be glucuronidated is within the imidazo ring as there is little steric hindrance. As part of this study MDZG has been generated from in vitro incubations and isolated as a standard for quantitative purposes. The position of the N-glucuronide has been definitively assigned.
MDZ is used as a CYP3A4 probe for catalytic rates and hepatic clearance; however, up to 20% of MDZ metabolites are unidentified [7]. In vivo, the direct glucuronidation of MDZ by UGT1A4 may occur and, to date, this pathway has not been reported as part of the quantitative determination of MDZ metabolites. In this study urines from individuals receiving i.v. and oral MDZ have been analysed for MDZG to determine the contribution this route makes to the overall clearance of the drug. Further experiments in vitro have investigated the N-glucuronidation of 1′-OH and 4-OH MDZ to give a more complete understanding of the overall fate of MDZ in vivo.
Confirmation of MDZ as a specific substrate for UGT1A4 with quantified enzyme kinetic data and in vivo urinary elimination may support it for candidacy as a probe substrate for this enzyme both in vitro and in vivo.
Materials and methods
Chemicals
All chemicals and compounds were obtained from Sigma Aldrich (St Louis, MO, USA). HLM and recombinant UGT (rUGT) Supersomes™ were obtained from BD Biosciences (San Jose, CA, USA). All commercially available reagents and solvents were of analytic or high-performance liquid chromatography (HPLC) grade.
Glucuronide standard production
Microsomal Incubations
Incubations (3000 × 1 ml) were performed at 100 µM MDZ in HLM at 0.5 mg protein ml−1. Each incubation comprised 50 mM Tris–HCl at pH 7.4 with 5 mM saccharolactone, alamethacin (50 µg mg−1 protein) and 10 mM MgCl2. The incubation mixture was kept on ice for 15 min to allow alamethacin to form pores in microsomal membrane prior to addition of MDZ. Incubations were then warmed to 37°C and initiated by addition of 5 mM UDP glucuronic acid (UDPGA). Reactions were terminated at 6 h with 3× volume ice-cold acetonitrile (MeCN). Samples were pooled and dried down under nitrogen at 30°C until a thick precipitate had formed.
Sample isolation
Samples were extracted using a Bakerbond C18 solid-phase extraction cartridge conditioned with 10 ml of 100% MeCN, 10 ml 100% H2O and 10 ml 90 : 10 water : MeCN containing 2 mM NH4OAc, pH 8. The sample was resuspended in water : MeCN (90 : 10) containing 2 mM NH4OAc, pH 8 and loaded onto the cartridge. The cartridge was washed with 30 ml water : MeCN (90 : 10) containing 2 mM NH4OAc, pH 8, followed by increasing 5% increments MeCN. Each wash sample was collected separately and analysed to identify where MDZG elutes. The solvent ratio to elute MDZG was then used to wash the MDZG off the cartridge. The sample was dried down at room temperature to minimize thermal degradation of the compound.
Sample desalting
A new column was conditioned with 100% MeOH, 100% H2O and 90 : 10 H2O : MeOH. The isolated sample was re-suspended in 90 : 10 H2O : MeOH and loaded onto the column. The sample was washed with 30 ml 90 : 10 H2O : MeOH, to remove salts and eluted with 100% MeOH. The desalted sample was dried down at room temperature.
Purity determination
Five milligrams of MDZ and 5 mg of the MDZG standard were analysed by nuclear magnetic resonance (NMR) using a Varian Inova 500 MHz with a 3-mm inverse detection probe. A total of five proton experiments were run to determine purity. The quantitative parameters were optimized for MDZ and applied to MDZG. The key parameters are outlined in the table below:
| PW30 | 1.2625 |
| Number of scans | 64 |
| Dummy Scans | 4 |
| D1 | 60 s |
| Gain | 48 |
| Scan range | 14 ppm to −2 ppm |
Integrated peaks of parent were compared with those of the standard. The integrals of interest used in the purity calculation were the CH at 8.06 ppm on the methyl imidazole ring for the MDZG and one of the protons at 5.2 ppm from the CH2 and used to give a purity figure of the sample using Equation 1[16]:
 |
(1) |
| Molecular weight MDZ = 325.767 3232 Da | Purity = 100% |
| Molecular weight MDZG = 502.898 8346 Da | Purity = unknown |
Quantification of MDZG in urine
Urine samples were obtained from subjects who had received MDZ as part of a clinical study. The clinical study protocol was reviewed and approved by IntegReview, an independent ethics review board, and all volunteers gave written informed consent. Subjects (healthy men aged 22–54 years with body weight between 71 and 94 kg) received a single dose of 3 mg oral MDZ or 1 mg i.v. MDZ. Urine was collected pre-MDZ dose and 0–6, 6–12 and 12–24 h post-MDZ dose on day 1. Samples (50 µl) were treated with 300 µl acetonitrile containing internal standard (flunitrazepam at 50 ng ml−1) and filtered (3 M Empore filtration plate). The filtrate was evaporated to dryness under nitrogen and then reconstituted in 150 µl MeCN : water (50 : 50) prior to analysis by LC-MS/MS. Samples were chromatographed on a Phenomenex Synergi 2.5-µm fusion-RP column (30 × 2.0 mm) with a mobile phase of (A) water : MeCN (95 : 5) +0.1% formic acid, and (B) MeCN +0.1% formic acid delivered at 1 ml min−1 over the following gradient elution. 0 min, 97% A; 3 min, 70% A; 3.7 min, 10% A; 4.2 min, 10% A; 5 min, 97% A. Under these conditions MDZG eluted at 1.9 min. The calibration range was 2–1000 ng ml−1. Calibration and quality control (QC) samples were constructed in control urine and were processed in the same way as clinical samples. The overall method imprecision values for QC samples were 7.9, 15.9 and 0.8% at concentrations of 5, 50 and 500 ng ml−1, respectively. The mean inaccuracy of the assay ranged from −16.6% to +18.9% over the calibration range.
Microsomal incubations
Initial screening
MDZ (100 µM), 1-’OH MDZ (100 µM) and 4-OH MDZ (100 µM) were incubated in triplicate in control HLM at 0.5 mg protein ml−1 and individual rUGT Supersomes™: Control, UGT1A1, UGT1A3, UGT1A4, UGT1A6, UGT1A7, UGT1A8, UGT1A9, UGT1A10, UGT2B4, UGT2B7, UGT2B15 and UGT2B17. Incubations (200 µl) comprised 50 mM Tris–HCl at pH 7.4 with 5 mM saccharolactone, alamethacin (50 µg mg−1 protein) and 10 mM MgCl2. The incubation mixture was kept on ice for 15 min prior to addition of substrate. Mix was warmed to 37°C and 5 mM UDPGA added to initiate the incubation. Reactions were terminated after 30 min by addition of 3× volume MeCN. Samples were processed and analysed as described above.
MDZG kinetics
Microsomal incubations (200 µl) were performed as above with MDZ (0–800 µM, n = 3), using HLM and rUGT1A4 at 0.5 mg ml−1 for 20 min. Incubations were terminated in 3× volume MeCN and then diluted with 600 µl water. Samples were analysed by HPLC-MS/MS using a Sciex API 3000 mass spectrometer with a Phenonemex Onyx monolith C18 3.5-µm, 50 × 4.6 mm column and the following mobile phase: (A) H2O : MeOH 10 : 90 and (B) H2O : MeOH 90 : 10 delivered as 0–30.5% A in 2.3 min, 30.5–100% A in 0.1 min; 100% A for 2.7 min (total gradient 5 min). Samples were quantified using a calibration curve prepared from authentic MDZG standard, the preparation of which is described above.
Inhibition of MDZG
MDZ was incubated at a concentration approximating to the Km under conditions described above. The effect of increasing concentrations of trifluoperazine (TFP), ketoconazole (KTZ) and itraconazole (ITZ) (0 µM to 2 mM) was investigated. The percentage inhibition of MDZG formation was plotted against the log of the inhibitor concentration and the IC50 determined.
1′-OH MDZ and 4-OH MDZ glucuronidation
Additional incubations with 1′-OH MDZ and 4-OH MDZ were performed with UGT1A4, 2B4 and 2B7 for analysis under conditions that were able to separate O-glucuronide and N-glucuronide based upon the method of Zhu et al. [14]. Samples were chromatographed using a Phenomenex Synergi 4-µm Fusion-RP 80A (250 × 4.6 mm) with a mobile phase of (A) 5 mM ammonium acetate in water, (B) MeCN : MeOH (70 : 30) delivered at 1 ml min−1 using the following gradient elution: 0–30 min 80% A to 65% A, 30–31 min 86% A to 50% A, 31–40 min 50% A to 40%A, 40–45 min 40% A to 5% A, 45–48 min 5% A and 48.1 min 80% A.
Data analysis
Peak integration of MDZ and metabolites and quantification from standard curves were performed using Analyst v1.4 (Applied Biosystems, Foster City, CA, USA). All enzyme kinetic parameters and IC50 values were determined using Grafit v 5 (Erithacus Software Ltd, East Grinstead, UK). Two previously published multisite kinetic models were used to fit the enzyme kinetic data (equation 7 from Houston and Kenworthy [17] and a modification of equation 11 from Shou et al. [18]. See Results for equation details). Model comparisons were made using the F-Test within Grafit.
Results
MDZG standard production
Incubations of MDZ with HLM in the presence of UDPGA produced a metabolite of MH+ 502 Da, which eluted off the column at 6.13 min. Metabolite isolation from multiple HLM incubations yielded 34 mg of light brown MDZG. Table 1 summarizes the purity determination data from which a purity of 90.3% was calculated for the isolated standard.
Table 1.
1H nuclear magnetic resonance proton spectra integral data, for purity determination
| Spectrum number | MDZ 1H peak integration | MDZG 1H peak integration |
|---|---|---|
| 1 | 2.58 | 1.52 |
| 2 | 2.65 | 1.52 |
| 3 | 2.66 | 1.54 |
| 4 | 2.63 | 1.55 |
| 5 | 2.66 | 1.53 |
| Mean | 2.636 | 1.532 |
MDZ, midazolam; MDZG, midazolam N-glucuronide.
Structural analysis
NMR analysis of MDZG was conducted to assign the position of glucuronidation. A combination of proton NMR and long-range 1H-13C correlation (gHMBC) experiments demonstrated that the spectrum of MDZG (Figure 1) was consistent with the known MDZ backbone of the molecule. The 1H-13C long-range correlation (gHMBC) experiment allows the unambiguous assignment of the position of attachment of the glucuronic acid moiety to MDZ. From the gHMBC experiment the key correlation is from the anomeric proton on the glucuronide moiety to the carbons in the MDZ. The HMBC shows correlations from the anomeric peak to carbons 11 and 8 in the imidazole moiety. As can be seen in Table 2, a number of correlations enabled the unambiguous assignment of the structure. As reported by Klieber et al. [13], we found two forms of this glucuronide with identical accurate MH+ of 502.1181 Da. Both species were capable of reaching equilibrium within 12 h at 10°C.
Figure 1.

1H nuclear magnetic resonance (NMR) spectra of midazolam N-glucuronide (MDZG). Inset shows assignments around glucuronide moiety
Table 2.
1H and gHMBC data for midazolam and midazolam N-glucuronide
| H | MDZ Proton chemical shift (ppm) | MDZ 13C chemical shift (ppm) | MDZG Proton chemical shift (ppm) | MDZG 13C chemical shift (ppm) |
|---|---|---|---|---|
| 26 | 2.5 (t) | 145 (11-C) | 2.9 (t) | a145 (8-C) |
| 16 | 4.1 (d), 5.1 (d) | 130 (11-C) | 4.2 (dd), 5.2 (dd) | b115 (11-C) |
| 140 (10-C) | c140 (10-C) | |||
| 155 (14-C) | d155 (14-C) | |||
| 2 | n/a | n/a | 5.7 (dd) | e115 (11-C) |
| f145 (8-C) | ||||
| 11 | 6.9 (s) | 140 (10-C) | 8.1 (ds) | g140 (10-C) |
| 145 (8-C) | h145 (8-C) |
Multiplicity of protons signals: s, singlet; d, doublet; t, triplet; ds, double-singlet; dd, double-doublet.
Quantification of MDZG in urine
Urine samples (0–6 h, 6–12 h, 12–24 h) from six individuals receiving either 3 mg oral or 1 mg i.v. MDZ were analysed. MDZG was observed in urines from all individuals. Cumulative amounts of MDZG excreted over the total 24-h period were determined and are summarized in Table 3. Following oral administration an average of 48.8 ± 13.2 µg (range 21.0–148.2 µg) of MDZG was eliminated, with >70% eliminated in the first 12 h. Following i.v. administration an average of 30.7 ± 5.7 µg (range 17.6–59.8 µg) of MDZG was eliminated, with >70% eliminated in the first 12 h.
Table 3.
Quantification of midazolam N-glucuronide (MDZG) eliminated in the urine of six individuals over 24 h following 3 mg oral and 1 mg i.v. midazolam
| Subject | Amount of MDZG eliminated in urine over 24 h (µg) 3-mg oral dose | 1-mg i.v. dose |
|---|---|---|
| 3 | 56.3 | 40.7 |
| 4 | 21.0 | 20.8 |
| 5 | 148.2 | 59.8 |
| 6 | 59.2 | 17.6 |
| 10 | 37.1 | 26.5 |
| 11 | 35.3 | 35.1 |
| Geometric mean | 48.8 | 26.5 |
| SEM | 13.2 | 5.7 |
Microsomal incubations
Initial screening
An initial evaluation of glucuronide formation from MDZ, 1′-OH MDZ and 4-OH MDZ showed no glucuronide formation by UGTs 1A1, 1A3, 1A6, 1A7, 1A8, 1A9, 1A10, 2B15, 2B17 or the control microsomes. Relative amounts of glucuronide formation were assessed based upon peak area. For MDZ N-glucuronidation UGT1A4 was clearly favoured over UGT2B4 and 2B7 (>100-fold and >400-fold, respectively). For 1′-OH MDZ and 4-OH MDZ glucuronidation the distinction between the three UGTs was less clear, with less than a threefold difference in glucuronide peak area measured across the three enzymes.
MDZG enzyme kinetics
Figure 2 shows the enzyme kinetic data (Eadie–Hofstee plots) for MDZG formation in HLM and rUGT1A4 (Figure 2a,b, respectively). The formation rate does not follow Michaelis–Menten (MM) behaviour. The shape of the Eadie–Hofstee plots show both allosteric activation and substrate inhibition. Of the two multisite kinetic models applied to the data, the equation derived from a combination of the Hill equation and substrate-inhibitory equations [18], giving a two-site substrate-inhibitory cooperative binding model (Equation 2), gave a better fit (P-value <0.001, and lower χ2) and was therefore used to calculate values for Vmax and Km. The large number of variables in the equation makes fitting of the data more complex, and since initial fitting of the data indicated a very low β value (<0.01), this value was set as a constant of 0.01, to allow for better fitting of other variables.
Figure 2.

(a) Eadie–Hofstee plot of midazolam N-glucuronide (MDZG) production in human liver microsomes (HLM). (b) Eadie–Hofstee plot of MDZG production in rUGT1A4 Supersomes™. Incubations performed across midazolam (MDZ) concentration range of 10–800 µM
 |
(2) |
| Ki = Kc of inhibitory S binding to E | Ks = Kc of productive S binding to E |
| v = initial rate | Vmax = maximum catalytic rate at full saturation |
| β = turnover rate modifying factor | α = Ks modifying factor |
| n = slope of allosteric effect | [S] = substrate concentration |
Results are summarized in Table 4 for HLM and rUGT1A4 and shown graphically in Figure 3.
Table 4.
Enzyme kinetic values attained from multisite equation for midazolam (MDZ) glucuronidation by human liver microsomes (HLM) and rUGT1A4
| MDZ | ||
|---|---|---|
| Parameters | HLM | rUGT1A4 |
| Vmax (pmol min−1 mg−1) | 445 ± 1 | 427 ± 0.5 |
| Ks (µM) | 46 ± 5 | 64 ± 6.4 |
| Ki (µM) | 58 ± 6 | 79 ± 8 |
| α | 18.3 ± 0.0007 | 14.9 ± 0.0008 |
| n | 2.3 ± 0.05 | 2.6 ± 0.07 |
| R2 | 0.962 | 0.986 |
Figure 3.

Midazolam N-glucuronide (MDZG) kinetics in human liver microsomes (HLM) and rUGT1A4 fitted to a two-site substrate inhibition cooperative binding model (Equation 2). Open circles, HLM kinetic data; closed circles, rUGT1A4 kinetic data. HLM101 (—○—); UGT1A4 (—•—)
Inhibition of MDZG formation
Increasing concentrations of KTZ, ITZ and TFP were co-incubated with MDZ (Figure 4). Both KTZ and ITZ were found to inhibit UGT1A4 at concentrations >100 µM. IC50 values were 150 ± 6 µM and 308 ± 14 µM, respectively. TFP showed an initial activation of MDZG production, with maximal activation of 138% at 60 µM, followed by inhibition.
Figure 4.

IC50 plots investigating the effects of: ketoconazole (KTZ) (closed circles), itraconazole (ITZ) (open circles) and trifluoperazine (TFP) (closed squares) on midazolam (MDZ) N-glucuronidation. Uninhibited values were 160.2 pmol mg−1 min−1, 154.2 pmol mg−1 min−1 and 150.0 pmol mg−1 min−1 for KTZ, ITZ, and TFP experiments, respectively. Ketoconazole (—•—); ltraconazole (—○—); TFP ( )
)
Qualitative assessment of 1′-OH MDZ and 4-OH MDZ glucuronidation
Incubations with 1′-OH MDZ in HLM produced two peaks both with the mass spectral transition (MRM) of 518.1/342.1 and retention times of 18.8 and 23.0 min. Incubations with rUGT1A4, which preferentially forms N-glucuronides, gave a single peak with a retention time of 22.9 min, whereas incubations with rUGT2B4 and rUGT2B7 both gave a peak at 18.5 min. From these data and by comparison with the work of Zhu et al. [14] and current knowledge of UGT structure activity relationships, it is postulated that the two peaks in HLM are 1′-OH MDZ O-glucuronide (18.8 min) and N-glucuronide (23.0 min). A similar analysis of incubations with 4-OH MDZ generated three peaks with MRM 518.1/342.1 with retention times of 16.0, 17.4 and 19.4 min. Incubations with rUGT1A4 produced a single peak with a retention time of 19.4 min, whereas incubations with rUGT2B4 and rUGT2B7 both produced two peaks with retention times of 16.0 and 17.5 min. It is therefore postulated that the peak at 19.4 min is the N-glucuronide of 4-OH MDZ, whereas the two peaks present in rUGT2B4 and rUGT2B7 are O-glucuronide isomers.
Discussion
Direct glucuronidation of MDZ, in addition to glucuronidation of hydroxylated metabolites, has been reported in in vitro studies with HLM and human hepatocytes [13]. The presence of this MDZG metabolite has been identified in human urine samples from individuals receiving oral and i.v. MDZ. In order to quantify the amount of MDZG eliminated in urine, an authentic standard was prepared from HLM incubations with 90.3% purity, and the structure confirmed by NMR. As observed by Klieber et al. [13], the NMR revealed MDZG to exist in two forms. Both species undergo equilibration and reach equilibrium within 12 h at 10°C.
The authentic standard was used to quantify MDZG in human urine with, on average, 49 µg and 31 µg MDZG eliminated over 24 h, following 3 mg oral and 1 mg i.v. dosing, respectively, accounting for approximately 1–2% of MDZ dose (calculated on molar basis). This is consistent with 2% metabolism through N-glucuronidation in vitro in HLM as assessed from intrinsic clearance values for N-glucuronidation and hydroxylation pathways (data not shown). There was greater interindividual variability following oral dosing (sevenfold) compared with i.v. (3.4-fold). This amount of variability was very similar to that observed in a bank of HLM, comprising 56 donors, where there was a sevenfold range in MDZG (data not shown). Although this level of glucuronidation in vivo may be considered low, these data demonstrate the in vivo relevance of the in vitro findings. It has been shown in incubations with human hepatocytes that under conditions where CYP3A4/5-mediated clearance of MDZ is abolished by KTZ, N-glucuronidation accounted for the majority of the remaining MDZ clearance [13]. Having identified this metabolic pathway in urine, the possibility for metabolic switching in vivo under CYP3A4-inhibited conditions arises. In order to understand the relevance of this, the MDZG metabolic pathway was characterized in incubations with HLM and rUGTs. It has been confirmed with the full bank of recombinant individually expressed UGTs available that UGT1A4 is the only UGT that conjugates MDZ directly.
A multisite kinetic model (Equation 2) was applied to data from both rUGT1A4 and HLM kinetic experiments. To ensure a good fit to this model a relatively large number of substrate concentrations (18) were utilized, as there were five unknown variables in the equation. As can be seen from Figure 3, the curve fit obtained by applying this equation described the data well, and the errors associated with values for Vmax, Ks and Ki were within acceptable limits (<11%). Although no other literature reports were found that had used this model for UGTs, the principles behind its application are identical to some atypical behaviour observed in P450s (autoinhibition and activation) [19]. The Hill coefficient of at least 2.3 suggests large conformational changes within the enzyme tertiary and/or possible quaternary structure. A Hill coefficient of 2.3 does increase the probability that this enzyme has quaternary structure (e.g. haemoglobin has a coefficient = 2.7 and has four subunits [20]). In both enzyme systems substrate inhibition was also observed. This kinetic characteristic has been observed for other UGT1A4 substrates [21–23]. For MDZ glucuronidation, substrate inhibition was characterized by Ki values of 58 µM and 79 µM in HLM and rUGT1A4, respectively. Substrate inhibition or allosteric activation has been seen in other UGTs such as UGT1A1, UGT1A9, UGT2B7 and UGT2B15 [24–27] and so is not unique to UGT1A4. Substrate inhibition was not reported previously for midazolam glucuronidation [13]; however, the assay conditions employed in the current study investigate a maximum substrate concentration up to an order or magnitude greater than the original study. Substrate inhibition is unlikely to be of consequence in vivo due to the high concentrations at which is has been observed. Whether or not autoactivation is an in vitro artefact or something that will be of in vivo consequence is more difficult to discern, and has been a subject for discussion in review articles [17, 28].
In terms of enzyme inhibition, KTZ and ITZ, CYP3A4 inhibitors that are also known to possess UGT inhibitory activity [29–31], showed only weak inhibition of UGT1A4 activity, suggesting that KTZ and ITZ will not inhibit UGT1A4-mediated metabolism of MDZ in vivo. TFP was also seen to be a weak inhibitor of MDZ glucuronidation. At concentrations <100 µM, TFP activation of MDZ glucuronidation was observed, with the catalytic activity increasing by 38%. This phenomenon supports the previous finding of an allosteric kinetic model, and demonstrates that a structurally dissimilar compound can activate the catalysis of another. Differential inhibition and activation depending on substrate and effector pairings has been reported for the CYP3A4 enzyme [19]. That similar behaviour is observed in this study shows UGT1A4 as more complex than a simple MM enzyme.
MDZ is rapidly metabolized to a major metabolite, 1′-OH MDZ, and urinary recovery of the glucuronide of this metabolite accounts for at least 70% of an administered dose [9]. The minor primary metabolite, 4-OH MDZ, and a minor secondary metabolite 1′,4-diOH MDZ, also catalysed by CYP3A along with the corresponding glucuronide conjugates, comprise another 4–6% of an administered dose [2, 7]. Recently the pathways for glucuronidation of 1′-OH MDZ in vitro were found to be mediated through UGT2B4 and UGT2B7 (O-glucuronide) and UGT1A4 (N-glucuronide) [14]. The intrinsic clearance for O-glucuronidation was approximately ninefold higher than that of N-glucuronidation in HLM. In this study there were observed two chromatographically separate glucuronides of 1′-OH MDZ in HLM and, based upon distinct glucuronides formed by UGT1A4 compared with UGT2B4 and UGT2B7, it is believed that these are the same glucuronides observed by Zhu et al. [14]. In addition, we have qualitatively assessed glucuronidation of 4-OH MDZ. In HLM three separate peaks were observed, one co-eluting with a single peak produced in incubations with UGT1A4, and therefore believed to be 4-OH MDZ N-glucuronide, and two peaks co-eluting with the two peaks observed in incubations with both UGT2B4 and UGT2B7, believed to be O-glucuronide isomers. In light of these new data, a more complete picture of the routes of MDZ metabolism and the enzymes involved can be developed. Figure 5 serves to illustrate this and highlights the importance of UGT1A4 in several pathways.
Figure 5.
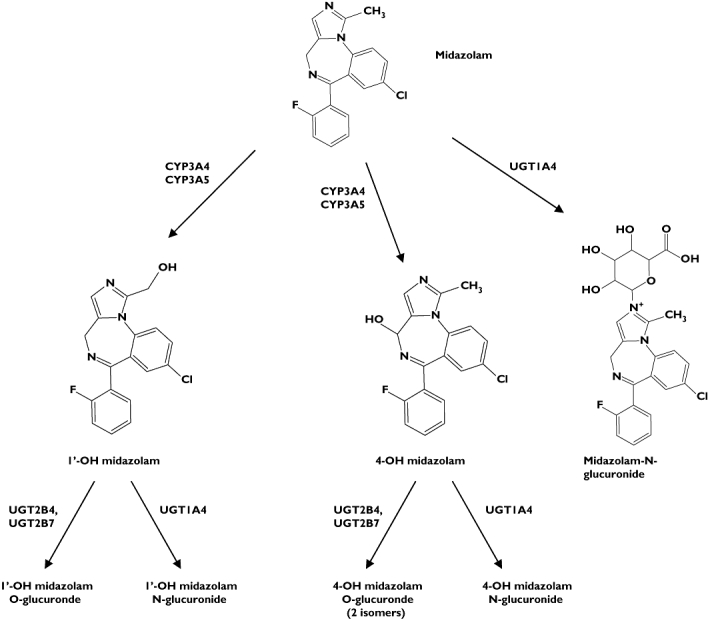
Metabolic scheme for midazolam (MDZ) in humans
The Km values for MDZG in both HLM and rUGT1A4 were in excess of 45 µM, a high value (‘low affinity’) for a proposed in vivo pathway for this substrate. The Km for phase I metabolism by CYP3A4 is approximately 2 µM [32], 20-fold less than direct glucuronidation by UGT1A4. In vivo plasma concentrations of MDZ do not exceed 0.85 µM even with a high 15-mg dose; therefore, it would seem unlikely to reach concentrations high enough to be conjugated efficiently by UGT1A4, or be able to compete with the near-optimal conditions of 1′-OH MDZ production by CYP3A4. However, under conditions whereby CYP3A4 is inhibited, MDZ glucuronidation may have a bigger role. This has been assessed using the population-based ADME simulator Simcyp™ (version 8.1). The kinetic constants obtained in HLM incubations for MDZG were incorporated into the default MDZ profile provided by Simcyp™. A pharmacokinetic trial was simulated using 10 populations of 10 individuals (CYP3A5 PM frequency 0.83), administered a 3-mg oral dose of MDZ. Under these conditions the percentage contributions of CYP3A4, CYP3A5 and UGT1A4 to the total hepatic intrinsic clearance of MDZ were 85.3, 11.7 and 2.9%, respectively. Incorporating the co-operativity factors α and β into the model had a minimal effect on total systemic clearance or relative roles for individual enzymes (80.4, 17.8 and 1.8%, respectively), which is consistent with a similar evaluation of the influence of co-operativity factors on in vivo clearance [33]. Co-administration of 400 mg KTZ resulted in a larger role for UGT-mediated clearance with values of 63.8, 17.2 and 19% for CYP3A4, CYP3A5 and UGT1A4, respectively. This has a modest impact on the predicted drug–drug interaction, with a mean MDZ AUC ratio of 14.9 (median 13.1), compared with 13.8 (median 11.9) when UGT1A4 clearance is incorporated into the model. In a simulated population lacking CYP3A5 the mean percent contributions for CYP3A4 and UGT1A4 went from 96.1 and 3.9% to 73.2 and 26.8% in the presence of KTZ. Thus, there is an increased role for N-glucuronidation of MDZ not only under KTZ-inhibited conditions, but also in individuals lacking functional CYP3A5. Although functional polymorphisms of UGT1A4 have been identified [34], it is unlikely that this would contribute to interindividual variability in MDZ clearance due to the relatively small contribution of the glucuronidation pathway. Under conditions whereby the CYP-mediated clearance is reduced following co-administration of a CYP inhibitor, the clearance through UGT1A4 will remain unaffected. Total drug clearance is reduced and the relative role for UGT1A4 as a proportion of clearance increases. Functional polymorphisms in UGT1A4 may have a greater impact under these conditions. Although direct glucuronidation of MDZ is a metabolic pathway of in vivo relevance, the low contribution to overall clearance on MDZ in humans makes it unlikely to be a sensitive probe for UGT1A4 activity.
Competing interests
None declared.
The authors thank Neil Benson for assisting with enzyme kinetic analysis and Manoli Vourvahis and Maria Rosario for conducting the clinical study.
REFERENCES
- 1.Evans MS, Viola-McCabe KE. Midazolam inhibits long-term potentiation through modulation of GABAA receptors. Neuropharmacology. 1996;35:347–57. doi: 10.1016/0028-3908(95)00182-4. [DOI] [PubMed] [Google Scholar]
- 2.Dundee JW, Halliday NJ, Harper KW, Brogden RN. Midazolam. A review of its pharmacological properties and therapeutic use. Drugs. 1984;28:519–43. doi: 10.2165/00003495-198428060-00002. [DOI] [PubMed] [Google Scholar]
- 3.Fabre G, Rahmani R, Placidi M, Combalbert J, Covo J, Cano JP, Coulange C, Ducros M, Rampal M. Characterization of midazolam metabolism using human hepatic microsomal fractions and hepatocytes in suspension obtained by perfusing whole human livers. Biochem Pharmacol. 1988;37:4389–97. doi: 10.1016/0006-2952(88)90622-3. [DOI] [PubMed] [Google Scholar]
- 4.Kronbach T, Mathys D, Umeno M, Gonzalez FJ, Meyer UA. Oxidation of midazolam and triazolam by human liver cytochrome P450IIIA4. Mol Pharmacol. 1989;36:89–96. [PubMed] [Google Scholar]
- 5.Streetman DS, Bertino JS, Jr, Nafziger AN. Phenotyping of drug-metabolizing enzymes in adults: a review of in-vivo cytochrome P450 phenotyping probes. Pharmacogenetics. 2000;10:187–216. doi: 10.1097/00008571-200004000-00001. [DOI] [PubMed] [Google Scholar]
- 6.Rogers JF, Rocci ML, Jr, Haughey DB, Bertino JS., Jr. An evaluation of the suitability of intravenous midazolam as an in vivo marker for hepatic cytochrome P4503A activity. Clin Pharmacol Ther. 2003;73:153–8. doi: 10.1067/mcp.2003.23. [DOI] [PubMed] [Google Scholar]
- 7.Heizmann P, Ziegler WH. Excretion and metabolism of 14C-midazolam in humans following oral dosing. Arzneimittelforschung. 1981;31:2220–3. [PubMed] [Google Scholar]
- 8.Muchohi SN, Ward SA, Preston L, Newton CR, Edwards G, Kokwaro GO. Determination of midazolam and its major metabolite 1′-hydroxymidazolam by high-performance liquid chromatography–electrospray mass spectrometry in plasma from children. J Chromatogr B Analyt Technol Biomed Life Sci. 2005;821:1–7. doi: 10.1016/j.jchromb.2005.03.015. [DOI] [PubMed] [Google Scholar]
- 9.Heizmann P, Eckert M, Ziegler WH. Pharmacokinetics and bioavailability of midazolam in man. Br J Clin Pharmacol. 1983;16(Suppl. 1):43S–49S. doi: 10.1111/j.1365-2125.1983.tb02270.x. [DOI] [PMC free article] [PubMed] [Google Scholar]
- 10.Hirata K, Matsumoto Y, Kurokawa A, Onda M, Shimizu M, Fukuoka M, Hirano M, Yamamoto Y. Possibility of influence of midazolam sedation on the diagnosis of brain death: concentrations of active metabolites after cessation of midazolam. Yakugaku Zasshi. 2003;123:811–5. doi: 10.1248/yakushi.123.811. [DOI] [PubMed] [Google Scholar]
- 11.Bauer TM, Ritz R, Haberthur C, Ha HR, Hunkeler W, Sleight AJ, Scollo-Lavizzari G, Haefeli WE. Prolonged sedation due to accumulation of conjugated metabolites of midazolam. Lancet. 1995;346:145–7. doi: 10.1016/s0140-6736(95)91209-6. [DOI] [PubMed] [Google Scholar]
- 12.Siddle DW, Faithfull L, Gleave M, Wright P, Lindsay N, Kohl C. Midazolam is metabolised by UGT1A4 in human hepatocytes and hepatic microsomes. Drug Metab Rev. 2003;35:55. [Google Scholar]
- 13.Klieber S, Hugla S, Ngo R, Arabeyre-Fabre C, Meunier V, Sadoun F, Fedeli O, Rival M, Bourrie M, Guillou F, Maurel P, Fabre G. Contribution of the N-glucuronidation pathway to the overall in vitro metabolic clearance of midazolam in humans. Drug Metab Dispos. 2008;36:851–62. doi: 10.1124/dmd.107.019539. [DOI] [PubMed] [Google Scholar]
- 14.Zhu B, Bush D, Doss GA, Vincent S, Franklin RB, Xu S. Characterization of 1′-hydroxymidazolam glucuronidation in human liver microsomes. Drug Metab Dispos. 2008;36:331–8. doi: 10.1124/dmd.107.017962. [DOI] [PubMed] [Google Scholar]
- 15.Sorich MJ, McKinnon RA, Miners JO, Smith PA. The importance of local chemical structure for chemical metabolism by human uridine 5′-diphosphate-glucuronosyltransferase. J Chem Inf Model. 2006;46:2692–7. doi: 10.1021/ci600248e. [DOI] [PubMed] [Google Scholar]
- 16.Jones IC, Sharman GJ, Pidgeon J. 1H and 13C NMR data to aid the identification and quantification of residual solvents by NMR spectroscopy. Magn Reson Chem. 2005;43:497–509. doi: 10.1002/mrc.1578. [DOI] [PubMed] [Google Scholar]
- 17.Houston JB, Kenworthy KE. In vitro–in vivo scaling of CYP kinetic data not consistent with the classical Michaelis–Menten model. Drug Metab Dispos. 2000;28:246–54. [PubMed] [Google Scholar]
- 18.Shou M, Lin Y, Lu P, Tang C, Mei Q, Cui D, Tang W, Ngui JS, Lin CC, Singh R, Wong BK, Yergey JA, Lin JH, Pearson PG, Baillie TA, Rodrigues AD, Rushmore TH. Enzyme kinetics of cytochrome P450-mediated reactions. Curr Drug Metab. 2001;2:17–36. doi: 10.2174/1389200013338784. [DOI] [PubMed] [Google Scholar]
- 19.Galetin A, Clarke SE, Houston JB. Quinidine and haloperidol as modifiers of CYP3A4 activity: multisite kinetic model approach. Drug Metab Dispos. 2002;30:1512–22. doi: 10.1124/dmd.30.12.1512. [DOI] [PubMed] [Google Scholar]
- 20.Zhang Y, Miki M, Sasagawa K, Kobayashi M, Imai K. The cooperativity of human fetal and adult hemoglobins is optimized: a consideration based on the effectiveness of the Bohr shift. Zoolog Sci. 2003;20:23–8. doi: 10.2108/zsj.20.23. [DOI] [PubMed] [Google Scholar]
- 21.Mori A, Maruo Y, Iwai M, Sato H, Takeuchi Y. UDP-glucuronosyltransferase 1A4 polymorphisms in a Japanese population and kinetics of clozapine glucuronidation. Drug Metab Dispos. 2005;33:672–5. doi: 10.1124/dmd.104.002576. [DOI] [PubMed] [Google Scholar]
- 22.Uchaipichat V, Mackenzie PI, Elliot DJ, Miners JO. Selectivity of substrate (trifluoperazine) and inhibitor (amitriptyline, androsterone, canrenoic acid, hecogenin, phenylbutazone, quinidine, quinine, and sulfinpyrazone) ‘probes’ for human udp-glucuronosyltransferases. Drug Metab Dispos. 2006;34:449–56. doi: 10.1124/dmd.105.007369. [DOI] [PubMed] [Google Scholar]
- 23.Dehal SS, Gagne PV, Crespi CL, Patten CJ. Characterisation of a probe substrate and an inhibitor of UDP glucuronosyltransferase (UGT) 1A4 activity in human liver microsomes (HLM) and cDNA expressed UGT-enzymes. [accessed 27 February 2009]. Available at http://www.bdbiosciences.com/discovery_labware/gentest/products//pdf//1A4_AAPS_S01T056R1.pdf (last.
- 24.Rios GR, Tephly TR. Inhibition and active sites of UDP-glucuronosyltransferases 2B7 and 1A1. Drug Metab Dispos. 2002;30:1364–7. doi: 10.1124/dmd.30.12.1364. [DOI] [PubMed] [Google Scholar]
- 25.Iwuchukwu OF, Nagar S. Resveratrol (trans-resveratrol, 3,5,4′-trihydroxy-trans-stilbene) glucuronidation exhibits atypical enzyme kinetics in various protein sources. Drug Metab Dispos. 2008;36:322–30. doi: 10.1124/dmd.107.018788. [DOI] [PubMed] [Google Scholar]
- 26.Lewis BC, Mackenzie PI, Elliot DJ, Burchell B, Bhasker CR, Miners JO. Amino terminal domains of human UDP-glucuronosyltransferases (UGT) 2B7 and 2B15 associated with substrate selectivity and autoactivation. Biochem Pharmacol. 2007;73:1463–73. doi: 10.1016/j.bcp.2006.12.021. [DOI] [PubMed] [Google Scholar]
- 27.Uchaipichat V, Galetin A, Houston JB, Mackenzie PI, Williams JA, Miners JO. Kinetic modeling of the interactions between 4-methylumbelliferone, 1-naphthol, and zidovudine glucuronidation by udp-glucuronosyltransferase 2B7 (UGT2B7) provides evidence for multiple substrate binding and effector sites. Mol Pharmacol. 2008;74:1152–62. doi: 10.1124/mol.108.048645. [DOI] [PubMed] [Google Scholar]
- 28.Tang W, Stearns RA. Heterotropic cooperativity of cytochrome P450 3A4 and potential drug–drug interactions. Curr Drug Metab. 2001;2:185–98. doi: 10.2174/1389200013338658. [DOI] [PubMed] [Google Scholar]
- 29.Yong WP, Ramirez J, Innocenti F, Ratain MJ. Effects of ketoconazole on glucuronidation by UDP-glucuronosyltransferase enzymes. Clin Cancer Res. 2005;11:6699–704. doi: 10.1158/1078-0432.CCR-05-0703. [DOI] [PubMed] [Google Scholar]
- 30.Asgari M, Back DJ. Effect of azoles on the glucuronidation of zidovudine by human liver UDP-glucuronosyltransferase. J Infect Dis. 1995;172:1634–6. doi: 10.1093/infdis/172.6.1634. [DOI] [PubMed] [Google Scholar]
- 31.Sampol E, Lacarelle B, Rajaonarison JF, Catalin J, Durand A. Comparative effects of antifungal agents on zidovudine glucuronidation by human liver microsomes. Br J Clin Pharmacol. 1995;40:83–6. doi: 10.1111/j.1365-2125.1995.tb04540.x. [DOI] [PMC free article] [PubMed] [Google Scholar]
- 32.Walsky RL, Obach RS. Validated assays for human cytochrome P450 activities. Drug Metab Dispos. 2004;32:647–60. doi: 10.1124/dmd.32.6.647. [DOI] [PubMed] [Google Scholar]
- 33.Jamei M, Rostami-Hodjegan A, Tucker GT. Co-operativity in the in vitro kinetics of cytochrome P450 (CYP) mediated drug metabolism will have minimal impact on in vivo metabolic clearance. Drug Metab Rev. 2006;38:14. [Google Scholar]
- 34.Ehmer U, Vogel A, Schutte JK, Krone B, Manns MP, Strassburg CP. Variation of hepatic glucuronidation: novel functional polymorphisms of the UDP-glucuronosyltransferase UGT1A4. Hepatology. 2004;39:970–7. doi: 10.1002/hep.20131. [DOI] [PubMed] [Google Scholar]