

Abstract
Specialized glucosensing neurons are present in the hypothalamus, some of which neighbor the median eminence, where the blood-brain barrier has been reported leaky. A leaky BBB implies high tissue glucose levels and obviates a role for endothelial glucose transporters in the control of hypothalamic glucose concentration, important in understanding the mechanisms of glucose sensing We therefore addressed the question of blood-brain barrier integrity at the hypothalamus for glucose transport by examining the brain tissue-to-plasma glucose ratio in the hypothalamus relative to other brain regions. We also examined glycogenolysis in hypothalamus because its occurrence is unlikely in the potential absence of a hypothalamus-blood interface. Across all regions the concentration of glucose was comparable at a given plasma glucose concentration and was a near linear function of plasma glucose. At steady-state, hypothalamic glucose concentration was similar to the extracellular hypothalamic glucose concentration reported by others. Hypothalamic glycogen fell at a rate of ∼1.5 μmol/g/h and remained present in substantial amounts. We conclude for the hypothalamus, a putative primary site of brain glucose sensing that: the rate-limiting step for glucose transport into brain cells is at the blood-hypothalamus interface, and that glycogenolysis is consistent with a substantial blood -to- intracellular glucose concentration gradient.
Keywords: blood-brain barrier, glucose transport, glycogen, hypothalamus
Introduction
The brain is remarkable in its dependence on the blood for essentially two energy substrates, i.e. glucose and oxygen. To maintain the brain's high rate of aerobic metabolism, transport of glucose into the brain occurs through regionally selective, bidirectional, facilitated transport (Lund-Andersen 1979; Pardridge 1983; Bradbury 1993). The brain microenvironment is isolated from the plasma by the blood-brain barrier (BBB) formed by tight junctions between vascular endothelial cells, where tightness excludes free diffusion of polar, hydrophilic molecules such as glucose resulting in a constant and significant glucose concentration gradient from blood to brain, i.e. approximately 5 to 1 ((Lund-Andersen 1979) and references therein; (Gruetter et al. 1998) and references therein; (Barros et al. 2007)). Glucose is transported into brain by the major high affinity glucose transporter isoform GLUT1 (Pardridge et al. 1990), distributed between the lumenal and ablumenal membranes of the capillary endothelial cells that comprise the BBB in vivo (Carruthers 1990).
Increases of both GLUT1 synthesis and luminal GLUT1 mediate enhanced glucose transport across the BBB into rat brain in hypoglycemia (Simpson et al. 2007). The integrity of the BBB for glucose transport is therefore expected to profoundly impact the concentration of glucose in the brain microenvironment ((Gruetter et al. 1998) and references therein) and in brain cells that use glucose either as a signaling molecule or energy substrate for phosphorylation and/or whose glucosensing is altered in hyper/hypoglycemia (Mobbs et al. 2001; Levin et al. 2004; Marty et al. 2005; Song and Routh 2005, 2006). This is particularly relevant to the hypothalamus: two hypothalamic glucose-sensing structures, the arcuate nucleus and the ventral medial nucleus neighbor the hypothalamic median eminence, a circumventricular organ that lacks a strict BBB (Fry and Ferguson 2007). It has therefore been suggested that the BBB at the hypothalamus is absent or leaky (Cheunsuang et al. 2006; Mountjoy and Rutter 2007). The potential absence of a diffusion barrier for glucose is expected to lead to elevated hypothalamic glucose concentrations relative to that in other brain regions. The question remains as to what the concentration of glucose in the hypothalamus is since it is a key parameter linking glucose transport and metabolism (Gruetter et al. 1998; Barros et al. 2007), and whether the brain tissue-to-plasma glucose ratio in the hypothalamus is similar to other brain regions that have intact barriers.
When plasma glucose levels reach approximately 2 mM in hypoglycemia, decreases in cerebral metabolic rates of glucose (CMRglc) have been reported to exceed those of oxygen in the conscious rat (Ghajar et al. 1982) indicating that the brain uses other energy substrates, one of which is glycogen. Brain glycogen, a predominantly glial store of glucose equivalents, is an important endogenous energy source to maintain brain cell function when blood-brain glucose transport becomes rate limiting during acute hypoglycemia (Choi et al. 2003; Gruetter 2003). Brain glycogen levels are sensitive to changes in tissue and plasma glucose concentrations (Choi et al. 2003; Morgenthaler et al. 2006) and replete to levels higher than pre-depletion levels in brain following a single episode of hypoglycemia (Choi et al. 2003; Oz et al. 2003).
This rebound in glycogen, known to be neuroprotective through the breakdown into mostly glucose-6-P which is glycolyzed to pyruvate and which has been suggested to support neuronal metabolism in hypoglycemia, most likely in the form of lactate (Gruetter 2003), may affect glucose sensing by specialized neurons as they also respond to lactate (Song and Routh 2005), and this may in part explain loss of physiological counterregulatory defense mechanisms in insulin-induced hypoglycemia in diabetic patients undergoing intensive insulin therapy (Bolli 2003; Criego et al. 2005).
Strong evidence suggests that the hypothalamus is a key region in the brain responsible for hypoglycemia sensing and for triggering physiological counterregulatory defense mechanisms (Borg et al. 1997) and the question remains as to how glycogen metabolism is affected in the putative primary site of glucose sensing, the hypothalamus. The potential absence of a BBB at the hypothalamus is expected to lead to similar concentrations of blood and brain glucose, i.e. glucose phosphorylation will only be limited when plasma glucose approaches the Km of hexokinase (50μM), which is practically impossible and thus glycogenolysis would be unlikely. The present work extends our pioneering NMR spectroscopy data of the relationship between glucose concentration in blood and in the brain by: (1) improving the spatial resolution of the measurements; and (2) by validating previous NMR measurements of glucose and glycogen in brain tissue by a biochemical method.
Therefore, the purpose of this study was: (1) to assess the integrity of the hypothalamic-blood interface relative to other brain regions for the transport of glucose and (2) to examine whether, in support of a functional hypothalamic-blood interface, the hypothalamus exhibits glycogen breakdown. A preliminary report of part of this work has appeared (Poitry-Yamate et al. 2007).
Material and Methods
Animal preparation
The study was performed in accordance with Swiss Federal guidelines for the care and use of laboratory animals and was approved by the ethics committee. Male Sprague-Dawley rats (Charles River, France) weighing between 250-280 grams were fasted overnight with access to water. To enable comparison between biochemical and previous in vivo NMR studies, measurements in the present study were obtained from hypoglycemic, euglycemic and hyperglycemic rats following the same preparatory glycemic procedures carried out for in vivo 1H and 13C NMR experiments (Choi et al. 2001). Briefly, 3 groups of animals were studied at target plasma glucose levels: hypoglycemia (<2 mM), euglycemia (5-10 mM) and hyperglycemia (>10 mM). All animals were initially anesthetized with 4% isoflurane in a 2:1 mixture of nitrous oxide and oxygen during induction. Isoflurane was lowered to 2% during catheterization. Animals were artificially ventilated with a pressure-driven ventilator. For hyperglycemia and hypoglycemia studies, α-chloralose was given as an 80mg/kg bolus followed 10 min later by infusion at a rate of 27mg/kg/h. Hyperglycemic animals were maintained at a level of ∼17mM plasma glucose by adjustment of glucose infusion rate.
Insulin (1U/ml Humulin®; Lilly Inc, Paris, France) was administered to reach a target hypoglycemia condition of plasma glucose < 2mM for 2-3 hours. The duration of hypoglycemia and hyperglycemia before blood sampling and brain fixation was on average 3 and 7 hours, respectively. Because no significant difference was found for total brain glucose and glycogen as a function of plasma glucose between the light anesthetics isoflurane and α-chloralose (Morgenthaler et al., 2006), we elected to use only isoflurane anesthesia in the euglycemic studies. Plasma glucose in euglycemic animals was maintained between 5-10mM by adjustment of glucose infusion rate.
Microwave fixation and brain dissection
After final blood sampling, anesthetized animals underwent focused microwave irradiation of 4kW at 2450 MHz for 2s (Gerling Applied Engineering Inc., CA, USA). 2s was sufficient to provide absorption of microwave energy (and hence heat generation and subsequent temperature rise) between superficial and deep brain regions. Decapitation was performed after microwave fixation. We have established that this approach leads to minimal agonal metabolism as verified from the tissue lactate levels (Morgenthaler et al. 2006). The cortical surface of the brain was then exposed, meninges removed and 5 brain regions of interest were dissected within 2 minutes in the following order: olfactory bulb, hypothalamus, then coronal sections of frontal cortex, hippocampus and cerebellum. Care was taken to consistently take the same region in coronal sections and to keep tissue sample volumes similar, i.e. < 1×3×3mm3 or ∼ between 5-10 mg of wet weight tissue.
Biochemical measurements
Following the determination of wet weight of each freshly dissected brain sample, the sample was immediately immersed in 250 μl of 0.03 M HCl, the contents were homogenized using an ultrasonic homogenizer probe microtip (Bandelin, Berlin, Germany), and immediately divided into two equal volumes, one for determination of free glucose and the second for the determination of digested glycogen plus free glucose.
The release of glucose from glycogen by amyloglucosidase (10mg/ml, Roche Applied Science, Rotkreuz, Switzerland) was performed following the procedure described by Cruz and Dienel (Cruz and Dienel 2002). Samples digested by amyloglucosidase from tissue at euglycemia and hyperglycemia were diluted between 2- to 5-fold in water (pH 7.4) such that spectroscopic absorbance values fell in the middle of the glucose-absorbance calibration curve (see below). Tissue glucose, whether for the background or digested sample, was assayed using Trinder's method (Amplex Red, Invitrogen, Basel, Switzerland) and the samples in the present study were not frozen prior to glucose measurements. Glucose Standards, prepared from commercially available D-glucose, were left at room temperature for ∼3h prior to use. This assay is based on glucose oxidase digestion, forming H2O2 which reacts with peroxidase substrate in the presence of horseradish peroxidase to generate resorufin. All samples, including standards, were brought to pH 7,4 using NaOH and equal volumes of samples and reaction buffer reagent, typically 60 μl, were used. 100μl of the final 120μl solution of (sample + reaction buffer reagent) was transferred under dim room light to a 96 well microplate and left in darkness for 30 minutes at room temperature before absorption measurements. Maximum absorbance was attained at room temperature at λ=560nm, pH>7, 30 min after the reagent was added. Absorbance as a function of D-glucose concentration was measured using a Biotek Powerwave XS spectrophotometer (Bio-Tek Instruments, Inc. Vermont, USA).
Absorbance values of brain glucose and brain glycogen, i.e. the difference between digested and background glucose) were expressed in units of μmol/g wet weight using the equation:
| (Eq 1) |
where Vab is the absorbance value, A is the y-intercept; and B the slope from linear regression plots of absorbance as a function of glucose concentration. H is the starting dilution factor = (mg tissue wet weight) / (250 μl 0.03M HCl + mg tissue wet weight).
Determination of glucose transport kinetics
To allow comparison with previous whole-brain rat NMR results, i.e. under similar experimental conditions and anesthesia protocols, we measured brain glucose as a function of plasma glucose at steady-state and express the relationship as a linear function and report the apparent kinetic constants (Gruetter et al. 1998; Pfeuffer et al. 2000; Choi et al. 2001; Lei and Gruetter 2006) from the linear regression plots of plasma glucose and tissue glucose using the expression:
| (Eq 2) |
Where G is the concentration of glucose by brain region indicated (μmol/g) or in plasma (mmol/L); Vd = 0.77 mL/g, the physical distribution space of water in brain; Tmax is the apparent maximum transport rate, CMRglc is the cerebral metabolic rate of glucose utilization and Kt, the apparent Michaelis-Menten constant. The equation was fitted using OriginPro 7.5
Results
To measure glucose and/or glycogen from small volumes (5-10 μL) of tissue samples, we implemented an enzymatic-absorbance based assay previously used in quantifying hepatic glycogen (Dong et al. 2006) and plasma glucose (Koch and Nipper 1977). This assay was inherently sensitive, and between 0.00095 to ∼ 0.125 mM glucose, with a precision of < 2% (Fig 1). Omission of the Amplex Red reagent (shown by the dotted line) to verify reaction specificity resulted in constant absorbance.
Fig 1.

Sensitivity, linearity and reproducibility of glucose assay using glucose oxidase. Standards of D-glucose ranging from 0.00095 to ∼0.125 mM were linearly related to absorbance of resorufin at 560 nanometers in the presence of reagent (n = 6 replicates). The dotted line corresponds to the fit of the same glucose standards in the absence of reagent (n = 2 replicates). Inset shows regions of non-linearity of assay, starting from arrow.
Tissue glucose concentrations were comparable at a given plasma glucose concentration across all brain regions, averaging 1.6 μmol/g at euglycemia (5-10 mM plasma glucose), 0.2 μmol/g at hypoglycemia (<2mM plasma glucose) and 4.0 μmol/g at hyperglycemia (10-22 mM plasma glucose). In all 5 brain regions the concentration of tissue glucose consistently increased in a nearly linear fashion with plasma glucose concentration (Fig 2). Of particular interest was the 5:1 ratio observed at euglycemia between glucose concentration in blood and hypothalamus (Fig 2). The brain/plasma glucose concentration ratio indicated for each brain region in Fig 2 was similar in the various brain structures and not statistically significant from each other.
Fig 2.
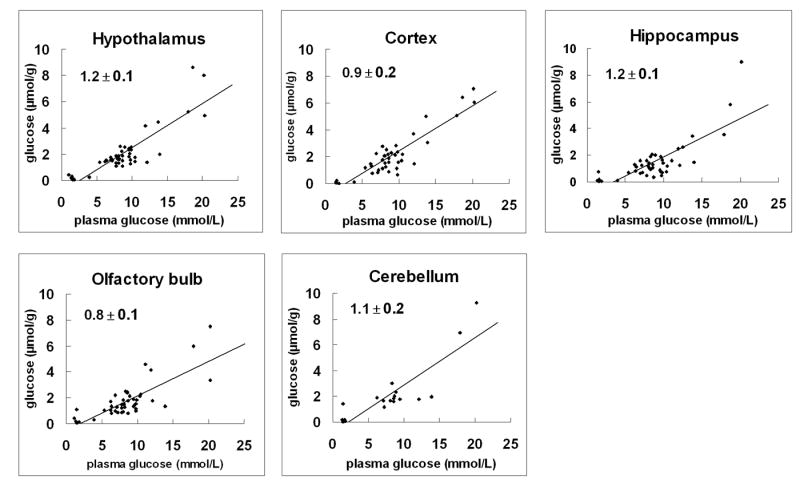
Relationship between brain and plasma glucose concentration from anatomically and functionally distinct brain regions. Regression lines of plots show the best-fit of the model of glucose transport (as described in Material and Methods) to the data points measured biochemically over an extended range of plasma glucose levels (∼ 1.4 to 22 mM). All brain regions showed near linearity. The mean values of the slope ± SD by brain region are indicated. Linear regression plots were then used to determine the kinetic parameters, Kt and Tmax/CMRglc (see text). > 40 independent glucose measurements were performed per brain region except for cerebellum (N = 19).
The relationship between brain and plasma glucose concentration was fit using Equation 2. Values of Tmax/CMRglc varied from 2.5 ± 0.2 (hypothalamus and cortex), 1.9 ± 0.2 (cerebellum). Kt was on the order of a few mM: 3.2 ± 0.9 mM in hippocampus and cortex; 1.5 ± 0.9 mM in olfactory bulb, 0.1 ± 1.0 mM in cerebellum and 2.6 ± 1.1mM in hypothalamus.
The effect of glycemia on glycogen concentration and metabolism in the hypothalamus is shown in Table 1 and compared to 4 other brain regions. After 2 hours of hypoglycemia (< 2mM plasma) glycogen remained present in substantial amounts in all 5 brain regions. Glycogen was reduced from ∼4.5 to ∼1.6 μmol/g, equivalent to a rate of ∼ 0.025 μmol/g/min (for hypothalamus, cortex and cerebellum) and from ∼3.2 to ∼1.8, equivalent to a rate of ∼0.011 μmol/g/min (for olfactory bulb and hippocampus). When plasma glucose was raised to >10 mM from euglycemia, glycogen content increased slightly in all 5 regions and reached statistical significance in olfactory bulb (p < 0.001, Table 1).
Table 1.
Glycogen content by brain region and plasma glucose concentration. Values are mean μmol/g ± SD based on (n measurements). Glycogen content in hypoglycemia and hyperglycemia was compared to that in euglycemia using two-way ANOVA following the Bonferroni post-tests. * indicates a significant difference for P<0.05; ** for P<0.01 and *** for P<0.001.
|
Hypoglycemia <2 mM |
Euglycemia 5-8 mM |
Hyperglycemia >10 mM |
|
|---|---|---|---|
| hypothalamus | 1.9±0.8 (8)*** | 4.4±1.0 (14) | 5.5±1.6 (7) |
| cortex | 0.9±1.2 (5)** | 4.0±1.4 (13) | 5.1±1.9 (9) |
| olfactory bulb | 1.7±1.0 (8) | 2.9±0.8 (16) | 5.1±1.4 (8) *** |
| hippocampus | 1.8±1.5 (7) | 3.4±1.1 (13) | 3.4±1.9 (8) |
| cerebellum | 1.5±1.3 (5)** | 4.4±1.6 (5) | 6.1±1.9(4) |
Levels of tissue glycogen and glucose as a function of plasma glucose for the hypothalamus and cortex are given in Table 1 and Fig 2, and show that in both regions glycogen exceeds glucose levels.
Discussion
We implemented a highly sensitive and reproducible enzyme and absorbance-based assay using glucose oxidase (Fig 1). In conjunction with uniform microwave fixation of superficial and deep brain regions, the enzymatic assay allowed the use of small, 10μl volumes of tissue with minimal partial volume effects. It is important to note that beyond 125 μM glucose, the absorption of resorufin was no longer linear (Fig 1, inset), necessitating care to choose appropriate sample dilutions. We went on to use this biochemical assay to determine whether the brain tissue-to-plasma glucose ratio was similar in the hypothalamus compared to other brain regions of α-chloralose anesthetized rats, and also at hypoglycemia and hyperglycemia.
The linearity shown in Fig 2 by brain region was in excellent agreement with that previously measured for whole brain and lends support to the notion that the whole brain represents the weighted average of the levels of its component parts (Gruetter et al. 1996; Gruetter et al. 1998; Choi et al. 2001; de Graaf et al. 2001; Choi et al. 2002; Lei and Gruetter 2006).
The similar brain tissue-to-plasma glucose ratio between hypothalamus and the other anatomically distinct brain regions (Fig 2) suggests similar glucose transport kinetics. Implicit in all aforementioned glucose transport models is the assumption that: (1) the concentration gradient of glucose is primarily at the entry of glucose into the brain, i.e. the endothelial cells or astrocytic endfoot processes, and (2) that glucose is uniformly distributed in the brain aqueous phase beyond the BBB. Indeed, a ∼5:1 ratio of plasma to tissue glucose concentration at euglycemia across all brain regions, including the hypothalamus (Fig 2) supports the presence of a significant glucose concentration gradient from blood to brain (Gruetter et al. 1992; Gruetter et al. 1996; Gruetter et al. 1998). Total tissue glucose concentrations, which represent extracellular and intracellular glucose levels, have been indirectly assessed from the equilibrium brain/plasma distribution ratio of 3-0-methyl-D-glucose (Gjedde and Diemer 1983; Namba et al. 1987; Dienel et al. 1991; Nakanishi et al. 1996) implying a relative regional uniformity of brain glucose concentrations. However, 3-0-methyglucose differences between the extracellular space and intracellular space have not been established.
We have previously shown that deep anesthesia increases brain glucose content at a given plasma glucose concentration (Choi et al. 2002) and the anesthesia in the present study might have led to an overestimated hypothalamic glucose concentration. However, the presence of a significant blood/brain glucose concentration gradient in anesthetized brain only underlines the presence of a significant diffusion barrier for glucose entry into the hypothalamus.
When comparing the tissue glucose measurements with extracellular, i.e. interstitial glucose measurements in hypothalamus (Fig 3) the two were on the same order of magnitude and clearly lower than the plasma glucose concentration, with the implication that at steady-state, glucose concentrations are similar in the intracellular and extracellular space. This observation strongly suggests a structural and functional transport barrier for glucose entry across the hypothalamus-blood interface. Even if deeper anesthesia was used in some of the extracellular measurements used for Fig 4, the main conclusion is unaffected by the specific degree of anesthesia, since deeper anesthesia tends to reduce the concentration gradient (Choi et al. 2002).
Fig 3.
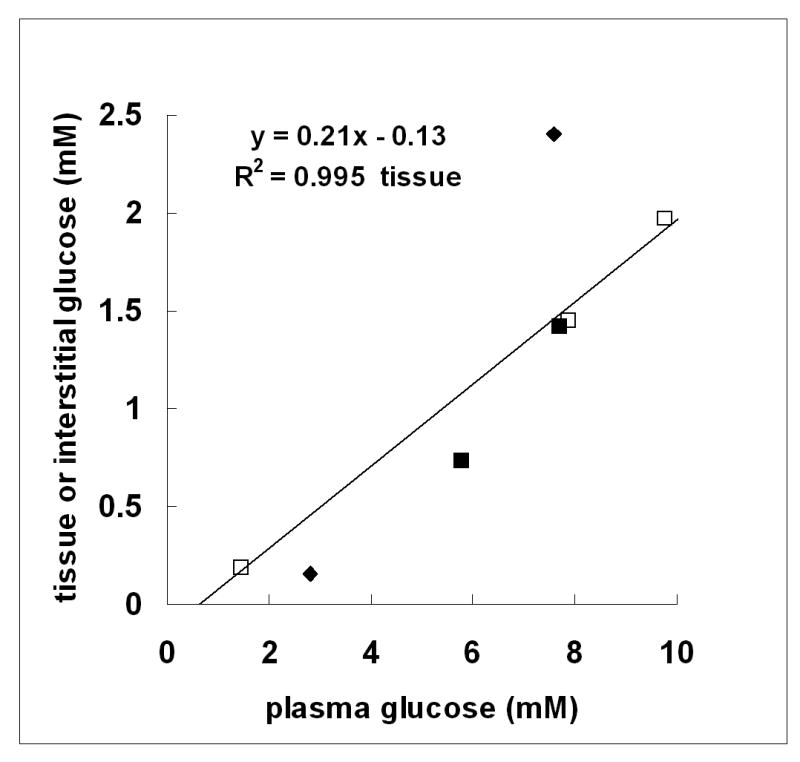
Comparison of tissue and interstitial glucose concentration for hypothalamus as a function of plasma glucose. The concentrations of hypothalamic glucose (open squares) were those determined in the present study (Fig 2) at plasma glucose concentrations (in mM) of 1.5 ± 0.03; 7.9 ± 0.1; 9.8 ± 0.1; n=5 per point. Interstitial glucose concentrations: zero-net flux in unrestrained rats (closed squares) from (de Vries et al. 2003); and implanted glucose microelectrodes in pentobarbital-anesthetized rats (closed triangles) from (Silver and Erecinska 1994). R2 refers to hypothalamic tissue glucose.
In addition to the BBB, other potential routes of entry of glucose into the hypothalamus are indirectly via the cerebrospinal fluid (CSF) (Broadwell et al. 1983) or via transport-independent mechanisms (Faouzi et al. 2007). A significant CSF-to-median eminence exchange that would elevate the concentration of glucose preferentially in hypothalamus is, however, unlikely: immunohistochemical evidence shows low to absent expression of GLUT1 in hypothalamic β2-tanycytes that participate in forming an efficient barrier system between the median eminence and CSF (Peruzzo et al. 2000; Garcia et al. 2001) and influx is expected to be minimal due to a 103-fold lower circumventricular organ surface area relative to that of the BBB (Kastin and Pan 2006).
The relationship established between increased whole brain glucose concentration and reported changes of endothelial GLUT1 protein in sustained hypoglycemia suggests that a normal glucose environment in brain can be created as a consequence of increased GLUT1 expression and up-regulation and/or sequestration of GLUT1 protein at the BBB mediated by ambient glucose concentration (Lei and Gruetter 2006). Such a mechanism is a likely alternative explanation to the observed hypoglycemia unawareness in patients undergoing intensive insulin treatment of diabetes, although sequestration of GLUT1 at the BBB might also allow for acute regulation of glucose transport (Barros et al. 2005). The similar values obtained of kinetic constants for glucose transport at steady-state between whole brain measurements and anatomically and functionally distinct brain regions suggests that such a blunting of normal glucose sensing by the brain may specifically involve increased GLUT1 expression and up-regulation and/or sequestration of GLUT1 protein at the BBB at the hypothalamus, a key glucose sensing region for triggering hypoglycemic counterregulatory defense mechanisms (Borg et al. 1997).
Under euglycemic conditions, the concentration of glycogen in all 5 regions of the brain was higher than that of the corresponding brain glucose (compare Fig 2 and Table 1) suggesting that the brain synthesizes and stores glycogen as a likely reserve supply of energy (Gruetter 2003). Indeed, the finding that 2 hours of severe, acute hypoglycemia did not completely deplete brain glycogen in any brain region studied (Table 1) demonstrates that functionally distinct areas of the brain may survive extended periods of hypoglycemia through glycogenolysis. These observations extend the importance of glycogen as being neuroprotective when BBB glucose transport becomes rate-limiting for glucose metabolism (Choi et al. 2003; Lei and Gruetter 2006; Morgenthaler et al. 2006; Suh et al. 2007). At a plasma glucose concentration of 1.5 mM attained during hypoglycemia in the present study, we estimated a 10% glucose deficit in hypothalamus, cortex and hippocampus. Therefore, glycogenolysis accounts for a substantial fraction of the estimated 10% glucose supply deficit for all reported and estimated glucose metabolic rates (Sokoloff et al. 1977), as previously reported for whole rat brain (Choi et al. 2003).
Similar net glycogen utilization rates in cortex and hippocampus have been reported in unrestrained rats (Herzog et al. 2008), after taking into account differences in the severity and duration of hypoglycemia (1.9 vs 1.5mM; and 3 vs 2 hour). However, in that study the reported glycogenolytic rate was 50% lower than ours in the hypothalamus and this difference cannot be explained by differences in the measured, control glycogen concentrations, which were similar.
In previous brain studies, hyperglycemia was shown to increase glycogen content (Nelson et al. 1968; Swanson et al. 1989; Morgenthaler et al. 2006). Here, a similar trend was observed (Table 1) but not statistically significant for all brain regions. Future studies are needed to establish glycogen levels and brain tissue-to-plasma glucose ratios by brain region in hyperglycemia, which would suggest that tissue glucose itself may affect glycogen levels.
In conclusion, biochemical evidence has been presented in support of a functional hypothalamus-blood interface for the transport of glucose. We speculate that in such an environment, specialized glucosensing neurons in the hypothalamus may effectively monitor and respond to the availability of glucose (for reviews, see (Routh et al. 2004; Marty et al. 2007; McCrimmon 2008)). In this connection, and beyond the BBB, accumulating evidence shows that neuron function is finely modulated by surrounding glia, such that these 2 major cell types interact synergistically (Poitry-Yamate et al. 1995), inviting the question as to the extent the process of glucose sensing is altered by the function of glial cells and glial glycogen.
Acknowledgments
the Centre d'Imagerie Biomédicale (CIBM) of the UNIL, UNIGE, HUG, CHUV and EPFL and the Leenaards and Jeantet Foundations; to Ms Hanne Frenkel for excellent technical support; and to the 2 anonymous reviewers.
Sources of support: NIH grant ROI NS042005 and FNRS grant 3100A70-116220 (R.G.)
Abbreviations
- BBB
blood brain barrier
- CSF
cerebral spinal fluid
References
- Barros LF, Porras OH, Bittner CX. Why glucose transport in the brain matters for PET. Trends Neurosci. 2005;28:117–119. doi: 10.1016/j.tins.2005.01.002. [DOI] [PubMed] [Google Scholar]
- Barros LF, Bittner CX, Loaiza A, Porras OH. A quantitative overview of glucose dynamics in the gliovascular unit. Glia. 2007;55:1222–1237. doi: 10.1002/glia.20375. [DOI] [PubMed] [Google Scholar]
- Bolli GB. Treatment and prevention of hypoglycemia and its unawareness in type 1 diabetes mellitus. Rev Endocr Metab Disord. 2003;4:335–341. doi: 10.1023/a:1027397911746. [DOI] [PubMed] [Google Scholar]
- Borg MA, Sherwin RS, Borg WP, Tamborlane WV, Shulman GI. Local ventromedial hypothalamus glucose perfusion blocks counterregulation during systemic hypoglycemia in awake rats. J Clin Invest. 1997;99:361–365. doi: 10.1172/JCI119165. [DOI] [PMC free article] [PubMed] [Google Scholar]
- Bradbury MW. The blood-brain barrier. Exp Physiol. 1993;78:453–472. doi: 10.1113/expphysiol.1993.sp003698. [DOI] [PubMed] [Google Scholar]
- Broadwell RD, Balin BJ, Salcman M, Kaplan RS. Brain-blood barrier? Yes and no. Proc Natl Acad Sci U S A. 1983;80:7352–7356. doi: 10.1073/pnas.80.23.7352. [DOI] [PMC free article] [PubMed] [Google Scholar]
- Carruthers A. Facilitated diffusion of glucose. Physiol Rev. 1990;70:1135–1176. doi: 10.1152/physrev.1990.70.4.1135. [DOI] [PubMed] [Google Scholar]
- Cheunsuang O, Stewart AL, Morris R. Differential uptake of molecules from the circulation and CSF reveals regional and cellular specialisation in CNS detection of homeostatic signals. Cell Tissue Res. 2006;325:397–402. doi: 10.1007/s00441-006-0162-z. [DOI] [PubMed] [Google Scholar]
- Choi IY, Lei H, Gruetter R. Effect of deep pentobarbital anesthesia on neurotransmitter metabolism in vivo: on the correlation of total glucose consumption with glutamatergic action. J Cereb Blood Flow Metab. 2002;22:1343–1351. doi: 10.1097/01.WCB.0000040945.89393.46. [DOI] [PubMed] [Google Scholar]
- Choi IY, Seaquist ER, Gruetter R. Effect of hypoglycemia on brain glycogen metabolism in vivo. J Neurosci Res. 2003;72:25–32. doi: 10.1002/jnr.10574. [DOI] [PMC free article] [PubMed] [Google Scholar]
- Choi IY, Lee SP, Kim SG, Gruetter R. In vivo measurements of brain glucose transport using the reversible Michaelis-Menten model and simultaneous measurements of cerebral blood flow changes during hypoglycemia. J Cereb Blood Flow Metab. 2001;21:653–663. doi: 10.1097/00004647-200106000-00003. [DOI] [PubMed] [Google Scholar]
- Criego AB, Tkac I, Kumar A, Thomas W, Gruetter R, Seaquist ER. Brain glucose concentrations in patients with type 1 diabetes and hypoglycemia unawareness. J Neurosci Res. 2005;79:42–47. doi: 10.1002/jnr.20296. [DOI] [PubMed] [Google Scholar]
- Cruz NF, Dienel GA. High glycogen levels in brains of rats with minimal environmental stimuli: implications for metabolic contributions of working astrocytes. J Cereb Blood Flow Metab. 2002;22:1476–1489. doi: 10.1097/01.WCB.0000034362.37277.C0. [DOI] [PubMed] [Google Scholar]
- de Graaf RA, Pan JW, Telang F, Lee JH, Brown P, Novotny EJ, Hetherington HP, Rothman DL. Differentiation of glucose transport in human brain gray and white matter. J Cereb Blood Flow Metab. 2001;21:483–492. doi: 10.1097/00004647-200105000-00002. [DOI] [PubMed] [Google Scholar]
- de Vries MG, Arseneau LM, Lawson ME, Beverly JL. Extracellular glucose in rat ventromedial hypothalamus during acute and recurrent hypoglycemia. Diabetes. 2003;52:2767–2773. doi: 10.2337/diabetes.52.11.2767. [DOI] [PubMed] [Google Scholar]
- Dienel GA, Cruz NF, Mori K, Holden JE, Sokoloff L. Direct measurement of the lambda of the lumped constant of the deoxyglucose method in rat brain: determination of lambda and lumped constant from tissue glucose concentration or equilibrium brain/plasma distribution ratio for methylglucose. J Cereb Blood Flow Metab. 1991;11:25–34. doi: 10.1038/jcbfm.1991.3. [DOI] [PubMed] [Google Scholar]
- Dong X, Park S, Lin X, Copps K, Yi X, White MF. Irs1 and Irs2 signaling is essential for hepatic glucose homeostasis and systemic growth. J Clin Invest. 2006;116:101–114. doi: 10.1172/JCI25735. [DOI] [PMC free article] [PubMed] [Google Scholar]
- Faouzi M, Leshan R, Bjornholm M, Hennessey T, Jones J, Munzberg H. Differential accessibility of circulating leptin to individual hypothalamic sites. Endocrinology. 2007;148:5414–5423. doi: 10.1210/en.2007-0655. [DOI] [PubMed] [Google Scholar]
- Fry M, Ferguson AV. The sensory circumventricular organs: brain targets for circulating signals controlling ingestive behavior. Physiol Behav. 2007;91:413–423. doi: 10.1016/j.physbeh.2007.04.003. [DOI] [PubMed] [Google Scholar]
- Garcia MA, Carrasco M, Godoy A, Reinicke K, Montecinos VP, Aguayo LG, Tapia JC, Vera JC, Nualart F. Elevated expression of glucose transporter-1 in hypothalamic ependymal cells not involved in the formation of the brain-cerebrospinal fluid barrier. J Cell Biochem. 2001;80:491–503. [PubMed] [Google Scholar]
- Ghajar JB, Plum F, Duffy TE. Cerebral oxidative metabolism and blood flow during acute hypoglycemia and recovery in unanesthetized rats. J Neurochem. 1982;38:397–409. doi: 10.1111/j.1471-4159.1982.tb08643.x. [DOI] [PubMed] [Google Scholar]
- Gjedde A, Diemer NH. Autoradiographic determination of regional brain glucose content. J Cereb Blood Flow Metab. 1983;3:303–310. doi: 10.1038/jcbfm.1983.45. [DOI] [PubMed] [Google Scholar]
- Gruetter R. Glycogen: the forgotten cerebral energy store. J Neurosci Res. 2003;74:179–183. doi: 10.1002/jnr.10785. [DOI] [PubMed] [Google Scholar]
- Gruetter R, Ugurbil K, Seaquist ER. Steady-state cerebral glucose concentrations and transport in the human brain. J Neurochem. 1998;70:397–408. doi: 10.1046/j.1471-4159.1998.70010397.x. [DOI] [PubMed] [Google Scholar]
- Gruetter R, Novotny EJ, Boulware SD, Rothman DL, Shulman RG. 1H NMR studies of glucose transport in the human brain. J Cereb Blood Flow Metab. 1996;16:427–438. doi: 10.1097/00004647-199605000-00009. [DOI] [PubMed] [Google Scholar]
- Gruetter R, Novotny EJ, Boulware SD, Rothman DL, Mason GF, Shulman GI, Shulman RG, Tamborlane WV. Direct measurement of brain glucose concentrations in humans by 13C NMR spectroscopy. Proc Natl Acad Sci U S A. 1992;89:1109–1112. doi: 10.1073/pnas.89.3.1109. [DOI] [PMC free article] [PubMed] [Google Scholar]
- Herzog RI, Chan O, Yu S, Dziura J, McNay EC, Sherwin RS. Effect of acute and recurrent hypoglycemia on changes in brain glycogen concentration. Endocrinology. 2008;149:1499–1504. doi: 10.1210/en.2007-1252. [DOI] [PMC free article] [PubMed] [Google Scholar]
- Kastin AJ, Pan W. Intranasal leptin: blood-brain barrier bypass (BBBB) for obesity? Endocrinology. 2006;147:2086–2087. doi: 10.1210/en.2006-0208. [DOI] [PubMed] [Google Scholar]
- Koch TR, Nipper HC. Evaluation of automated glucose oxidase methods for serum glucose: comparison to hexokinase of a colorimetric and an electrometric method. Clin Chim Acta. 1977;78:315–322. doi: 10.1016/0009-8981(77)90322-9. [DOI] [PubMed] [Google Scholar]
- Lei H, Gruetter R. Effect of chronic hypoglycaemia on glucose concentration and glycogen content in rat brain: a localized 13C NMR study. J Neurochem. 2006;99:260–268. doi: 10.1111/j.1471-4159.2006.04115.x. [DOI] [PMC free article] [PubMed] [Google Scholar]
- Levin BE, Routh VH, Kang L, Sanders NM, Dunn-Meynell AA. Neuronal glucosensing: what do we know after 50 years? Diabetes. 2004;53:2521–2528. doi: 10.2337/diabetes.53.10.2521. [DOI] [PubMed] [Google Scholar]
- Lund-Andersen H. Transport of glucose from blood to brain. Physiol Rev. 1979;59:305–352. doi: 10.1152/physrev.1979.59.2.305. [DOI] [PubMed] [Google Scholar]
- Marty N, Dallaporta M, Thorens B. Brain glucose sensing, counterregulation, and energy homeostasis. Physiology (Bethesda) 2007;22:241–251. doi: 10.1152/physiol.00010.2007. [DOI] [PubMed] [Google Scholar]
- Marty N, Dallaporta M, Foretz M, Emery M, Tarussio D, Bady I, Binnert C, Beermann F, Thorens B. Regulation of glucagon secretion by glucose transporter type 2 (glut2) and astrocyte-dependent glucose sensors. J Clin Invest. 2005;115:3545–3553. doi: 10.1172/JCI26309. [DOI] [PMC free article] [PubMed] [Google Scholar]
- McCrimmon R. The mechanisms that underlie glucose sensing during hypoglycaemia in diabetes. Diabet Med. 2008;25:513–522. doi: 10.1111/j.1464-5491.2008.02376.x. [DOI] [PubMed] [Google Scholar]
- Mobbs CV, Kow LM, Yang XJ. Brain glucose-sensing mechanisms: ubiquitous silencing by aglycemia vs. hypothalamic neuroendocrine responses. Am J Physiol Endocrinol Metab. 2001;281:E649–654. doi: 10.1152/ajpendo.2001.281.4.E649. [DOI] [PubMed] [Google Scholar]
- Morgenthaler FD, Koski DM, Kraftsik R, Henry PG, Gruetter R. Biochemical quantification of total brain glycogen concentration in rats under different glycemic states. Neurochem Int. 2006;48:616–622. doi: 10.1016/j.neuint.2005.12.034. [DOI] [PMC free article] [PubMed] [Google Scholar]
- Mountjoy PD, Rutter GA. Glucose sensing by hypothalamic neurones and pancreatic islet cells: AMPle evidence for common mechanisms? Exp Physiol. 2007;92:311–319. doi: 10.1113/expphysiol.2006.036004. [DOI] [PubMed] [Google Scholar]
- Nakanishi H, Cruz NF, Adachi K, Sokoloff L, Dienel GA. Influence of glucose supply and demand on determination of brain glucose content with labeled methylglucose. J Cereb Blood Flow Metab. 1996;16:439–449. doi: 10.1097/00004647-199605000-00010. [DOI] [PubMed] [Google Scholar]
- Namba H, Lucignani G, Nehlig A, Patlak C, Pettigrew K, Kennedy C, Sokoloff L. Effects of insulin on hexose transport across blood-brain barrier in normoglycemia. Am J Physiol. 1987;252:E299–303. doi: 10.1152/ajpendo.1987.252.3.E299. [DOI] [PubMed] [Google Scholar]
- Nelson SR, Schulz DW, Passonneau JV, Lowry OH. Control of glycogen levels in brain. J Neurochem. 1968;15:1271–1279. doi: 10.1111/j.1471-4159.1968.tb05904.x. [DOI] [PubMed] [Google Scholar]
- Oz G, Henry PG, Seaquist ER, Gruetter R. Direct, noninvasive measurement of brain glycogen metabolism in humans. Neurochem Int. 2003;43:323–329. doi: 10.1016/s0197-0186(03)00019-6. [DOI] [PubMed] [Google Scholar]
- Pardridge WM. Brain metabolism: a perspective from the blood-brain barrier. Physiol Rev. 1983;63:1481–1535. doi: 10.1152/physrev.1983.63.4.1481. [DOI] [PubMed] [Google Scholar]
- Pardridge WM, Boado RJ, Farrell CR. Brain-type glucose transporter (GLUT-1) is selectively localized to the blood-brain barrier. Studies with quantitative western blotting and in situ hybridization. J Biol Chem. 1990;265:18035–18040. [PubMed] [Google Scholar]
- Peruzzo B, Pastor FE, Blazquez JL, Schobitz K, Pelaez B, Amat P, Rodriguez EM. A second look at the barriers of the medial basal hypothalamus. Exp Brain Res. 2000;132:10–26. doi: 10.1007/s002219900289. [DOI] [PubMed] [Google Scholar]
- Pfeuffer J, Tkac I, Gruetter R. Extracellular-intracellular distribution of glucose and lactate in the rat brain assessed noninvasively by diffusion-weighted 1H nuclear magnetic resonance spectroscopy in vivo. J Cereb Blood Flow Metab. 2000;20:736–746. doi: 10.1097/00004647-200004000-00011. [DOI] [PubMed] [Google Scholar]
- Poitry-Yamate CL, Poitry S, Tsacopoulos M. Lactate released by Muller glial cells is metabolized by photoreceptors from mammalian retina. J Neurosci. 1995;15:5179–5191. doi: 10.1523/JNEUROSCI.15-07-05179.1995. [DOI] [PMC free article] [PubMed] [Google Scholar]
- Poitry-Yamate CL, Frenkel H, Lei H, Gruetter R. Glucose and glycogen content in rat hypothalamus at euglycemia and hypoglycemia. 21st Biennial Meeting of the International-Society-for-Neurochemistry/38th Annual Meeting of the American-Society-for-Neurochemistry; Cancun, MEXICO: Blackwell Publishing; 2007. pp. 117–118. [Google Scholar]
- Routh VH, Song Z, Liu X. The role of glucosensing neurons in the detection of hypoglycemia. Diabetes Technol Ther. 2004;6:413–421. doi: 10.1089/152091504774198133. [DOI] [PubMed] [Google Scholar]
- Silver IA, Erecinska M. Extracellular glucose concentration in mammalian brain: continuous monitoring of changes during increased neuronal activity and upon limitation in oxygen supply in normo-, hypo-, and hyperglycemic animals. J Neurosci. 1994;14:5068–5076. doi: 10.1523/JNEUROSCI.14-08-05068.1994. [DOI] [PMC free article] [PubMed] [Google Scholar]
- Simpson IA, Carruthers A, Vannucci SJ. Supply and demand in cerebral energy metabolism: the role of nutrient transporters. J Cereb Blood Flow Metab. 2007;27:1766–1791. doi: 10.1038/sj.jcbfm.9600521. [DOI] [PMC free article] [PubMed] [Google Scholar]
- Sokoloff L, Reivich M, Kennedy C, Des Rosiers MH, Patlak CS, Pettigrew KD, Sakurada O, Shinohara M. The [14C]deoxyglucose method for the measurement of local cerebral glucose utilization: theory, procedure, and normal values in the conscious and anesthetized albino rat. J Neurochem. 1977;28:897–916. doi: 10.1111/j.1471-4159.1977.tb10649.x. [DOI] [PubMed] [Google Scholar]
- Song Z, Routh VH. Differential effects of glucose and lactate on glucosensing neurons in the ventromedial hypothalamic nucleus. Diabetes. 2005;54:15–22. doi: 10.2337/diabetes.54.1.15. [DOI] [PubMed] [Google Scholar]
- Song Z, Routh VH. Recurrent hypoglycemia reduces the glucose sensitivity of glucose-inhibited neurons in the ventromedial hypothalamus nucleus. Am J Physiol Regul Integr Comp Physiol. 2006;291:R1283–1287. doi: 10.1152/ajpregu.00148.2006. [DOI] [PubMed] [Google Scholar]
- Suh SW, Bergher JP, Anderson CM, Treadway JL, Fosgerau K, Swanson RA. Astrocyte glycogen sustains neuronal activity during hypoglycemia: studies with the glycogen phosphorylase inhibitor CP-316,819 ([R-R*,S*]-5-chloro-N-[2-hydroxy-3-(methoxymethylamino)-3-oxo-1-(phenylmet hyl)propyl]-1H-indole-2-carboxamide) J Pharmacol Exp Ther. 2007;321:45–50. doi: 10.1124/jpet.106.115550. [DOI] [PubMed] [Google Scholar]
- Swanson RA, Yu AC, Sharp FR, Chan PH. Regulation of glycogen content in primary astrocyte culture: effects of glucose analogues, phenobarbital, and methionine sulfoximine. J Neurochem. 1989;52:1359–1365. doi: 10.1111/j.1471-4159.1989.tb09180.x. [DOI] [PubMed] [Google Scholar]