

Abstract
A tetracycline inducible transfectant cell line (3D5) capable of producing soluble and sarkosyl-insoluble assemblies of wild-type human alpha-synuclein (α-Syn) upon differentiation with retinoic acid was used to study the impact of α-Syn accumulation on protein phosphorylation and glycosylation. Soluble proteins from 3D5 cells, with or without the induced α-Syn expression were analyzed by two-dimensional gel electrophoresis and staining of gels with dyes that bind to proteins (Sypro ruby), phosphoproteins (Pro-Q diamond) and glycoproteins (Pro-Q emerald). Phosphoproteins were further confirmed by binding to immobilized metal ion affinity column. α-Syn accumulation caused differential phosphorylation and glycosylation of 16 and 12, proteins, respectively, whose identity was revealed by mass spectrometry. These proteins, including HSP90, have diverse biological functions including protein folding, signal transduction, protein degradation and cytoskeletal regulation. Importantly, cells accumulating α-Syn assemblies with different abilities to bind thioflavin S displayed different changes in phosphorylation and glycosylation. Consistent with the cell-based studies, we demonstrated a reduced level of phosphorylated HSP90 α/β in the substantia nigra of subjects with Parkinson’s disease as compared to normal controls. Together, the results indicate that α-Syn accumulation causes complex cellular responses, which if persist may compromise cell viability.
Keywords: α-Synuclein, phosphoprotein, glycoprotein, proteomics
1. Introduction
Posttranslational modifications of proteins play a prominent role in diverse biological phenomena [1]. The functional status of proteins and peptides in eukaryotic organisms can be regulated by phosphorylation of serine, threonine, and tyrosine residues as well as by glycosylation and other types of modification [2]. It has been estimated that about 30% of cellular proteins are phosphoproteins, and they often have multiple phosphorylation sites [3]. Phosphorylation and glycosylation events can interact and may compete for the same serine and threonine residues of a protein. Alterations in protein glycosylation can facilitate abnormal phosphorylation of the same protein [4].
Aberrantly modified proteins were found in specimens derived from humans with various diseases, including Alzheimer’s disease (AD), Parkinson’s disease (PD) and related synucleinopathies. For example, tau proteins in AD brains were abnormally phosphorylated and glycosylated and accumulated as neurofibrillary tangles [5]. The amount of O-glycosylated proteins increased in neuritic plaques and neurofibrillary tangles [6], and the pattern of glycosylation of cholinesterases [7] or transferrin [8] was changed in AD. Therefore, to have a better understanding of the cellular responses to normal or abnormal stimuli, it is important to compare the level, the type and the extent of modifications of a given protein under normal versus diseased states or under different experimental conditions.
In synucleinopathies, accumulation of alpha-synuclein (α-Syn) assemblies/aggregates in the brain is considered to play an important role in the pathogenesis of disease. These structures, containing α-Syn modified by phosphorylation [9, 10], are regarded as Lewy bodies and Lewy neurites, respectively, based on their distribution in neuronal cell bodies and neurites. Phosphorylated α-Syn was also found in α-Syn aggregates developed in animal models of synucleinopathy [11-13] and in cultured cells overexpressing human α-Syn [14]. It was reported recently that α-Syn can also be modified by O-linked glycosylation [15]. The formation of aggregated α-Syn in synucleinopathies may result from exposure to various factors, including environmental toxins and metals, triplication/duplication of α-Syn gene or missense mutation of α-Syn [16].
Although several reports are available on α-Syn modification/aggregation in cellular models [17], no studies have systematically examined general protein modifications resulting from α-Syn assembly/aggregation. Moreover, most studies utilized cells expressing α-Syn with A53T mutation, since the mutant is more susceptible to self-interaction that results in aggregate formation. In the present study, we used a cell model capable of forming α-Syn aggregates from wild-type human α-Syn to investigate the impact of overexpression and assembly of α-Syn on the level of other proteins and their phosphorylation and glycosylation profiles.
These cells were derived from a recently generated tetracycline-off (TetOff) inducible transfectant of human neuronal lineage and are referred to as 3D5 cells. In the absence of oxidative insults, no α-Syn assemblies were demonstrated in α-Syn overexpressing 3D5 cells without differentiation [18]. In the presence of retinoic acid, which differentiates 3D5 cells to exhibit neuronal phenotypes, the induction of α-Syn expression resulted in a time-dependent accumulation of α-Syn oligomers that differ in solubility and apparent molecular weights. 3D5 cells with the TetOff induction, but not those without the induction, accumulate thioflavin-positive inclusions as well as sarkosyl-insoluble α-Syn. Moreover, filamentous structures reactive with antibodies α-Syn wereto detected only in the induced [19].
In our studies, retinoic acid-differentiated 3D5 cells with or without induced α-Syn expression and after different durations of α-Syn overexpression/assembly were used. Upon separation of proteins by two-dimensional (2-D) gel electrophoresis, the samples were probed with different dyes to stain total proteins, phosphoproteins and glycoproteins. The intensity of such staining of a given spot was measured and compared between different samples. Proteins determined to be affected by accumulation of α-Syn and its assemblies were characterized further by mass spectrometry, and immobilized metal ion affinity chromatography (IMAC) was used to support that Pro-Q diamond-stained proteins are phosphoproteins. The significance of our cell-based studies was investigated by Western blot analysis of brain tissues of human subjects with PD and normal controls, using antibodies to several proteins identified in our cell-based studies.
2. Materials and methods
2.1. Cell Culture
Cells of transfectant 3D5 generated from the human neuroblastoma BE(2)-M17D cell line express wild-type human α-Syn upon TetOff induction [18, 19]. They were seeded in DMEM/10% fetal bovine serum with 400 μg/ml geneticin, 1 μg/ml puromycin and 2 μg/ml tetracycline (Tet). On the day after seeding, the medium was replaced with Neurobasal medium supplemented with B-27, 2 μg/ml Tet and 10 μM retinoic acid to promote neuronal differentiation. Ten days later, α-Syn induction was initiated by exposing cells to Tet-free media.
Cells were harvested either after 14 days or 28 days of TetOff induction. They were homogenized in Tris-buffered saline (TBS)/1 mM EDTA/1 mM EGTA/5 mM Na pyrophosphate/30 mM β-glycerophosphate/30 mM NaF to generate cell lysates. The lysates were centrifuged at 105,000×g for 15 min using a TLA 100.2 rotor in an Optima TLX™ ultracentrifuge (Beckman Coulter Inc., Fullerton, CA) to obtain a buffer-extractable supernatant (SN1) and a buffer-insoluble fraction. The buffer-insoluble fraction was extracted further with 1% sarkosyl to obtain a sarkosyl-insoluble pellet.
2.2. Preparation of brain lysates
Human brain specimens derived from the substantia nigra of 3 individuals with PD and 3 normal controls were provided by Dr. D. W. Dickson (Mayo Clinic, Jacksonville, Florida). The clinical and pathological features of these materials are presented in supplemental table S1. About 40-50 mg of each brain specimen was suspended in 1.5ml of phosphoprotein lysis buffer (Qiagen, Valencia, CA, USA) and homogenized using a tissue homogenizer. The homogenates were placed in ice for 30 min and centrifuged subsequently at 10,000×g for 30 min. The protein concentration of the lysates was determined using the bicinchoninic acid assay (BCA) from Pierce Biotechnology (Rockford, IL). Aliquots of the supernatants were used for the detection of total protein levels by one-dimensional gel electrophoresis and Western blotting.
2.3. One-dimensional gel electrophoresis and Western blotting
Cell lysates, SN1 fractions or IMAC eluates were mixed with tricine-sodium dodecyl sulfate (SDS) sample buffer, and resolved by SDS–polyacrylamide gel electrophoresis (PAGE) using 10-20% Tris-Tricine criterion gels (Bio-Rad). Precision plus protein standards (Bio-Rad, Hercules, CA, USA) were included as molecular weight references. Proteins separated by SDS-PAGE were transferred onto nitrocellulose membranes, incubated with 5% non-fat milk in TBS for 30 min, and then processed for immunolabeling. Membranes were probed with a phosphorylation-independent antibody, Syn1 (BD biosciences, CA, USA), phosphorylation-dependent anti-α-Syn antibody, pS129 (WAKO, VA, USA), anti-14-3-3 β/ζ antibody (Stressgen, MI, USA), anti-β-actin (Sigma-Aldrich, USA), anti-ubiquitin carboxy-terminal hydrolase (PGP9.5) (Biogenesis, Poole, England) or anti-HSP90 α/β antibody (Santacruz Biotechnology Inc., USA). GAPDH and/or β-tubulin were used as loading controls. Secondary antibodies used were horseradish peroxidase-labeled goat anti-rabbit or anti-mouse IgG (Chemicon International Inc., Temecula, CA) at 1:2000 dilutions. The immunoreactivity was visualized with enhanced chemiluminescence (ECL plus, Amersham Pharmacia Biotech, Buckinghamshire, UK) and analyzed by densitometric scanning of X-ray film (Fujifilm, Tokyo, Japan) using MCID software (Imaging Research, Ontario, Canada).
2.3. Thioflavin S binding
The impact of induced α-Syn expression and accumulation on its conformation was analyzed by thioflavin S (ThS) binding assay, which binds proteins with beta conformation and emits fluorescence upon UV illumination. Sarkosyl- insoluble fractions derived from 3D5 cells with or without TetOff induction for 14 or 28 days were resuspended in TBS at pH 7.4 and 320 μg/ml of ThS. The fluorescence was measured at 440 (excitation)/460-600 nm (emission) using a Cary Eclipse fluorescence spectrophotometer (Walnut Creek, CA, USA). After subtraction of background signals from reagent alone, the fluorescent signals from the peak areas were integrated.
2.4. Immobilized metal ion affinity chromatography (IMAC)
Approximately 2.5mg of proteins from SN1 fraction of 3D5 cell lysate and extracts derived from 40-50 mg of brain tissue were used to separate phosphoproteins from non-phosphoproteins by IMAC using a commercial phosphoprotein purification kit (Qiagen, Valencia, CA, USA) according to manufacturer’s recommendations. For subsequent analyses, 10 to 20 μg of phosphoproteins were subjected to one/two-dimensional gel electrophoresis or Western blotting.
2.5. Two-dimensional (2-D) gel electrophoresis
Isoelectric focusing of the SN1 preparation equivalent to 1.5 million cells was carried out using an IPGphor unit (Amersham Biosciences, Uppsala, Sweden), IPG strips of pH 4–7 or pH 3-10 and 10% acrylamide gels. The SN1 fraction was dissolved in lysis buffer (7 M Urea, 2 M thiourea, 2% CHAPS, 40 mM Tris base, 20 mM DTT, 0.5% IPG buffer (Amersham Biosciences, Uppsala, Sweden) and loaded on IPG strips of 11 cm in length (Amersham Biosciences, Uppsala, Sweden) in rehydration buffer (8 M Urea, 2% CHAPS, 0.5% IPG buffer pH 4-7, 2.8 mg/ml DTT and trace amount of bromophenol blue). The IPG strip was rehydrated at 30 V for 12 h and isoelectrically focused as follows: 200 V for 1 h, 500 V for 1 h, 1000 V for 1 h, 1000 V-8000 V linear gradient for 30 min and at 8000 V for a total of 32000 Vh. The IPG strips were equilibrated subsequently in 1% dithiothreitol, 6 M urea, 2% SDS, 0.05 M Tris pH 8.8, and 20% glycerol for 15 min, dipped in the SDS electrophoresis buffer followed by alkylation with iodoacetamide (when mass spectrometry was to be performed on separated proteins) and SDS-PAGE. The second dimensional separation was performed on 10% or 12.5% SDS-polyacrylamide gels at 150 V using the Criterion™ gel electrophoresis system (Bio-Rad Laboratories, USA). Proteins resolved on 2-D gels were subjected to phosphoprotein, glycoprotein or total protein measurements as described below or were transferred onto nitrocellulose membranes for immunoblotting as described above. For image analysis and densitometric evaluation, Image Quant (Molecular Dynamics, USA), Adobe Photoshop and MCID (Imaging Research, Ontario, Canada) software were used.
2.6. Detection of phosphoproteins
Two-D gels were fixed in 45% methanol and 5% acetic acid overnight, washed with three changes of deionized water for 10 to 20 min per wash, followed by incubation in Pro-Q diamond phosphoprotein stain (Molecular Probes) for 180 min. To obtain specific staining, gels were destained with three successive washes of 15% 1, 2-propanediol or 4% acetonitrile in 50 mM sodium acetate, pH 4.0. Images were captured by a Typhoon 9410 variable mode imager (Amersham Biosciences) using a 532 nm laser for excitation and 560 nm longpass filter for emission. Following the image acquisition, gels were stained with Sypro ruby protein stain (Molecular Probes) to detect total protein. The serial dichromatic detections were used to compare relative levels of phosphorylation of a given protein [20, 21].
2.7. Detection of glycoproteins
Pro-Q emerald 300 dye (Molecular Probes) was used to detect glycoprotein as described by others [22, 23]. This dye binds to periodate-oxidized carbohydrate groups, forming a bright green fluorescent signal on glycoproteins. Briefly, proteins separated on 2-D gels were fixed in 50% methanol, and then incubated in 1% periodic acid, 3% acetic acid for 30 min to oxidize the glycans on these proteins to aldehydes. After washing in 3% acetic acid, gels were incubated in a Pro-Q emerald 300 dye solution for 120 min. All steps were carried out at room temperature with gentle agitation. Glycosylated proteins were visualized by UV transillumination in a Fluorchem MultiImage Light Cabinet (Alpha Innotech Corp.) and analyzed using the Alpha Ease FC software version 4.1.0. The gels were then post-stained with fluorescent Sypro ruby stain to detect all proteins. The stained spots were pseudo-colored using imaging software to aid visualization and analysis.
2.8. Detection of total protein
Gels were rinsed in water and stained with Sypro ruby (Molecular probes) overnight on a shaker at room temperature. The gels were then destained in 10% methanol/7% acetic acid for 30 min, and imaged on a Typhoon 9410 variable mode imager (Amersham Biosciences) with a 488 nm excitation and 640 nm band-pass filter for emission.
2.9. Statistical analysis
Data presented are means ± SD. Comparisons between groups were done by the unpaired Student’s t-test. P value less than 0.05 was regarded as statistically significant.
2.10. Protein identification by mass spectrometry
For protein identification, spots containing protein of interest on the Sypro ruby stained 2-D gel were excised. Most spots were analyzed using LCQ-Deca XP Plus (ThermoElectron, San Jose, CA, USA) fitted with a Nanomate 100 Accessory (Advion, Ithaca, NY). They were digested with trypsin (Promega, WI, USA) for 16-20 h at 37°C, and the digested peptides were extracted with 50% acetonitrile (ACN) and 5% formic acid (FA), concentrated via spinning in a SpeedVac concentrator (Savant Instruments, Holbrook NY, USA), solubilized in 0.1% trifluoroacetic acid and adsorbed onto reverse-phase Zip-Tip μC18 (Millipore Corp) micro column. The adsorbed peptides were eluted with 50 % ACN and 0.2 % FA, followed by infusion via the Nanomate 100 into the LCQ Deca XP. The Nanomate 100 was operated in the positive ion mode with gas pressure ranging form 0.55-0.6 psi and probe voltage ranging from 1.5-1.55 kV. All MS/MS spectra acquired were analyzed using the Bioworks Browser, which employs the database search SEQUEST algorithms. The MS/MS data files were correlated to the sequences in the human Swissprot database that had been indexed using the Bioworks 3.2 version of Sequest. Only peptides with XCorr scores higher than 1.5 (+1), 2.0 (+2), or 2.5 (+3) and delta score ≥0.1 were taken into consideration.
A few spots containing proteins that could not be identified with LCQ-Deca XP Plus were analyzed further by nanoLC-ESI-MS/MS using ThermoFinnigan LTQ Orbitrap Hybrid Mass Spectrometer (ThermoElectron Bremen, Germany) coupled to an Eksigent nanoLC-2D HPLC system (Eksigent, Dublin, CA). These proteins were reduced, alkylated and digested with trypsin. The protein digests were loaded onto a 250 nl OPTI-PAK trap (Optimize Technologies, Oregon City, OR) custom packed with Michrom Magic C8 solid phase (Michrom Bioresources, Auburn, CA). Chromatography was performed using 0.2% FA in both the A solvent (98% water/2% ACN) and B solvent (80% ACN/10% isopropanol/10% water), and a 5% B to 45% B gradient through a Michrom packed tip capillary column. The LTQ Orbitrap mass spectrometer experiment was set to perform a FT full scan from 375-1600 m/z with resolution set at 60,000 (at 400 m/z), followed by linear ion trap MS/MS scans on the top five ions. Tandem mass spectra were extracted by BioWorks version 3.2 and analyzed using Mascot (Matrix Science, London, UK; version 2.2.04), Sequest (ThermoFinnigan, San Jose, CA; version 27, rev. 12) and X! Tandem (www.thegpm.org;version 2006.09.15.3). Mascot and X! Tandem were searched with a fragment ion mass tolerance of 0.80 Da and a parent ion tolerance of 10.0 PPM. Sequest was searched with a fragment ion mass tolerance of 0.80 and a parent ion tolerance of 0.0084 Da. Oxidation of methionine and iodoacetamide derivative of cysteine were specified as variable modifications. Scaffold (version Scaffold_2_00_06, Proteome Software Inc., Portland, OR) was used to validate MS/MS based peptide and protein identifications. Protein identifications were accepted if they were at greater than 95.0% probability and contained at least 3 identified peptides. The pI and the molecular weight of proteins identified by mass spectrometry are consistent with those displayed on 2-D gel.
3. Results
In this study, we focused on proteomic analysis of the SN1 fraction from retinoic acid treated cells with or without 14 days or 28 days of induced α-Syn expression. Samples from cells with and without 14 days of induction, are referred to as S+14d and S-14d, respectively, and those with and without 28days of induction are S+28d and S-28d.
3.1. Accumulation of α-Syn oligomers in 3D5 cells overexpressing α-Syn
As demonstrated by Western blotting, the TetOff induced expression of wild-type human α-Syn in retinoic acid-treated 3D5 cells resulted in accumulation of monomeric α-Syn and α-Syn species of molecular weight larger than that of the monomer (Fig. 1A, lysate). As reported earlier [18], the increase in α-Syn expression was also accompanied by an increase in truncated α-Syn (8 kDa and 12 kDa), and increased phosphorylation of monomeric α-Syn (Fig. 1B). Most α-Syn oligomers were recovered in the SN1 (buffer extractable) fraction together with monomers. The oligomers, present only in trace amount in cells with 3 days of induction, were readily detected in cells after one week of induction and the amount increased with longer induction time.
Figure 1. TetOff induced expression of wild-type human α-Syn in 3D5 cells leads to A) α-Syn accumulation and oligomerization B) increased α-Syn phosphorylation.


Lysate and SN1 fraction (buffer soluble) derived from cells induced for α-Syn expression for 14 days (S+14d) or 28 days (S+28d), or from those without induction for the same duration (S-14d, S-28d), were probed with a phosphorylation independent antibody to α-Syn, Syn1, and an antibody to α-Syn phosphorylated at S129, pS129. GAPDH and β-tubulin immunoblots served as loading controls. C) increased Thioflavin S binding is observed in sarkosyl-insoluble samples with longer duration of induction. The fluorescence signals integrated from the peak areas [arbitrary units (au)] were 599.91±71.82, 782.43±62.9, 611.24±96.29, 1127.60±141.40 for S-14d, S+14d, S-28d, S+28d respectively. The difference between the S+28d and S+14d is statistically significant (P < 0.02, n=3, Student’s t-test).
The assembly of filamentous α-Syn involves a change in its conformation from random coil to β structure which decreases its solubility in detergents like sarkosyl [9, 24]. By thioflavin-binding assay (Fig. 1C), sarkosyl-insoluble samples obtained from S+28d displayed more intense fluorescence signals than those in S+14d or non-induced controls. The integrated signals were 599.91±71.82, 782.43±62.9, 611.24±96.29 and 1127.60±141.40for S-14d, S+14d, S-28d and S+28d, respectively. The difference between the S+28d and S+14d is statistically significant (P < 0.02, n=3, Student’s t-test). The results suggest that the 28-day induced cells accumulate more assemblies with β-sheet conformation than the 14-day induced or their non-induced counterparts.
SN1 fractions containing equal amount of proteins (from 1.5×10⁶ cells) from different samples were separated by 2-D gel electrophoresis and probed by Western blotting using antibodies to α-Syn. More α-Syn positive spots were demonstrated in cells with induced α-Syn expression than those without (Fig. 2). Some of these positive spots contained α-Syn of molecular weight) and pI comparable to that of monomeric α-Syn (15 kDa, pI 4.6), whereas some displayed a pI deviated from 4.6 and were not recognized by antibodies specific for the carboxy-end of α-Syn (data not shown). The latter as demonstrated in our recent studies [19] were products of α-Syn posttranslational modification or truncation.
Figure 2. Induced α-Syn expression leads to accumulation of α-Syn and its derivatives exhibiting different isoelectric points and apparent molecular weights.

SN1 fractions from 1.5 × 10⁶ 3D5 cells with or without TetOff induction of α-Syn were separated by 2-D gel electrophoresis and analyzed by Western blotting using Syn1 antibody. S-14d or S-28d: without induction for 14 days or 28 days. S+14d or S+28d: with induction for 14 days or 28days. In the S-14d the spot shown at pI 10 and migrated around 50 kDa is unrelated to α-Syn, since it was not recognized by other antibodies to α-Syn (n=3).
3.2. Phosphorylation of non-Syn proteins arising from α-Syn accumulation
The isoelectric focusing (IEF) was performed initially using IPG strips with pH gradient 3-10 (data not shown). Most proteins migrated between the acidic and neutral regions of the gel. Therefore, to achieve a better resolution of proteins/spots IEF using pH 4-7 IPG strips was performed in subsequent studies. Figure 3 shows typical protein profiles from equal number of non-induced and TetOff-induced 3D5 cells by Sypro ruby staining. Approximately 400 spots were observed in the SN1 fraction from each sample, and 80-85 of these spots were reproducibly detected by Pro-Q diamond staining (Fig. 4).
Figure 3. Profiling of proteins from cells with or without induced α-Syn expression and assembly.

SN1 fractions containing equal amount of protein from 3D5 cells (1.5 × 10⁶) induced to express α-Syn for 14 or 28 days or their non-induced controls were separated by 2-D gel electrophoresis and stained with Sypro ruby stain. About 400 spots were reproducibly observed in each sample. No significant differences were detected between the S-14d and S+14d samples or between the S-28d and S+28d samples.
Figure 4. Profiling of phosphoproteins from cells with or without induced α-Syn expression.

SN1 fractions containing equal amount of protein from 3D5 cells (1.5 × 10⁶) induced to express α-Syn for 14 or 28 days or their non-induced controls were separated by 2-D gel electrophoresis and stained with Pro-Q diamond stain. Eighty to eighty five phosphoprotein spots were reproducibly observed in each sample. Spot numbers indicate phosphoproteins from representative individual gels that show a greater than 2 fold variation upon α-Syn induction for 14 days or 28 days. The identity of proteins in the spots was determined by mass spectrometry.
Densitometric analysis was performed on spots stained with both the Pro-Q diamond and Sypro ruby dyes to measure the relative level of phosphorylated and total proteins in a given spot. Using the densitometric values obtained from analysis of the non-induced controls as references in statistical analysis, we demonstrate that the phosphorylation of several proteins changed as a result of α-Syn overexpression/assembly, and that the pattern of such changes differed between S+14d and S+28d preparations. Of the 80-85 phosphoproteins examined, 31 non-synuclein proteins consistently demonstrated a greater than 2-fold variation in phosphorylation in a minimum of 3 sets of experiments (Fig. 4). These proteins were further characterized by mass spectrometry. Overall, 22 proteins were identified, because some spots contained the same protein (i.e. spots 3, 4 & 6; 8-10; 24 & 25; 39-41). Several sub-regions of a representative Pro-Q diamond dye-stained 2-D gel are included in supplementary Figure 1 to highlight changes of phosphorylation of various spots/proteins in different preparations. In the absence of induced α-Syn expression, the level of phosphorylation of some proteins was changed at different durations of neuronal differentiation (compare S-14d to S-28d). For example, more phosphorylated proteasome subunit α type 3 (spot 5) was detected in the S-28d than the S-14d, but an opposite change was found in transitional endoplasmic reticulum ATPase (TER ATPase, spots 24 & 25). Therefore, to distinguish the impact of α-Syn overexpression/assembly from retinoic acid treatment, it is important to compare non-induced with TetOff induced cells after the same duration of retinoic acid exposure (e.g. S-14d vs. S+14d).
The phosphorylation of ten proteins was significantly higher in the S+14d than the S-14d preparations. They include glycyl-tRNA synthetase (spot 1), dihydropyrimidinase related protein (DRP3, spot 2), elongation factor 1-β (EF1-β, spots 3,4,6), proteasome subunit α type 3 (spot 5), heat shock cognate 71kDa protein (HSC71, spots 12-14), tubulin α-ubiquitous chain (spot 19), nucleophosmin (NPM, spot 23), TER ATPase (spots 24 & 25), endoplasmin precursor (spot 26) and 14-3-3 protein ε (spot 27). It is worth noting that three phosphorylated species of HSC71 were detected in the S+14d but, only one was detected in the S-14d preparations. By 28 days of induction (S+28d), the phosphorylation of most of these proteins (except tubulin) reduced to the level similar to, or lower than, that of S-14d or S-28d.
When compared to the S-28d, 28 days of induced α-Syn expression resulted in a drastic increase in the phosphorylation of γ and β actin (spots 21 and 22), 14-3-3 protein ζ/δ (spots 39-41), ubiquitin carboxy-terminal hydrolase isozyme (UCHL-1, spot 28), glutathione S-transferase P (GST P, spot 29) and peroxiredoxin-2 (Prx-2, spot 30), as well as a moderate increase in the phosphorylation of serum albumin precursor (spots 8-10). Such phosphoproteins (except serum albumin) were not detectable in either the S-28d, S-14d or S+14d samples. Phosphorylation of tubulin β 2 chain (β-tubulin, spot 19) in the S+28d was higher than that in the S-28d.
Decreased phosphorylation was detected in heat shock 70kDa protein 1 and T-complex protein 1 subunit ε in the S+14d preparations, and in elongation factor 1β, proteasome subunit α type 3, HSP90 β, heat shock 70kDa protein 1, 60 kDa heat shock protein, HSC71, nucleophosmin and endoplasmin precursor (HSP90 β member) in the S+28d samples when compared to their corresponding controls. It is worth noting that several Pro-Q diamond-positive proteins spots (i.e. spots 1, 2, 8-10, 18, 19, 30) were not detectable in the IMAC eluates (explained below).
3.3. Separation and confirmation of phosphoproteins using IMAC and 2D gel electrophoresis
To verify that Pro-Q diamond-positive proteins are phosphoproteins the SN1 fraction was separated by IMAC. A portion of the flowthrough (non-phosphorylated proteins) and eluate (phosphoproteins) were separated by 1-D gel electrophoresis and dual stained using Pro-Q diamond and Sypro ruby stain [Fig 5A(i)], or analyzed by Western blotting using antibodies to phosphorylated α-Syn [Fig 5A(ii)]. At equal protein loading (10 μg), samples from the eluate were Pro-Q diamond positive, and only the eluate of S+14d or S+28d displayed phospho-α-Syn immunoreactivity. Such immunoreactivity was detected in the SN1 fraction of S+14d or S+28d and not in those of S-14d and S-28d controls. A portion of the IMAC eluate of SN1 fractions derived from different samples (each contained 20 μg proteins) were separated by 2D-gel electrophoresis and stained with Sypro ruby dye (Fig. 5B). Most Sypro ruby-positive spots have pI and molecular weight consistent with 16 of the proteins identified by mass spectrometry (listed in Table 1). Densitometric analysis of the spots detected in non-induced and induced samples (Fig. 5C; S-14d vs. S+14d and S-28d vs. S+28d) revealed differences in phosphoprotein levels between these samples. The results are in agreement with those derived from Pro-Q diamond staining. However, several Pro-Q diamond-positive proteins, corresponding to glycyl t-RNA synthetase, DRP3, serum albumin precursor, tubulin β-2 chain, tubulin α-ubiquitous chain and Prx-2, were not detected in the IMAC eluate. Moreover, unlike that demonstrated in samples without IMAC, we detected only low and comparable levels of Pro-Q-diamond-positive T-complex protein1 subunit ε in the IMAC eluates derived from S-28d and S+28d samples. In addition, a much smaller difference (2.4 fold) in phosphorylated elongation factor 1β (P24534, spots 3, 4 and 6) was observed between S+14d and S-14d samples after IMAC separation than that demonstrated in those without the IMAC. It is unclear whether these proteins were non-specifically stained by Pro-Q diamond stain or were unable to bind the IMAC due to accessibility. The spot number of Pro-Q diamond-positive proteins from IMAC eluates and their identity are listed in Table 1 (mass spectrometric data are presented in supplementary table S2). The densitometric quantification of the phosphoprotein stain, total protein stain and the ratio derived from such measurement was listed in Table 2. We have confirmed the differential phosphorylation of HSP90, 14-3-3 isoforms, β-actin and PGP9.5 (synonym: UCHL-1) by quantitative Western blotting analysis of equal amounts of the IMAC eluate from different preparations [Fig 5D (i)-(v)].
Figure 5. A) (i) Enrichment of phosphoproteins by IMAC.

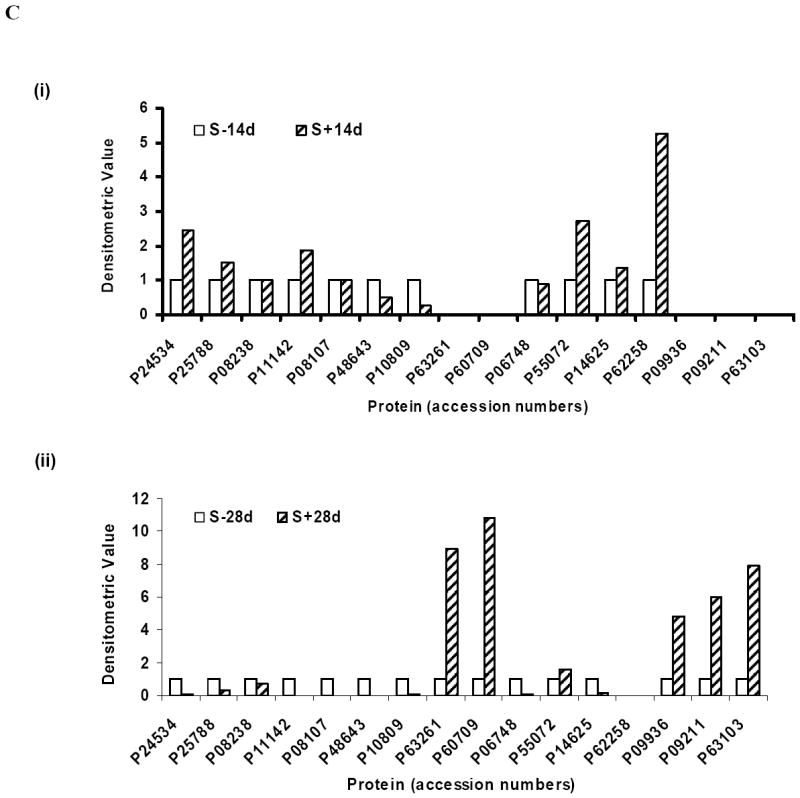
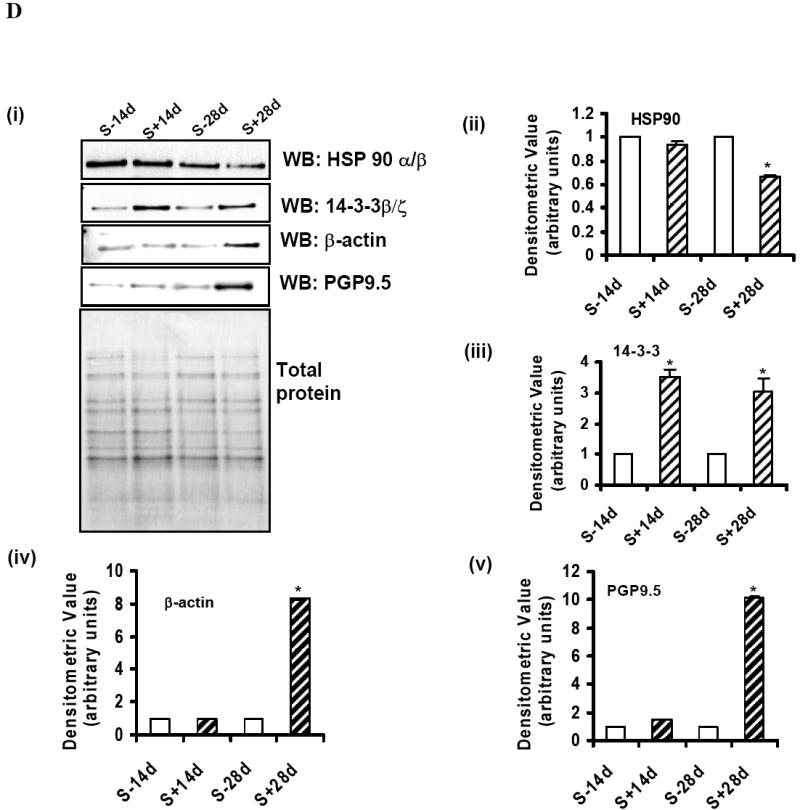

Equal amounts of protein from the IMAC column flowthrough and the eluate were analyzed. The same gel was sequentially stained with Pro-Q diamond and Sypro ruby stains. (ii) Presence of phosphorylated α-Syn in IMAC eluates from samples with α-Syn overexpression. SN1 fractions, IMAC column flowthrough and eluates were probed with phosphorylation-dependent anti-α-synuclein antibody and the same Western blots were reprobed with phosphorylation-independent anti-α-synuclein antibody Syn1. B) Profiling of IMAC column eluted phosphoproteins from cells with or without the accumulation of α-Syn assemblies. Equal amounts of IMAC column eluted phosphoproteins from SN1 fraction of 3D5 cells induced to express α-Syn for 14 or 28 days or their non-induced controls were separated by 2-D gel electrophoresis and stained with Sypro ruby stain. Spot numbers are protein accession numbers that correspond to those shown in Fig. 4 and listed in Table 1. C) Densitometric analysis of phosphoprotein shown in Fig 5B. (i) Samples S-14d and S+14d. (ii) Samples S-28d and S+28d. For comparison, spots from the non-induced were given a value of 1. D) (i) Phosphorylated HSP90 α/β, 14-3-3 β/ζ, β-actin and ubiquitin carboxy-terminal hydrolase (PGP9.5) in IMAC eluates. Eluates from different samples containing equal amounts of proteins were separated by SDS-PAGE and probed with anti-HSP90 α/β, anti-14-3-3 β/ζ, anti-β-actin and anti-PGP9.5 antibodies. (ii)-(v) Densitometric analysis of Western blots. The level of 14-3-3 protein was significantly increased in samples from α-Syn overexpressing cells and that of HSP90 was significantly reduced in S+28d samples. Whereas, β-actin and PGP9.5 were significantly higher in S+28d samples. * = statistically significant (P < 0.05, n=3, Student’s t-test). Comparable protein loading was determined by staining the blots with Ponceau S solution as well as BCA protein assay. E) (i) Protein levels of HSP90 α/β and 14-3-3 β/ζ in the substantia nigra of normal individuals (N) and Parkinson’s disease (PD) patients. Lysates containing equal amount of protein from N and PD samples were separated by SDS-PAGE and probed with anti-HSP90 α/β and anti-14-3-3 β/ζ antibodies. β-tubulin immunoblot served as loading control. (ii) Densitometric analysis of Western blots. Band intensities were normalized using β-tubulin. Alteration in HSP90 α/β and 14-3-3 β/ζ levels were not statistically significant (P>0.05). F) (i) Phosphorylated HSP90 α/β and 14-3-3 β/ζ in IMAC eluates from N and PD brains. Eluates from different samples containing equal amounts of proteins were separated by SDS-PAGE and probed with anti-HSP90 α/β and anti-14-3-3 β/ζ antibodies. (ii) Densitometric analysis of Western blots. The level of HSP90 α/β protein was significantly decreased in PD brains. Alteration in 14-3-3 β/ζ levels were not statistically significant (P>0.05). * = statistically significant (P < 0.05, n≥3, Student’s t-test). Comparable protein loading was determined by staining the blots with Ponceau S solution.
Table 1.
Characteristics of proteins differentially phosphorylated between the induced and non-induced as detected by phosphoprotein specific staining and recoverable in IMAC eluates.
| Spot # | Protein accession # | Identified Protein | Theoretical | Values | % sequence coverage |
|---|---|---|---|---|---|
| pI | Molecular weight (kDa) | ||||
| 3 | P24534 | Elongation factor 1-beta | 4.5 | 24.7 | 63.6 |
| 4 | P24534 | Elongation factor 1-beta | 4.5 | 24.7 | 54.7 |
| 5 | P25788 | Proteasome subunit alpha type 3 | 5.19 | 28.4 | 50.2 |
| 6 | P24534 | Elongation factor 1-beta | 4.5 | 24.7 | 64.4 |
| 11 | P08238 | Heat shock protein HSP-90 beta | 4.97 | 83.20 | 17.7 |
| 12 | P11142 | Heat shock cognate 71 kDa protein | 5.37 | 70.89 | 10.84 |
| 13 | P11142 | Heat shock cognate 71 kDa protein | 5.37 | 70.89 | 25.7 |
| 14 | P11142 | Heat shock cognate 71 kDa protein | 5.37 | 70.89 | 9.29 |
| 15 | P08107 | Heat shock 70kDa protein | 5.48 | 70.03 | 17.63 |
| 16 | P48643 | T-complex protein 1subunit epsilon | 5.45 | 59.60 | 9.8 |
| 17 | P10809 | 60 kDa heat shock protein, mitochondrial precur | 5.70 | 61.05 | 14.31 |
| 21 | P63261 | Actin (gamma actin) | 5.3 | 41.80 | 41.87 |
| 22 | P60709 | Actin (beta-actin) | 5.29 | 41.73 | 31.2 |
| 23 | P06748 | Nucleophosmin | 4.64 | 32.57 | 16.67 |
| 24 | P55072 | Transitional endoplasmic reticulum ATPase | 5.14 | 89.30 | 10.43 |
| 25 | P55072 | Transitional endoplasmic reticulum ATPase | 5.14 | 89.30 | 8.07 |
| 26 | P14625 | Endoplasmin precursor (HSP 90 beta member) | 4.76 | 92.34 | 16.81 |
| 27 | P62258 | 14-3-3 protein epsilon | 4.63 | 29.10 | 20.39 |
| 28 | P09936 | Ubiquitin carboxy-terminal hydrolase isozyme | 5.33 | 24.80 | 39.46 |
| 29 | P09211 | Glutathione S-transferase P | 5.43 | 23.22 | 40.67 |
| 39 | P63103 | 14-3-3 protein zeta/delta | 4.73 | 27.7 | 79.6 |
| 40 | P63103 | 14-3-3 protein zeta/delta | 4.73 | 27.7 | 83.7 |
Table 2. Impact of induced α-Syn expression on the relative amounts of phosphoprotein.
The intensity of Pro-Q diamond stain or that of Sypro ruby stain was measured by densitometric analysis. Statistical analysis was based on 3 or more sets of experiments and unpaired two-tailed t test. SD: standard deviation.
| Protein Accession # | Differentially regulated phosphoprotein | Total stain (S+14d/S-14d) ± SD | Phospho stain (S+14d/S-14d) ± SD | Phospho stain/Total stain (P/T) | Total stain (S+28d/S-28d) ± SD | Phospho stain (S+28d/S-28d) ± SD | Phospho stain/Total stain (P/T) | ||
|---|---|---|---|---|---|---|---|---|---|
| S-14d (P/T) ± SD | S+14d (P/T) ± SD | S-28d (P/T) ± SD | S+28d (P/T) ± SD | ||||||
| P24534 | Elongation factor 1-betaa | 1.01 ± 0.02 | 23.92±3.04* | 0.52 ± 0.07 | 12.36 ± 2.90 | 1.04±0.03 | 0.036±0.01* | 9.90 ± 1.13 | 0.35 ± 0.01 |
| P25788 | Proteasome subunit alpha type 3 | 1.06 ± 0.07 | 2.14±0.64* | 1.69 ± 0.02 | 3.42 ± 0.15 | 0.94±0.03 | 0.15±0.02* | 5.35 ± 0.43 | 0.88 ± 0.01 |
| P08238 | Heat shock protein HSP-90 beta | 0.95 ± 0.02 | 1.24±0.08 | 2.34 ± 0.02 | 2.95 ± 0.14 | 0.96±0.09 | 0.34±0.032* | 1.86 ± 0.01 | 0.66 ± 0.01 |
| P11142 | Heat shock cognate 71 kDa proteina | 1.00 ± 0.03 | 4.07±0.41* | 0.61 ± 0.08 | 2.41 ± 0.19 | 1.03±0.03 | 0.17±0.021* | 1.27 ± 0.01 | 0.22 ± 0.02 |
| P08107 | Heat shock 70kDa protein 1 | 1.04 ± 0.02 | 0.43±0.03 | 1.56 ± 0.05 | 0.73 ± 0.05 | 1.05±0.02 | 0.14±0.016* | 1.98 ± 0.02 | 0.28 ± 0.02 |
| P48643 | T-complex protein 1subunit epsilon | 0.92 ± 0.03 | 0.28±0.05* | 1.64 ± 0.04 | 0.43 ± 0.05 | 1.05±0.02 | 0.90±0.02 | 0.33 ± 0.02 | 0.29 ± 0.02 |
| P10809 | 60 kDa heat shock protein | 1.07 ± 0.02 | 0.44±0.03* | 1.51 ± 0.02 | 0.77 ± 0.04 | 0.95±0.01 | 0.18±0.04* | 0.28 ± 0.01 | 0.05 ± 0.01 |
| P63261 | Actin (gamma actin) | 0.89 ± 0.06 | 1.10±0.08 | 0.10 ± 0.04 | 0.10 ± 0.03 | 0.94±0.05 | 9.52±0.96* | 0.06 ± 0.01 | 0.61 ± 0.01 |
| P60709 | Actin (beta-actin) | 0.99 ± 0.02 | 1.22±0.07 | 0.07 ± 0.02 | 0.09 ± 0.01 | 1.05±0.03 | 12.00±1.06* | 0.07 ± 0.01 | 0.76 ± 0.01 |
| P06748 | Nucleophosmin | 0.89 ± 0.09 | 1.72±0.09 | 12.69 ± 0.74 | 22.36 ± 1.78 | 0.93±0.01 | 0.01±0.003* | 7.20 ± 0.44 | 0.11 ± 0.02 |
| P55072 | Transitional endoplasmic reticulum ATPasea | 0.97 ± 0.01 | 2.09±0.10* | 1.31 ± 0.04 | 3.02 ± 0.37 | 0.95±0.04 | 1.08±0.08 | 0.51 ± 0.01 | 0.58 ± 0.01 |
| P14625 | Endoplasmin precursor (HSP 90 beta member) | 1.07 ± 0.05 | 1.19±0.11 | 3.33 ± 0.17 | 4.18 ± 0.33 | 1.03±0.03 | 0.03±0.002* | 2.93 ± 0.05 | 0.10 ± 0.01 |
| P62258 | 14-3-3 protein epsilon | 1.08 ± 0.03 | 7.42±1.02* | 0.09 ± 0.04 | 0.75 ± 0.04 | 1.03±0.03 | 0.70±0.01 | 0.09 ± 0.02 | 0.06 ± 0.01 |
| P63103 | 14-3-3 protein zeta/deltaa | 0.99 ± 0.06 | 0.92±0.08 | 0.09 ± 0.04 | 0.09 ± 0.02 | 0.99±0.07 | 6.64±0.83* | 0.10 ± 0.02 | 0.64 ± 0.01 |
| P09936 | Ubiquitin carboxy-terminal hydrolase isozyme | 0.92 ± 0.08 | 2.16±0.32 | 0.03 ± 0.02 | 0.07 ± 0.02 | 0.96±0.02 | 14.33±1.23* | 0.06 ± 0.01 | 0.85 ± 0.01 |
| P09211 | Glutathione S-transferase P | 0.96 ± 0.09 | 0.57±0.06 | 0.05 ± 0.02 | 0.03 ± 0.02 | 0.98±0.12 | 13.53±1.40* | 0.04 ± 0.01 | 0.57 ± 0.01 |
Proteins observed as multiple spots in the 2-D gel. Total stain, phospho stain and P/T for these proteins represent the averaged value of all the identified spots.
indicate differences that are >2 fold and statistically significant.
3.4. Phosphorylated HSP90 α/β and 14-3-3β/ζ in human synucleinopathies
To determine whether synucleinopathy-affected human subjects also bear those changes of protein modification identified in our cell-based proteomic analysis, we started by comparing the level of HSP90 α/β and 14-3-3 β/ζ proteins in the substantia nigra region of individuals with PD and age-matched normal controls. Tissue homogenates with and without further separation by IMAC were analyzed by quantitative Western blotting using antibodies to these proteins independent of phosphorylation. In samples without IMAC separation the level of HSP90 and 14-3-3 proteins were comparable between the normal and Lewy body laden specimens [Fig 5E (i) and (ii)]. In IMAC eluates, the level of HSP90 α/β is significantly lower in those from the diseased than that found in the normal controls [Fig 5F (i) and (ii)]. The average level of phosphorylated 14-3-3 β/ζ isoforms from the diseased is higher than that derived from normal controls. However, such change is statistically insignificant (P>0.05).
3.4. Glycosylation of proteins resulted from α-Syn accumulation
Besides phosphoprotein profiling, the glycoprotein profile of SN1 fractions from 3D5 cells was examined. Proteins separated by 2-D gel electrophoresis were stained with Pro-Q emerald glycoprotein stain followed by Sypro ruby stain for total proteins. The glycoprotein spots and the Sypro ruby-stained spots were pseudo-colored to aid visualization (Fig. 6 A and B). About 40 spots were discernible with Pro-Q emerald dye. Eighteen of these spots were shown reproducibly to have a greater than 2 fold change in glycosylation. These proteins were identified by mass spectrometry and listed on Table 3. In supplementary Figure 2 sub-regions of a typical Pro-Q emerald stained gel containing the spots/proteins listed on Table 3 are presented to show changes of the glycoprotein level under different experimental conditions. Similar to the phosphoprotein profiling, the level of several glycoproteins changed after different durations of differentiation without TetOff induction. More glycosylated HSP90 β and endoplasmin precursor proteins were detected in the S-28d than the S-14d samples, and less glycosylated L-lactate dehydrogenase (LDH) B chain, UCHL-1, 14-3-3 protein ε, cytoplasmic 1 actin, Prx-2 and protein disulfide-isomerase A3 precursor were demonstrated in the S-28d than the S-14d preparations.
Figure 6. Profiling of glycoproteins from cells with or without induced α-Syn expression.


An equal amount of protein from 3D5 cells with or without A)14 days or B) 28 days of TetOff induction were separated by 2-D gel electrophoresis and stained with Pro-Q emerald. Spots were pseudo-colored to aid visualization. 40 glycoprotein spots were reproducibly observed in each sample. Spot numbers indicate glycoproteins that show a greater than 2 fold difference between the induced and non-induced control.
Table 3.
Characteristics of proteins differentially glycosylated between samples from the induced and non-induced cells.
| Spot # | Protein accession # | Identified Protein | Theoretical | Values | % sequence coverage |
|---|---|---|---|---|---|
| pI | Molecular weight (kDa) | ||||
| 7 | P07195 | L-lactate dehydrogenase B chain (LDH-B) | 5.71 | 36.63 | 12.61 |
| 11 | P08238 | Heat shock protein HSP-90 beta | 4.97 | 83.20 | 17.7 |
| 26 | P14625 | Endoplasmin precursor (HSP 90 beta member) | 4.76 | 92.34 | 16.8 |
| 27 | P62258 | 14-3-3 protein epsilon | 4.63 | 29.10 | 20.4 |
| 28 | P09936 | Ubiquitin carboxy-terminal hydrolase isozyme | 5.33 | 24.80 | 39.5 |
| 29 | P09211 | Glutathione S-transferase P | 5.43 | 23.22 | 40.7 |
| 30 | P32119 | Peroxiredoxin-2 | 5.66 | 21.76 | 28.4 |
| 31 | Q14697 | Neutral alpha-glucosidase AB precursor | 5.74 | 106.8 | 60.3 |
| 32 | Q14697 | Neutral alpha-glucosidase AB precursor | 5.74 | 106.8 | 63.2 |
| 33 | Q14697 | Neutral alpha-glucosidase AB precursor | 5.74 | 106.8 | 55.2 |
| 34 | P30101 | Protein disulfide-isomerase A3 precursor | 5.98 | 56.7 | 73.7 |
| 35 | P84336 | Actin, cytoplasmic 1 | 5.3 | 41.8 | 74.4 |
| 36 | P19378 | Heat shock cognate 71 kDa protein | 5.24 | 70.8 | 70.7 |
| 37 | P19378 | Heat shock cognate 71 kDa protein | 5.24 | 70.8 | 70.9 |
| 38 | P19378 | Heat shock cognate 71 kDa protein | 5.24 | 70.8 | 72.6 |
| 39 | P63103 | 14-3-3 protein zeta/delta | 4.73 | 27.7 | 79.6 |
| 40 | P63103 | 14-3-3 protein zeta/delta | 4.73 | 27.7 | 83.7 |
| 41 | P63103 | 14-3-3 protein zeta/delta | 4.73 | 27.7 | 82.9 |
All 12 proteins (in 18 spots) we identified were constitutively glycosylated in the S-14d samples. After 14 days of induced α-Syn expression, the level of 6 of these glycosylated proteins [LDH B chain, 14-3-3 protein ε and ζ/δ, actin (cytoplasmic 1), UCHL-1, GST P and Prx-2] were substantially reduced. In contrast, the amount of glycosylated neutral α-glucosidase AB precursor and HSC71 proteins or their isoform appeared comparable among samples S-14d, S+14D and S-28d. In comparison to samples S-28d, those of S+28d contained substantially less glycosylated HSP90 β, HSC71 and neutral α-glucosidase AB precursor. A moderate reduction of glycosylated protein disulfide-isomerase A3 precursor, GST P or actin (cytoplasmic 1) was noted in the S+28d. In contrast, UCHL isozymes were more glycosylated in the S+28d than those of the S-28d preparations.
4. Discussion
In order to decipher the mechanisms involved in α-Syn aggregation, to study the consequence of aggregate assembly/accumulation on cell functions and to develop strategies to interfere with the process of α-Syn aggregation, we recently established a cell model capable of generating α-Syn aggregates from wild-type human α-Syn [18, 19]. In the present proteomic study, differentiated cells with and without induced α-Syn expression were examined. Samples from cells with either 14 days or 28 days of induction were compared to samples from non-induced cells maintained for the same duration in culture. The 2 time-points (14 and 28 days) were based on the findings that substantial amounts of soluble α-Syn oligomers accumulated in cells induced for 14 days, but only after 28 days of α-Syn expression did cells contain more α-Syn assemblies with β-structure. The focus of the study was to identify proteins which show altered steady-state phosphorylation or glycosylation as a result of α-Syn accumulation and assembly.
In the SN1 fractions about 20-25% and 10% of the proteins were stained with Pro-Q diamond and Pro-Q emerald dyes, respectively. The levels of nearly 36% of the phosphoprotein spots and 45% of the glycoprotein spots changed as a consequence of α-Syn accumulation. More than 70% of the Pro-Q diamond detected proteins were recovered in the IMAC eluate, confirming that they are phosphoproteins. Some spots showed changes in the magnitude of phosphorylation mainly in the S+14d and some in the S+28d preparations. Some proteins showed opposite responses on days 14 and 28 following TetOff induction. The results indicate that accumulation of α-Syn can initiate complex cellular reactions. Because cells at 14 versus 28 days of induction contain α-Syn assemblies with different physiochemical properties, we reason that changes taking place at the early and later time points are due to accumulation of α-Syn assemblies having less and more β structure, respectively. There is no evidence to date indicating that α-Syn can activate kinases, inhibit phosphatases, or affect enzymes involved in protein glycosylation. Therefore, the impact of α-Syn on phosphorylation and glycosylation is likely to arise from a cascade of events leading to altered activity and/or level of these enzymes. Although the site of posttranslational modification remains to be determined, the results show that α-Syn accumulation affects proteins involved in diverse biological processes. These proteins can be categorized into seven groups (see Table 5). Because the impacts of phosphorylation and glycosylation on the function of many of these proteins are unknown, the discussion below is limited to those having some information on posttranslational modification and proteins with changes demonstrable in IMAC eluates.
Table 5.
Biological functions of proteins differentially phosphorylated and glycosylated in samples from cells with versus without induced expression of wild-type α-Syn.
I. Proteins involved in translation and elongation
| |
II. Proteins involved in signal transduction
| |
III. Proteins involved in turnover
| |
IV. Proteins involved in α-Syn induced changes in cellular energetics
| |
V. Molecular chaperones modified due to α-Syn accumulation
| |
VI. Cytoskeletal proteins
| |
VII. Other proteins
| |
4.1. α-Syn accumulation-induced modifications of molecular chaperones
In this study, we found the level of phosphorylated HSP90 α/β was reduced significantly in 3D5 cells induced to express α-Syn for 28 days. Similar change of phosphorylated HSP90 α/β was evident in brains affected by synucleinopathy. Heat shock proteins are preferentially synthesized by organisms exposed to heat or other physiological stress although some are synthesized constitutively. Akt-mediated phosphorylation of the HSP90 and HSP70 has been reported to regulate the chaperone function in rat mesangial cells [25]. Although the phosphorylation status of HSP70 was altered during heat stress [26] and exercise [27], the effect of phosphorylation on HSP70 function is not yet understood.
4.2. Proteins involved in signal transduction
In cells overexpressing α-Syn, phosphorylation of two to three members of the 14-3-3 family were affected. The phosphorylated 14-3-3 β/ζ isoforms were found to increase in both S+14d and S+28d samples when compared to their non-induced counterparts. Phosphorylation of specific 14-3-3 isoforms can also regulate their interaction with other proteins [28]. Isoforms of 14-3-3 proteins were reported to interact with α-Syn [29], and Lewy bodies in the Parkinson’s disease brain were shown to display immunoreactivity of 14-3-3 ε and other isoforms [29]. Moreover, soluble complexes of 14-3-3 protein and α-Syn were considered to mediate dopamine-dependent neurotoxicity [30]. In addition, association of 14-3-3 with α-Syn and synphilin was demonstrated in transgenic mice overexpressing mutated human A53T α-synuclein [31].
Our tissue-based studies showed that on average the amount of phosphorylated 14-3-3 β/ζ in PD specimens were about 2 fold of that in normal controls. However, such difference result primarily from its absence in one control and is statistically insignificant. Such variability may be caused by delays in postmortem interval (PMI) and/or agonal state (PMIs for two of the normal brains were 20 and 37 hours. The PMI for the other brains were unknown), which can result in differential protein dephosphorylation. This issue will be addressed further when additional PD and, more importantly, additional normal controls brain samples are available.
4.3. Proteins involved in turnover
The level of phosphorylated UCHL-1 was increased significantly in 3D5 cells induced to express α-Syn for 28 days. It has been reported that ubiquitin-mediated degradation of proteasome subunit Rpn4 is controlled by a phosphorylation-dependent ubiquitylation signal [32], and that interaction between tyrosine kinases and proteasome subunit PSMA7 regulates proteasome degradation (phosphorylation inhibits proteasome activity) [33]. If the turnover of proteasome subunit α 3 was regulated by phosphorylation similar to that shown by Rpn4/PSMA7, the proteasomal activity of cells accumulating soluble oligomers (S+14d) would be compromised, and that of cells with increased accumulation of insoluble α-Syn assemblies (S+28d) would be above normal. Similarly, if phosphorylation of UCHL-1 impacted its function the ubiquitin-proteasome system would be compromised. We have tested this possibility by comparing ubiquitin immunoreactivity of proteins derived from the TetOff-induced cells with that of their non-induced counterparts, but did not find any difference between them (data not shown).
4.4. Cytoskeletal proteins
Phosphorylation of β-actin increased mainly in the S+28d sample. Phosphorylation of actin was reported to affect its assembly and binding to other cellular components, resulting in cytoskeletal reorganization [34]. In this regard, at the light microscopic level, we did not detect morphological differences between cells with and without induced α-Syn expression. Further studies are necessary to determine if the induced and non-induced cells show subtle differences in microtubule and/ or microfilament distribution.
4.5. Glycosylated proteins
Decreased glycosylation of LDH-B was detected in the S+14d and the S+28d samples, whereas decreased glycosylation of neutral α-glucosidase AB precursor was demonstrated in the S+28d sample. Neutral α-glucosidase AB, synonymous with glucosidase II subunit α, is a glycoprotein residing in the endoplasmic reticulum [35]. Glucosidase II, an oligomer of two different subunits α and β, is necessary for the interaction of nascent glycoproteins bearing monoglucosylated carbohydrates with calnexin and calreticulin leading to proper protein folding [36]. The α subunit represents the catalytic domain [37]. Since Glucosidase II shares homology with many other glucosidases, its loss of function may be compensated by other glucosidases present in the cells.
Summary
Accumulation of wild-type α-Syn and its assemblies caused changes in phosphorylation and glycosylation of proteins with diverse biological functions in the current culture paradigm. The ability of these cells to cope with oxidative or other insults may be compromised differently, depending on the progression of α-Syn accumulation and the physiochemical properties of the assembled α-Syn aggregates. A reduction of phosphorylated HSP90 α/β isoforms was demonstrable in brain specimens of PD patients as is evident in the 3D5 cells bearing α-Syn assemblies. The results indicate that further studies of our cell model may improve our understanding of the pathophysiology of synucleinopathy.
Supplementary Material
Table 4. Impact of induced α-Syn expression on the relative amounts of glycoprotein.
The intensity of Pro-Q emerald stain or that of Sypro ruby stain was measured by densitometric analysis. Statistical analysis was performed based on 3 or more sets of studies and unpaired two-tailed t test. SD: standard deviation.
| Protein accession # | Differentially regulated glycoprotein | Total stain (S+14d/S-14d) ± SD | Glycoprotein stain (S+14d/S-14d) ± SD | Glycoprotein stain/Total stain (G/T) | Total stain (S+28d/S-28d) ± SD | Glycoprotein stain (S+28d/S-28d) ± SD | Glycoprotein stain/Total stain (G/T) | ||
|---|---|---|---|---|---|---|---|---|---|
| S-14d (G/T) ± SD | S+14d (G/T) ± SD | S-28d (G/T) ± SD | S+28d (G/T) ± SD | ||||||
| P07195 | L-lactate dehydrogenase B chain | 0.99 ± 0.03 | 0.28 ± 0.02* | 1.13 ± 0.05 | 0.31 ± 0.03 | 0.91 ± 0.05 | 1.34 ± 0.12 | 0.16 ± 0.02 | 0.24 ± 0.02 |
| P08238 | Heat shock protein HSP-90 beta | 1.05 ± 0.02 | 1.04 ± 0.05 | 0.21 ± 0.02 | 0.21 ± 0.03 | 0.97 ± 0.09 | 0.11 ± 0.03* | 0.75 ± 0.03 | 0.08 ± 0.01 |
| P19378 | Heat shock cognate 71 kDa protein a | 1.06 ± 0.04 | 1.23 ± 0.07 | 3.43 ± 0.01 | 3.98 ± 0.26 | 0.94 ± 0.06 | 0.12 ± 0.03* | 3.38 ± 0.16 | 0.44 ± 0.02 |
| P84336 | Actin, cytoplasmic 1 | 0.93 ± 0.06 | 0.15 ± 0.01* | 0.72 ± 0.01 | 0.12 ± 0.04 | 0.94 ± 0.02 | 0.27 ± 0.06* | 0.40 ± 0.02 | 0.11 ± 0.02 |
| P09936 | Ubiquitin carboxy-terminal hydrolase isozyme | 0.93 ± 0.02 | 0.15 ± 0.02* | 0.69 ± 0.05 | 0.11 ± 0.01 | 0.92 ± 0.05 | 20.48 ± 1.86* | 0.03 ± 0.01 | 0.80 ± 0.02 |
| P14625 | Endoplasmin precursor (HSP90 beta member) | 0.98 ± 0.05 | 1.05 ± 0.09 | 0.40 ± 0.03 | 0.44 ± 0.02 | 1.03 ± 0.01 | 0.18 ± 0.03* | 0.80 ± 0.30 | 0.13 ± 0.02 |
| P62258 | 14-3-3 protein epsilon | 0.92 ± 0.01 | 0.11 ± 0.03* | 0.63 ± 0.06 | 0.08 ± 0.01 | 1.06 ± 0.03 | 0.82 ± 0.05* | 0.18 ± 0.03 | 0.14 ± 0.02 |
| P63103 | 14-3-3 protein zeta/delta a | 1.05 ± 0.06 | 0.40 ± 0.03* | 1.52 ± 0.06 | 0.57 ± 0.02 | 1.05 ±0.04 | 3.51 ± 0.21* | 0.61 ± 0.01 | 2.03 ± 0.09 |
| P09211 | Glutathione S-transferase P | 1.10 ± 0.01 | 0.07 ± 0.02* | 1.20 ± 0.03 | 0.07 ± 0.01 | 1.07 ± 0.03 | 0.60 ± 0.12 | 0.58 ± 0.01 | 0.32 ± 0.01 |
| P32119 | Peroxiredoxin-2 | 0.94 ± 0.05 | 0.10 ± 0.02* | 0.47 ± 0.01 | 0.05 ± 0.01 | 1.04 ± 0.01 | 0.76 ± 0.11 | 0.04 ± 0.02 | 0.03 ± 0.01 |
| Q14697 | Neutral alpha-glucosidase AB precursor a | 0.99 ± 0.05 | 1.01 ± 0.03 | 1.61 ± 0.02 | 1.65 ± 0.03 | 0.97 ± 0.04 | 0.15 ± 0.03* | 2.70 ± 0.51 | 0.41 ± 0.03 |
| P30101 | Protein disulfide-isomerase A3 precursor | 1.12 ± 0.01 | 0.44 ± 0.02* | 1.22 ± 0.02 | 0.49 ± 0.13 | 0.93 ± 0.02 | 0.26 ± 0.04* | 0.36 ± 0.02 | 0.10 ± 0.02 |
Proteins observed as multiple spots in the 2-D gel. Total stain, glycoprotein stain and G/T for these proteins represent the averaged value of all the identified spots.
indicate differences that are >2 fold and statistically significant.
Acknowledgments
We thank Dr. Tania Gendron for her comments and critical reading of the manuscript. Mr. Benjamin Madden at Mayo Proteomic Research Center is acknowledged for mass spectrometric analysis. This study was supported by the National Institute of Health (P50-NS40256), the Mayo Foundation (Yen), and the Smith Fellowship Awards from Mayo Clinic (Kulathingal).
Abbreviations
- ACN
acetonitrile
- α-Syn
wild-type alpha-synuclein
- AD
Alzheimer’s disease
- BCA
bicinchoninic acid assay
- 2-D
two-dimensional
- FA
formic acid
- IEF
isoelectric focusing
- IMAC
immobilized metal ion affinity chromatography
- PAGE
polyacrylamide gel electrophoresis
- PD
Parkinson’s disease
- SDS
sodium dodecyl sulfate
- Skp
sarkosyl-insoluble pellet
- SN1
buffer-extractable supernatant
- Tet
tetracycline
- TetOff
tetracycline-off
- ThS
thioflavin S
- TBS
Tris-buffered saline
- WT
wild-type
Footnotes
Publisher's Disclaimer: This is a PDF file of an unedited manuscript that has been accepted for publication. As a service to our customers we are providing this early version of the manuscript. The manuscript will undergo copyediting, typesetting, and review of the resulting proof before it is published in its final citable form. Please note that during the production process errors may be discovered which could affect the content, and all legal disclaimers that apply to the journal pertain.
References
- 1.Hunter T. Protein kinases and phosphatases: the yin and yang of protein phosphorylation and signaling. Cell. 1995;80:225–36. doi: 10.1016/0092-8674(95)90405-0. [DOI] [PubMed] [Google Scholar]
- 2.Reinders J, Sickmann A. State-of-the-art in phosphoproteomics. Proteomics. 2005;5:4052–61. doi: 10.1002/pmic.200401289. [DOI] [PubMed] [Google Scholar]
- 3.Kalume DE, Molina H, Pandey A. Tackling the phosphoproteome: tools and strategies. Curr Opin Chem Biol. 2003;7:64–9. doi: 10.1016/s1367-5931(02)00009-1. [DOI] [PubMed] [Google Scholar]
- 4.Comer FI, Hart GW. O-Glycosylation of nuclear and cytosolic proteins. Dynamic interplay between O-GlcNAc and O-phosphate. J Biol Chem. 2000;275:29179–82. doi: 10.1074/jbc.R000010200. [DOI] [PubMed] [Google Scholar]
- 5.Liu F, Zaidi T, Iqbal K, Grundke-Iqbal I, Gong CX. Aberrant glycosylation modulates phosphorylation of tau by protein kinase A and dephosphorylation of tau by protein phosphatase 2A and 5. Neuroscience. 2002;115:829–37. doi: 10.1016/s0306-4522(02)00510-9. [DOI] [PubMed] [Google Scholar]
- 6.Espinosa B, Guevara J, Hernandez P, Slomianny MC, Guzman A, Martinez-Cairo S, Zenteno E. Characterization of an O-glycosylated plaque-associated protein from Alzheimer disease brain. J Neuropathol Exp Neurol. 2003;62:34–41. doi: 10.1093/jnen/62.1.34. [DOI] [PubMed] [Google Scholar]
- 7.Saez-Valero J, Fodero LR, Sjogren M, Andreasen N, Amici S, Gallai V, Vanderstichele H, Vanmechelen E, Parnetti L, Blennow K, Small DH. Glycosylation of acetylcholinesterase and butyrylcholinesterase changes as a function of the duration of Alzheimer’s disease. J Neurosci Res. 2003;72:520–6. doi: 10.1002/jnr.10599. [DOI] [PubMed] [Google Scholar]
- 8.van Rensburg SJ, Berman PA, Potocnik FC, Taljaard JJ. Glycosylation of transferrin in Alzheimer’s disease and alcohol-induced dementia. Metab Brain Dis. 2000;15:243–7. doi: 10.1023/a:1011162922786. [DOI] [PubMed] [Google Scholar]
- 9.Fujiwara H, Hasegawa M, Dohmae N, Kawashima A, Masliah E, Goldberg MS, Shen J, Takio K, Iwatsubo T. alpha-Synuclein is phosphorylated in synucleinopathy lesions. Nat Cell Biol. 2002;4:160–4. doi: 10.1038/ncb748. [DOI] [PubMed] [Google Scholar]
- 10.Saito Y, Kawashima A, Ruberu NN, Fujiwara H, Koyama S, Sawabe M, Arai T, Nagura H, Yamanouchi H, Hasegawa M, Iwatsubo T, Murayama S. Accumulation of phosphorylated alpha-synuclein in aging human brain. J Neuropathol Exp Neurol. 2003;62:644–54. doi: 10.1093/jnen/62.6.644. [DOI] [PubMed] [Google Scholar]
- 11.Yamada M, Iwatsubo T, Mizuno Y, Mochizuki H. Overexpression of alpha-synuclein in rat substantia nigra results in loss of dopaminergic neurons, phosphorylation of alpha-synuclein and activation of caspase-9: resemblance to pathogenetic changes in Parkinson’s disease. J Neurochem. 2004;91:451–61. doi: 10.1111/j.1471-4159.2004.02728.x. [DOI] [PubMed] [Google Scholar]
- 12.Takahashi T, Yamashita H, Nagano Y, Nakamura T, Ohmori H, Avraham H, Avraham S, Yasuda M, Matsumoto M. Identification and characterization of a novel Pyk2/related adhesion focal tyrosine kinase-associated protein that inhibits alpha-synuclein phosphorylation. J Biol Chem. 2003;278:42225–33. doi: 10.1074/jbc.M213217200. [DOI] [PubMed] [Google Scholar]
- 13.Kuwahara T, Koyama A, Gengyo-Ando K, Masuda M, Kowa H, Tsunoda M, Mitani S, Iwatsubo T. Familial Parkinson mutant alpha-synuclein causes dopamine neuron dysfunction in transgenic Caenorhabditis elegans. J Biol Chem. 2006;281:334–40. doi: 10.1074/jbc.M504860200. [DOI] [PubMed] [Google Scholar]
- 14.Smith WW, Margolis RL, Li X, Troncoso JC, Lee MK, Dawson VL, Dawson TM, Iwatsubo T, Ross CA. Alpha-synuclein phosphorylation enhances eosinophilic cytoplasmic inclusion formation in SH-SY5Y cells. J Neurosci. 2005;25:5544–52. doi: 10.1523/JNEUROSCI.0482-05.2005. [DOI] [PMC free article] [PubMed] [Google Scholar]
- 15.Kim YS, Lee SJ. Novel covalent modifications of alpha-synuclein during the recovery from proteasomal dysfunction. Biochem Biophys Res Commun. 2006;346:1312–9. doi: 10.1016/j.bbrc.2006.06.051. [DOI] [PubMed] [Google Scholar]
- 16.Gasser T. Update on the genetics of Parkinson’s disease. Mov Disord. 2007;22(Suppl 17):S343–50. doi: 10.1002/mds.21676. [DOI] [PubMed] [Google Scholar]
- 17.Orth M, Tabrizi SJ. Models of Parkinson’s disease. Mov Disord. 2003;18:729–37. doi: 10.1002/mds.10447. [DOI] [PubMed] [Google Scholar]
- 18.Takahashi M, Ko LW, Kulathingal J, Jiang P, Sevlever D, Yen SH. Oxidative stress-induced phosphorylation, degradation and aggregation of alpha-synuclein are linked to upregulated CK2 and cathepsin D. Eur J Neurosci. 2007;26:863–74. doi: 10.1111/j.1460-9568.2007.05736.x. [DOI] [PubMed] [Google Scholar]
- 19.Ko L, Ko HC, Lin WL, Kulathingal JG, Yen SH. Aggregates assembled from overexpression of wild-type alpha-synuclein are not toxic to human neuronal cells. J Neuropathol Exp Neurol. 2008 doi: 10.1097/NEN.0b013e31818c3618. In Press. [DOI] [PMC free article] [PubMed] [Google Scholar]
- 20.Liu J, Cai Y, Wang J, Zhou Q, Yang B, Lu Z, Jiao L, Zhang D, Sui S, Jiang Y, Ying W, Qian X. Phosphoproteome profile of human liver Chang’s cell based on 2-DE with fluorescence staining and MALDI-TOF/TOF-MS. Electrophoresis. 2007;28:4348–58. doi: 10.1002/elps.200600696. [DOI] [PubMed] [Google Scholar]
- 21.Nakamura M, Yamada M, Ohsawa T, Morisawa H, Nishine T, Nishimura O, Toda T. Phosphoproteomic profiling of human SH-SY5Y neuroblastoma cells during response to 6-hydroxydopamine-induced oxidative stress. Biochim Biophys Acta. 2006;1763:977–89. doi: 10.1016/j.bbamcr.2006.07.008. [DOI] [PubMed] [Google Scholar]
- 22.Wu J, Lenchik NJ, Pabst MJ, Solomon SS, Shull J, Gerling IC. Functional characterization of two-dimensional gel-separated proteins using sequential staining. Electrophoresis. 2005;26:225–37. doi: 10.1002/elps.200406176. [DOI] [PubMed] [Google Scholar]
- 23.Kanninen K, Goldsteins G, Auriola S, Alafuzoff I, Koistinaho J. Glycosylation changes in Alzheimer’s disease as revealed by a proteomic approach. Neurosci Lett. 2004;367:235–40. doi: 10.1016/j.neulet.2004.06.013. [DOI] [PubMed] [Google Scholar]
- 24.Li HT, Du HN, Tang L, Hu J, Hu HY. Structural transformation and aggregation of human alpha-synuclein in trifluoroethanol: non-amyloid component sequence is essential and beta-sheet formation is prerequisite to aggregation. Biopolymers. 2002;64:221–6. doi: 10.1002/bip.10179. [DOI] [PubMed] [Google Scholar]
- 25.Barati MT, Rane MJ, Klein JB, McLeish KR. A proteomic screen identified stress-induced chaperone proteins as targets of Akt phosphorylation in mesangial cells. J Proteome Res. 2006;5:1636–46. doi: 10.1021/pr0502469. [DOI] [PMC free article] [PubMed] [Google Scholar]
- 26.Cvoro A, Dundjerski J, Trajkovic D, Matic G. The level and phosphorylation of Hsp70 in the rat liver cytosol after adrenalectomy and hyperthermia. Cell Biol Int. 1999;23:313–20. doi: 10.1006/cbir.1998.0247. [DOI] [PubMed] [Google Scholar]
- 27.Gonzalez B, Manso R. Induction, modification and accumulation of HSP70s in the rat liver after acute exercise: early and late responses. J Physiol. 2004;556:369–85. doi: 10.1113/jphysiol.2003.058420. [DOI] [PMC free article] [PubMed] [Google Scholar]
- 28.Aitken A, Baxter H, Dubois T, Clokie S, Mackie S, Mitchell K, Peden A, Zemlickova E. Specificity of 14-3-3 isoform dimer interactions and phosphorylation. Biochem Soc Trans. 2002;30:351–60. doi: 10.1042/bst0300351. [DOI] [PubMed] [Google Scholar]
- 29.Kawamoto Y, Akiguchi I, Nakamura S, Honjyo Y, Shibasaki H, Budka H. 14-3-3 proteins in Lewy bodies in Parkinson disease and diffuse Lewy body disease brains. J Neuropathol Exp Neurol. 2002;61:245–53. doi: 10.1093/jnen/61.3.245. [DOI] [PubMed] [Google Scholar]
- 30.Xu J, Kao SY, Lee FJ, Song W, Jin LW, Yankner BA. Dopamine-dependent neurotoxicity of alpha-synuclein: a mechanism for selective neurodegeneration in Parkinson disease. Nat Med. 2002;8:600–6. doi: 10.1038/nm0602-600. [DOI] [PubMed] [Google Scholar]
- 31.Shirakashi Y, Kawamoto Y, Tomimoto H, Takahashi R, Ihara M. alpha-Synuclein is colocalized with 14-3-3 and synphilin-1 in A53T transgenic mice. Acta Neuropathol. 2006;112:681–9. doi: 10.1007/s00401-006-0132-2. [DOI] [PubMed] [Google Scholar]
- 32.Ju D, Xu H, Wang X, Xie Y. Ubiquitin-mediated degradation of Rpn4 is controlled by a phosphorylation-dependent ubiquitylation signal. Biochim Biophys Acta. 2007;1773:1672–80. doi: 10.1016/j.bbamcr.2007.04.012. [DOI] [PubMed] [Google Scholar]
- 33.Liu X, Huang W, Li C, Li P, Yuan J, Li X, Qiu XB, Ma Q, Cao C. Interaction between c-Abl and Arg tyrosine kinases and proteasome subunit PSMA7 regulates proteasome degradation. Mol Cell. 2006;22:317–27. doi: 10.1016/j.molcel.2006.04.007. [DOI] [PubMed] [Google Scholar]
- 34.Westermann S, Weber K. Post-translational modifications regulate microtubule function. Nat Rev Mol Cell Biol. 2003;4:938–47. doi: 10.1038/nrm1260. [DOI] [PubMed] [Google Scholar]
- 35.Brada D, Kerjaschki D, Roth J. Cell type-specific post-Golgi apparatus localization of a “resident” endoplasmic reticulum glycoprotein, glucosidase II. J Cell Biol. 1990;110:309–18. doi: 10.1083/jcb.110.2.309. [DOI] [PMC free article] [PubMed] [Google Scholar]
- 36.Hammond C, Braakman I, Helenius A. Role of N-linked oligosaccharide recognition, glucose trimming, and calnexin in glycoprotein folding and quality control. Proc Natl Acad Sci U S A. 1994;91:913–7. doi: 10.1073/pnas.91.3.913. [DOI] [PMC free article] [PubMed] [Google Scholar]
- 37.Arendt CW, Ostergaard HL. Two distinct domains of the beta-subunit of glucosidase II interact with the catalytic alpha-subunit. Glycobiology. 2000;10:487–92. doi: 10.1093/glycob/10.5.487. [DOI] [PubMed] [Google Scholar]
Associated Data
This section collects any data citations, data availability statements, or supplementary materials included in this article.