Abstract
Parkinsonism is one of the major neurological symptoms in Wilson disease, and young workers who worked in the copper smelting industry also developed Parkinsonism. We have reported the specific neurotoxic action of copper·dopamine complex in neurons with dopamine uptake. Copper·dopamine complex (100 μm) induces cell death in RCSN-3 cells by disrupting the cellular redox state, as demonstrated by a 1.9-fold increase in oxidized glutathione levels and a 56% cell death inhibition in the presence of 500 μm ascorbic acid; disruption of mitochondrial membrane potential with a spherical shape and well preserved morphology determined by transmission electron microscopy; inhibition (72%, p < 0.001) of phosphatidylserine externalization with 5 μm cyclosporine A; lack of caspase-3 activation; formation of autophagic vacuoles containing mitochondria after 2 h; transfection of cells with green fluorescent protein-light chain 3 plasmid showing that 68% of cells presented autophagosome vacuoles; colocalization of positive staining for green fluorescent protein-light chain 3 and Rhod-2AM, a selective indicator of mitochondrial calcium; and DNA laddering after 12-h incubation. These results suggest that the copper·dopamine complex induces mitochondrial autophagy followed by caspase-3-independent apoptotic cell death. However, a different cell death mechanism was observed when 100 μm copper·dopamine complex was incubated in the presence of 100 μm dicoumarol, an inhibitor of NAD(P)H quinone:oxidoreductase (EC 1.6.99.2, also known as DT-diaphorase and NQ01), because a more extensive and rapid cell death was observed. In addition, cyclosporine A had no effect on phosphatidylserine externalization, significant portions of compact chromatin were observed within a vacuolated nuclear membrane, DNA laddering was less pronounced, the mitochondria morphology was more affected, and the number of cells with autophagic vacuoles was a near 4-fold less.
A possible role of copper in the neurodegeneration of dopaminergic neurons is supported by the fact that patients with neurological Wilson disease, a copper deposition disorder, display a number of extrapyramidal motor symptoms, including Parkinsonism. The cerebral manifestations in neurological Wilson disease are expressed as bradykinesia, rigidity, tremor, dyskinesia, and dysarthria (1). It has been proposed that neurological Wilson disease can be assigned to the group of secondary Parkinsonian syndromes (2). Interestingly, young workers who worked in the copper smelting industry also developed Parkinsonism (3).
Studies performed in rats showed copper (Cu2+)-induced degeneration of dopaminergic neurons in the nigrostriatal system. Likewise, it was described that copper neurotoxicity in rat substantia nigra and striatum is dependent on NAD(P)H dehydrogenase inhibition (4, 5). All of these results support a possible role for copper in the neurodegeneration of dopaminergic neurons.
The general mechanism of toxicity, induced by the reduced form of copper (Cu+) catalyzing the formation of hydroxyl radicals in the presence of hydrogen peroxide through the Fenton reaction, cannot explain the specific degeneration of dopaminergic neurons in Parkinsonism induced in neurological Wilson disease, or in miners working in the copper smelting industry. The selective action of copper can be explained by the ability of copper to form a complex with dopamine, allowing this metal to be transported by cells that have the ability to take up dopamine (6). This specific neurotoxic action of copper in neurons with dopamine uptake is dependent on (i) the ability of copper to form a complex with dopamine (Cu·DA)2 (6, 7), (ii) uptake of Cu·DA complex by dopamine transporters, (iii) oxidation of dopamine to aminochrome, and (iv) one-electron reduction of aminochrome by inhibiting NAD(P)H dehydrogenase (6). These findings may explain the selective neurotoxic action of copper in the brain, but they do not explain the cell death mechanism.
Currently, cell death is divided into three categories: apoptosis, autophagy, and necrosis. At the current time, only apoptosis and autophagic cell death are generally accepted as being legitimate forms of programmed cell death. Alternative models of cell death have therefore been proposed, including para-apoptosis, mitotic catastrophe, oncosis, and pyroptosis (8–12). Necrosis is characterized mostly by the absence of caspase activation, cytochrome c release, and DNA oligonucleosomal fragmentation. Apoptotic cells are characterized by the formation of blebs, chromatin condensation, DNA oligonucleosomal fragmentation, and exposure of phosphatidylserine on the external membrane. This mode of cell death can be dependent or independent of activation of caspases (13). On the other hand, autophagy can be distinguished from apoptosis by sequestration of bulk cytoplasm and organelles in double or multimembrane autophagic vacuoles that then fuse with the lysosomal system. Some of these described mechanisms are related to neurological diseases such as Parkinson disease (14, 15). Cells can use different methods to activate their own destruction, and more than one death program may be activated at the same time (16, 17).
The purpose of this study was to examine the Cu·DA complex-induced cell death mechanism in RCSN-3 cells, a cell line that expresses dopamine, norepinephrine, and serotonin transporters (18, 19).
EXPERIMENTAL PROCEDURES
Chemicals—Dopamine, dicoumarol, menadione, Dulbecco's modified Eagle's medium/Ham's F-12 nutrient mixture (1:1), Hanks' solution, ascorbic acid, tert-butylhydroxytoluene, phosphotungstic acid, thiobarbituric acid, n-butanol, 1,1,3,3-tetramethoxypropane, metaphosphoric acid, and copper sulfate were purchased from Sigma. Calcein AM, ethidium homodimer-1, Annexin V Alexa Fluor 488, JC1 (5,5′,6,6′-tetrachloro-1,1′,3,3′-tetraethylbenzimidazolylcarbocyanine iodide) and Rhod-2AM were purchased from Molecular Probes (Eugene, OR). Cyclosporine, Z-VAD-FMK inhibitor, and DEVD-CHO, o-phthalaldehyde, and N-ethylmaleimide were purchased from Calbiochem. Caspase-3 antibody was purchased from Cell Signaling Co. (Beverly, MA). IgG anti-rabbit biotinylated and Cy-3-conjugated Streptavidin were purchased from Vector Co. Vector green fluorescent protein-light chain 3 (GFP-LC3) was a gift from Dr. Zsolt Tallocky, Columbia University Medical Center. FuGENE HD was purchased from Roche Applied Science. In all experiments performed in this study, 100 μm Cu·DA complex was used. To obtain 100 μm Cu·DA in cell culture medium containing amino acids, which chelate Cu2+ (20), it was necessary to incubate 100 μm dopamine with 1 mm CuSO4 for 2 min (6).
Cell Culture—The RCSN-3 cell line grows in monolayers, with a doubling time of 52 h, a plating efficiency of 21%, and a saturation density of 56,000 cells/cm2 in normal growth media composed of Dulbecco's modified Eagle's medium/Ham's F-12 (1:1), 10% bovine serum, 2.5% fetal bovine serum, 40 mg/liter gentamicin sulfate. The cultures were kept in an incubator at 37 °C with 100% humidity, and the cells grew well in atmospheres of both 5% or 10% CO2 (6, 19, 21).
Incubations—In all experiments performed in this study, we incubated RCSN-3 cells with 100 μm Cu·DA complex or 100 μm Cu·DA complex in the presence of 100 μm dicoumarol. For control conditions, we used 100 μm dopamine, 1 mm CuSO4, or 100 μm dicoumarol incubated alone.
Cell Death—For Cu·DA complex cell death experiments, cells were incubated with cell culture medium but in the absence of bovine serum and phenol red for 0.5, 1, 2, 3, 4, 7, and 12 h. Cell death was measured by counting live and dead cells after staining with 0.5 μm Calcein AM and 5 μm ethidium homodimer-1 for 45 min at room temperature in the dark (LIVE/DEAD viability/cytotoxicity kit, Molecular Probes). Calcein AM is a marker for live cells, and ethidium homodimer-1 intercalates into the DNA of dead cells. Cells were counted with a phase-contrast microscope equipped with fluorescence using the following filters: Calcein AM: 450–490 nm (excitation) and 515–565 nm (emission); ethidium homodimer-1: 510–560 nm (excitation) and LP-590 nm (emission).
GSH/Oxidized Glutathione—The measurement of glutathione was carried out using a fluorometric method (22). The cells were treated with trypsin to 0.3% for 15 min at 37 °C and were washed with PBS. The cells were resuspended in a solution containing 0.1 m phosphate buffer, pH 8, 5 mm EDTA, and 25% metaphosphoric acid and centrifuged at 4000 rpm for 15 min. Glutathione in the supernatant was measured using a fluorometric method (22).
Phosphatidylserine Determination—RCSN-3 cells were incubated as described above for 2 h at 37 °C. Phosphatidylserine externalization was determined by staining the cells with Alexa Fluor 488-labeled annexin V (5 μl of annexin V/100 μl of solution, Vybrant™ Apoptosis Assay Kit #2, Molecular Probes) and 5 μm ethidium homodimer-1 in Annexin Binding Buffer (50 mm HEPES, 700 mm NaCl, 12.5 mm CaCl2, pH 7.4). The cells were incubated at room temperature for 35 min. After the incubation period, the cells were washed with 1× Annexin Binding Buffer, and the samples were kept in darkness. The cells were counted in a phase-contrast microscope equipped with fluorescence. First the cells were counted using fluorescence and then using the following filters: Alexa Fluor 488: 450–490 nm (excitation) and 515–565 nm (emission); ethidium homodimer-1: 510–560 nm (excitation) and LP-590 nm (emission).
Feulgen Staining—The cells were incubated as described above in the absence of bovine serum and phenol red for 3, 4, 7, and 12 h. Cells were fixed in 1 ml of ethanol:acetic acid (3:1) at 4 °C for 1 h and washed with 70% ethanol and distilled water three times for 5 min. The samples were hydrolyzed for 5 min in 5 n HCl at 20 °C and stained by the Feulgen procedure using Schiff reagent (Merck) for 1 h at room temperature in the dark. The samples were rinsed in acid-metabisulfite solution three times for 10 min and two times in water for 5 min before being dehydrated with alcohol (70, 95, and 100%) and air-dried. The cells were analyzed in a phase-contrast microscope equipped with fluorescence using the following filters: 510–560 nm (excitation) and LP-590 nm (emission).
Caspase 3 Activation—RCSN-3 cells were incubated with Cu·DA complex as described above for 7 h were washed and fixed at –20 °C with 1 ml methanol (100%) for 30 min. After washing with PBS and incubation with 1.5% milk for 40 min at room temperature, the cells are incubated with 500 μl of antibodies against activated caspase 3 diluted 1:250 in PBS containing 1% bovine serum albumin and 0.02% sodium azide overnight at 4 °C. After washing, the samples were incubated with biotinylated IgG anti-rabbit, diluted 1:500 for 90 min at room temperature under dark conditions. The samples were washed and incubated with Cy-3-conjugated Streptavidin at 1.5 μg/ml diluted in PBS for 1 h. To determine the specificity of caspase 3 activation, we used 50 μm Z-VAD-FMK and 100 μm DEVD-CHO preincubated for 1 h before the cells were stained with caspase 3.
DNA Laddering—RCSN-3 cells were incubated as described above for 1, 2, 3, 4, 7, and 12 h. The medium was removed, and the cells were be incubated in 90 μl of 10% SDS and 810 μl of buffer TE (10 mm Tris-HCl, 1 mm EDTA, pH 8) for 2–5 min at room temperature. As a positive control, 100 μm menadione was used. The extracted cells were placed in a tube containing 900 μl of saturated phenol and centrifuged at 14,000 rpm for 10 min at 4 °C. The aqueous phase was extracted by addition of 900 μl of saturated phenol and centrifuged at 14,000 rpm for 10 min at 4 °C. This procedure was performed twice. The aqueous phase was mixed with 900 μl of 24:1 chloroform:isoamilic ethanol and centrifuged at 14,000 rpm for 10 min 4 °C. The aqueous phase was removed and resuspended in 90 μl of 3 m sodium acetate, pH 5.2, and isopropanol to fill the tube, incubated at –20 °C for 24 h, and centrifuged at 14,000 rpm for 15 min at 4 °C. The pellet was resuspended in 70% ethanol and centrifuged at 14,000 rpm for 10 min at 4 °C. The precipitate was dried at room temperature and resuspended in TE. The amount of DNA was measured spectrophotometrically, and 4 μg was run on an agarose gel. Electrophoresis was carried out in 2.5% agarose gels in TBE buffer (45 mm Tris-base, 45 mm boric acid, and 1.6 mm EDTA).
Determination of Mitochondrial Membrane Potential—RCSN-3 cells were incubated as described above for 2 h at 37 °C. The cells were incubated in the dark for 40 min at room temperature with freshly prepared 1.5 μg/ml JC-1 (5,5′,6,6′-tetrachloro-1,1′,3,3′-tetraethylbenzimidazolylcarbocyanine iodide) in PBS and then washed three times with PBS. The cells were observed immediately after labeling using a confocal microscope to quantify the intensity of fluorescence simultaneously for the green monomeric form at 488 nm (excitation) and 510–525 nm (emission) and for red fluorescent aggregates-JC1 at 543 nm (excitation) and 570 nm (emission). Background images were obtained from a cell-free section of the coverslip. A ratio image generated by dividing the fluorescence intensity at 590 nm by the fluorescence intensity at 527 nm is reported as a relative mitochondrial membrane electric potential value (23).
Transmission Electron Microscopy—Cells incubated as described above were pelleted and fixed with 3% glutaraldehyde in 0.1 m cacodylate buffer, pH 7.4, for 120 min, washed three times and post-fixed in osmium tetroxide 1% for 60 min. The cells were dehydrated in an ascending ethanol battery ranging from 20% to 100%, and were later placed in 3:1, 2:1, 1:1, 1:2, and 1:3 ratios of propylene oxide or epom-812 resin for 1 h at room temperature, respectively. Ultrathin sections of 70 nm were made and impregnated with 2% uranyl acetate and Reynold's lead citrate. The sections were visualized in a Zeiss EM-900 transmission electron microscope at 50 kV and photographed. The negatives were scanned at 600 × 600 dpi resolution, and the images obtained were analyzed later with a PC-compatible computer using customized software.
GFP-LC3 Plasmid Transfection—Cells were grown in culture medium in 24-well plates for 48 h after being transfected with GFP-LC3 plasmid (gift from Dr. Zsolt Tallocky). To form the transfection complex, we used 2 μl of FuGENE HD transfection reagent (Roche Applied Science) and 0.5 μg of GFP-LC3 plasmid DNA in 25 μl of total volume of medium for each plate, kept in darkness the for 15 min. Thereafter, the transfection complex in 150 μl of culture medium was added to each plate, and the mixture was incubated for 1 h. Then, 350 μl of culture medium was added to each plate and cultured for 2 days.
Determination of GFP-LC3 and Rodamine-2AM Colocalization—GFP-LC3-transfected RCSN-3 cells were grown to 60% confluence on coverslips (25-mm diameter) and incubated with cell culture medium alone or in the presence of 3 μm Rhodamine-2AM for 1.5 h. The cells were visualized on a confocal microscope (LSM-410 Axiovert-100, Zeiss). GFP-LC3 fluorescence was determined by using an excitation wavelength of 488 nm and an emission wavelength of 510–525 nm. Rhodamine-2AM fluorescence was determined using 543 and 570 for excitation and emission, respectively.
Data Analysis—All data are expressed as mean ± S.E. values. Statistical significance was assessed using ANOVA for multiple comparisons and Student's t test for comparison between two given groups.
RESULTS
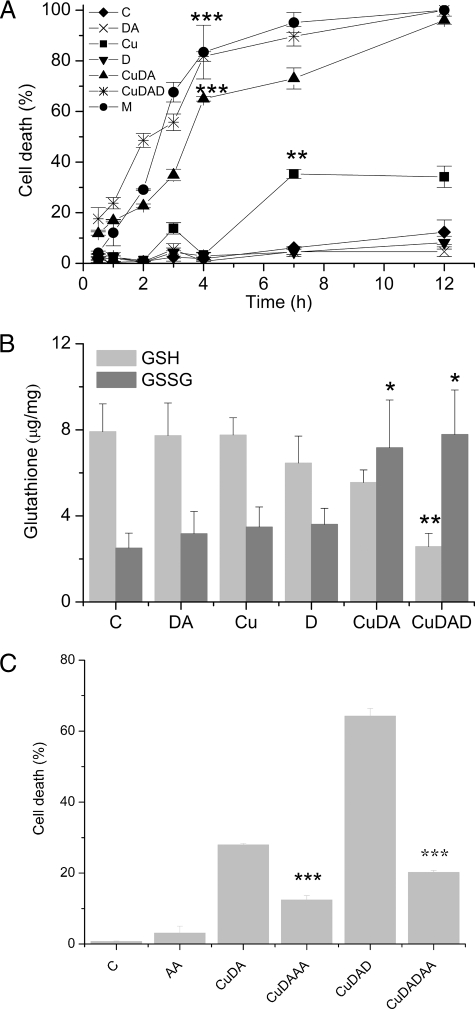
Cell Death—A rapid linear increase in the cell death of RCSN-3 cells was observed when the cells were incubated with 100 μm Cu·DA complex in the presence of 100 μm dicoumarol for 4 h (82 ± 2% cell death, p < 0.001) This was followed by a slower increase in cell death between 4 and 12 h. Similarly, a slower cell death was induced by the incubation of cells with 100 μm Cu·DA complex alone, in which case a linear increase until 4 h (65 ± 1% cell death, p < 0.001) was also observed. Interestingly, the incubation of cells with 1 mm CuSO4 alone induced only moderate cell death and only after 7-h incubation (35 ± 2% cell death, p < 0.01). No significant cell death was observed when the cells were incubated with 100 μm dopamine or 100 μm dicoumarol alone (Fig. 1A). The oxidized glutathione levels significantly increased when the cells were incubated with 100 μm Cu·DA complex in the absence or presence of 100 μm dicoumarol (187%, p < 0.05 and 211%, p < 0.05, respectively). Likewise, the levels of reduced glutathione decreased significantly when the cells were incubated with 100 μm Cu·DA complex in the presence of 100 μm dicoumarol (67% decrease, p < 0.01) (Fig. 1B). To determine whether the redox state was involved in Cu·DA complex-induced cell death, we incubated the cells in the presence of 500 μm ascorbic acid for 2 h. A significant decrease in the cell death was observed in the presence of ascorbic acid in cells treated with Cu·DA complex in the absence or presence of dicoumarol (56%, p < 0.001 and 69%, p < 0.001, respectively) (Fig. 1C).
FIGURE 1.
The effect of Cu·DA complex RCSN-3 cells. A, cell death. The cells were incubated with cell culture medium (C), 100 μm dopamine (DA), 1 mm CuSO4 (Cu), 100 μm dicoumarol (D), 100 μm Cu·DA complex (CuDA), 100 μm Cu·DA complex, 100 μm menadione (M), and 100 μm dicoumarol (CuDAD) for time intervals ranging from 0.5 to 12 h as described under “Experimental Procedures.” The values are expressed as the mean ± S.D., n = 3. The statistical significance for both Cu·DA and Cu·DAD with respect the control at 4 h was assessed using ANOVA for multiple comparisons and Student's t test (***, p < 0.001). B, level of GSH/oxidized glutathione. RCSN-3 cells were treated with 1 mm CuSO4 (Cu), 100 μm dopamine (DA), 100 μm dicoumarol (D), 100 μm Cu·DA complex (CuDA), 100 μm Cu·DA complex and 100 μm dicoumarol (CuDAD) for 2 h. For a control condition, the cells were incubated with cell culture medium (C). The level of GSH and oxidized glutathione was determined as described under “Experimental Procedures.” The values are expressed as the mean ± S.D., n = 3. The statistical significance was assessed using ANOVA for multiple comparisons and Student's t test (*, p < 0.05; **, p < 0.01). C, effect of ascorbic acid on cell death. RCSN-3 cells were treated with 500 μm ascorbic acid (AA), 100 μm Cu·DA complex (CuDA), 100 μm Cu·DA complex in the presence of 500 μm vitamin C (CuDAAA), 100 μm Cu·DA complex and 100 μm dicoumarol (CuDAD), 100 μm Cu·DA complex and 100 μm dicoumarol in the presence of 500 μm ascorbic acid (CuDADAA) for 2 h. For a control condition, the cells were incubated with cell culture medium (C). The values are expressed as the mean ± S.D., n = 3. The statistical significance was assessed using ANOVA for multiple comparisons and Student's t test (***, p < 0.001).
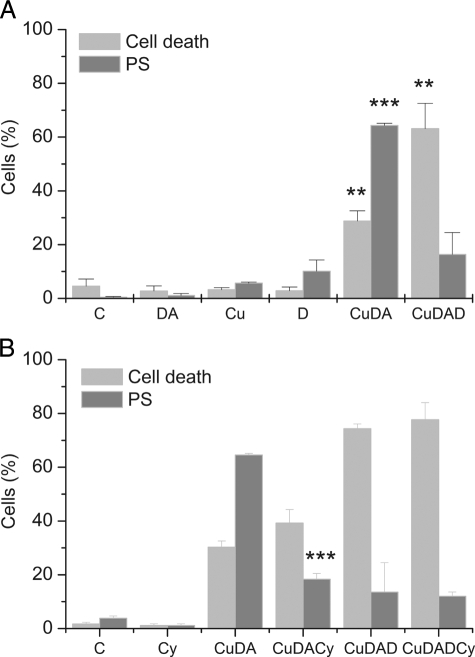
Phosphatidylserine Externalization—The externalizations of phosphatidylserine and ethidium homodimer-1, as a marker for cell death, were detected in cells incubated for 2 h. The incubation of the cells with 100 μm Cu·DA complex in the presence of 100 μm dicoumarol did not induce a significant increase in the externalization of phosphatidylserine (16 ± 8%) despite the significant cell death (63 ± 9, p < 0.01). These results contrast with a significant increase in phosphatidylserine externalization (64 ± 1%, p < 0.001) with a moderate cell death (29 ± 4%, p < 0.01) induced by Cu·DA complex alone. No significant changes in phosphatidylserine externalization and cell death were observed when the cells were treated with 100 μm dopamine, 100 μm dicoumarol, or 1 mm CuSO4 alone (Fig. 2A).
FIGURE 2.
Phosphatidylserine externalization of and cell death in RCSN-3 cells. A, the cells grown in medium (C) were incubated for 2 h with 100 μm dopamine (DA), 1 mm CuSO4 (Cu), 100 μm Cu·DA complex (CuDA), 100 μm Cu·DA complex and 100 μm dicoumarol (CuDAD). B, the cells in cell culture medium (C) were incubated for 2 h with 5 μm cyclosporine (Cs), 100 μm Cu·DA complex (CuDA), 100 μm Cu·DA complex and 5 μm cyclosporine (CuDACs), 100 μm Cu·DA complex and 100 μm dicoumarol (CuDAD), 100 μm Cu·DA complex, 100 μm dicoumarol, and 5 μm cyclosporine (CuDADCs). The values are expressed as the means ± S.E., n = 3. Statistical significance was assessed using ANOVA for multiple comparisons and Student's t test (**, p < 0.01; ***, p < 0.001).
Caspase 3 Activation—The caspase 3 activation was determined in cells incubated for 7 h with Cu·DA complex. We detected caspase 3 activation in cells treated with 100 μm Cu·DA complex in the absence and presence of 100 μm dicoumarol, and in cells treated with 100 μm menadione. However, the activation observed in cells treated with Cu·DA complex was not specific, because both 50 μm Z-VAD-FMK and 100 μm DEVD-CHO only inhibited menadione-induced caspase 3 activation (81%, p < 0.001 and 94%, p < 0.001, respectively).
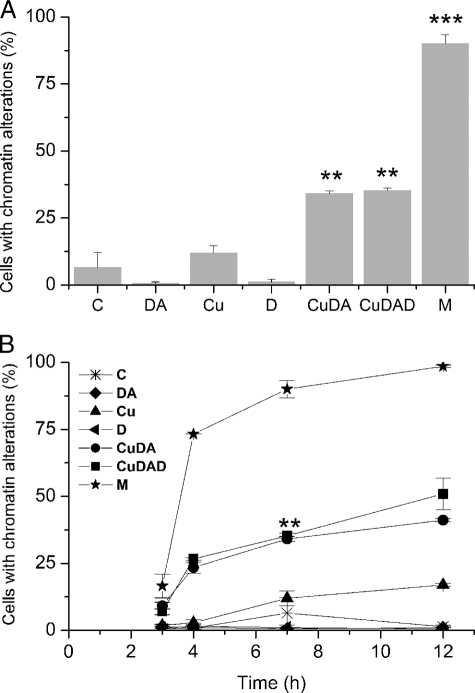
Chromatin Alterations—Chromatin alterations were measured by staining cell nuclei with Feulgen. A significant increase in cells with chromatin alterations was observed when the cells were incubated with 100 μm Cu·DA complex in the absence (34 ± 9%, p < 0.01) and in the presence of 100 μm dicoumarol (35 ± 9%, p < 0.01) at 7 h. No chromatin alterations were observed when the cells were treated with 100 μm dopamine, 100 μm dicoumarol, or 1 mm CuSO4 alone. The positive control of 100 μm menadione exhibited a significant increase of chromatin alterations (90 ± 3%, p < 0.001 (Fig. 3A)). Like to the positive control with menadione, chromatin alterations observed in cells treated with Cu·DA complex in the presence and absence of 100 μm dicoumarol continuously increased from 3 to 12 h (Fig. 3B).
FIGURE 3.
Chromatin alterations determined with Feulgen. A, RCSN-3 cells were treated with 100 μm dopamine (DA), 1 mm CuSO4 (Cu), 100 μm dicoumarol (D), 100 μm Cu·DA complex (CuDA), 100 μm Cu·DA complex and 100 μm dicoumarol (CuDAD) for 7 h, and the chromatin alterations were determined. The control cells were incubated with cell culture medium (C) and for a positive control; the cells were incubated with 100 μm menadione (M). B, the cells were treated under the same condition as in A but the chromatin alterations were determined at different times. Statistical significance in A (**, p < 0.01; ***, p < 0.001) and B (**, p < 0.01 for both Cu·DA and Cu·DAD) with respect to the control was assessed using ANOVA for multiple comparisons and Student's t test. The values are the means ± S.E., n = 3.
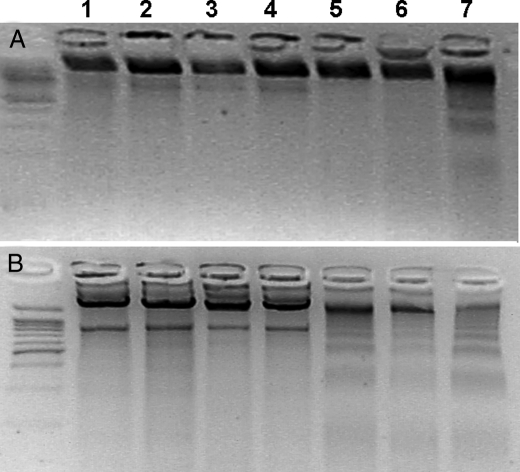
DNA Fragmentation—To determine the formation of small fragments resulting from DNA fragmentation, we used a DNA laddering technique after incubation of the cells with 100 μm Cu·DA complex in the absence and presence of 100 μm dicoumarol for 1, 2, 3, 4, 7, and 12 h. No small DNA fragments were observed when the cells were incubated with Cu·DA complex in the absence or presence of dicoumarol for 1, 2, 3, 4, and 7 h (Fig. 4A showed only at 7 h). However, small fragments of DNA were observed in cells incubated for 12 h with Cu·DA complex, both in the absence or presence of 100 μm dicoumarol (Fig. 4B). However, DNA laddering was more pronounced in cells treated with Cu·DA complex alone. Incubation of the cells with 100 μm dopamine, 100 μm dicoumarol or 1 mm CuSO4 did not result in small DNA fragments (Fig. 4). As a positive control, the cells were incubated with 100 μm menadione, which produced small DNA fragments both at 7 and 12 h.
FIGURE 4.
DNA laddering in RCSN-3 cells. The cells were treated with 100 μm dopamine (2), 1 mm CuSO4 (3), 100 μm dicoumarol (4), 100 μm Cu·DA complex (5), 100 μm Cu·DA complex and 100 μm dicoumarol (6) for 7 h (A) and 12 h (B). Control cells (1) were incubated with culture medium, and the positive control was with incubated 100 μm menadione (7).
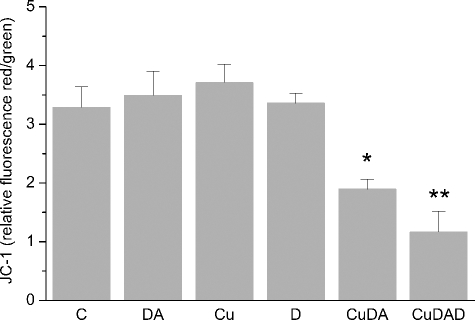
Mitochondrial Membrane Potential Changes—Caspase independent DNA fragmentation is associated with mitochondrial release of proteins related to oligonucleosomal DNA fragmentation (24). Therefore, we studied changes in the mitochondrial membrane potential by using JC-1 in cells incubated with 100 μm Cu·DA complex in the absence or presence of 100 μm dicoumarol for 2 h. A significant change in the mitochondrial membrane potential was observed both when the cells were incubated with Cu·DA complex in the absence (1.9 ± 0.2 RF, p < 0.05) and presence of dicoumarol (1.2 ± 0.3 RF, p < 0.01) compared with the control cells (3.3 ± 0.4 RF). No significant changes were observed when the cells were incubated with 100 μm dopamine, 100 μm dicoumarol, or 1 mm CuSO4 alone (Fig. 5).
FIGURE 5.
Determination of changes in mitochondrial membrane potential. Changes in mitochondrial membrane potential were measured using JC-1 staining in RCSN-3. Cells were incubated with 100 μm dopamine (DA), 1 mm CuSO4 (Cu), 100 μm dicoumarol (D), 100 μm Cu·DA complex (CuDA), or 100 μm Cu·DA complex 100 μm dicoumarol (CuDAD) for 2 h. The control was incubated with cell culture medium (C). The values are the ratio between red/green fluorescence of JC-1. The statistical significance was assessed using ANOVA for multiple comparisons and Student's t test (*, p < 0.05; **, p < 0.01). The values (Rf, relative fluorescence) are the mean ± S.D., n = 3.
The Effect of Cyclosporine A on Cell Death and Phosphatidylserine Externalization—We studied the effect of cyclosporine A on cell death and phosphatidylserine externalization observed after treatment with Cu·DA complex. A 72% inhibition of phosphatidylserine externalization was observed in the presence of 5 μm cyclosporine A (18.4 ± 2%, p < 0.001) when the cells were incubated with 100 μm Cu·DA complex. However, no effect of cyclosporine A on cell death was observed in cells treated with Cu·DA complex. These results contrast with the lack of effect of cyclosporine A on phosphatidylserine externalization and cell death when the cells were treated with 100 μm Cu·DA complex in the presence of 100 μm dicoumarol (Fig. 2B).
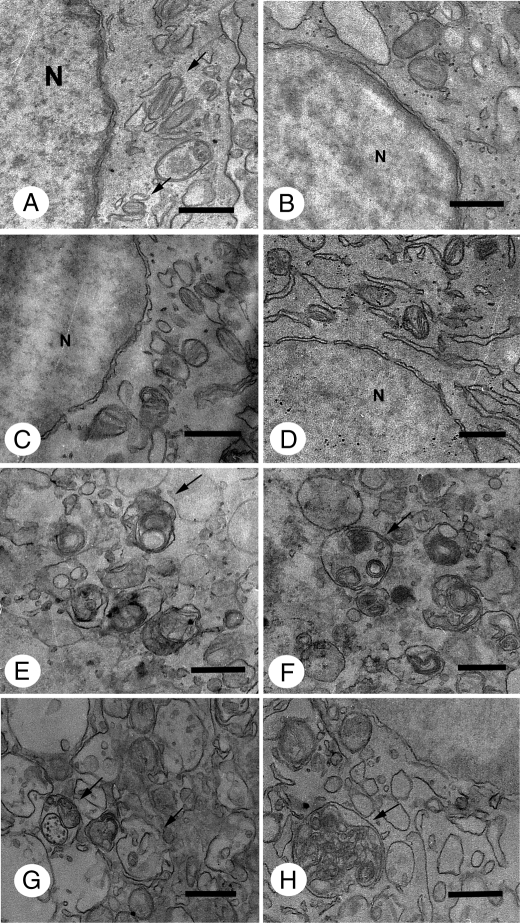
Cytoplasm Ultrastructural Analysis—Transmission electron microscopy was performed to examine cellular changes at the ultrastructural level to obtain more information about the mechanism of cell death induced by Cu·DA complex, because caspase-independent cell death has been observed both during apoptosis and autophagy (25, 26). The ultrastructure of cells in control conditions (Fig. 6A) is characterized by a normal morphology of cytoplasm, mitochondria, and nucleus. No significant morphological changes in relation to control conditions were observed in cells treated with 100 μm dopamine, 1 mm CuSO4, or 100 μm dicoumarol for 2, 4, and 7 h. However, autophagic vacuoles and residual bodies appeared as a main cellular component characterized by a single or double membrane limited compartment that segregated cytoplasmic constituents during different degradation stages in cells treated for 2 h with 100 μm Cu·DA complex in the absence or presence of 100 μm dicoumarol. Enlarged autophagic compartments were observed in a highly vacuolated cytoplasm after 4 h of treatment with 100 μm Cu·DA complex in the absence and presence of 100 μm dicoumarol.
FIGURE 6.
Ultrastructural analysis of cytoplasm from RCSN-3 cells treated with Cu·DA complex. The cytoplasm ultrastructure was studied by using transmission electron microscopy in control conditions (A) and in cells treated for 2 h with 100 μm dopamine (B), 1 mm CuSO4 (C), 100 μm dicoumarol (D), 100 μm Cu·DA complex (E), or 100 μm Cu·DA complex and 100 μm dicoumarol (F). Cells treated with 1 mm copper plus 100 μm dopamine (G) or 1 mm copper, 100 μm dopamine, and 100 μm dicoumarol (H) were incubated for 4 h (bars = 0.5 μm; nucleus, N). The arrows in A show the mitochondria and in E–H autophagic vacuoles.
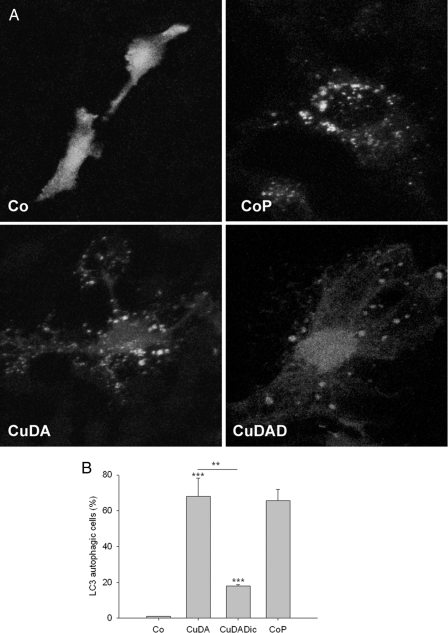
Determination of Autophagosomes—We determined the formation the autophagosome vacuoles induced by Cu·DA complex in the absence or presence of 100 μm dicoumarol in GFP-LC3-transfected RCSN-3 cells incubated for 4 h by using confocal microscopy analysis. For negative control conditions, the cells were incubated with culture medium. For positive control, the cells were incubated for 24 h with cell culture medium under conditions of serum deprivation. Quantification of the number of cells with GPP-LC3-positive fluorescence revealed that Cu·DA complex induced a significant increase (68 ± 10%, p < 0.001). However, Cu·DA complex in the presence of 100 μm dicoumarol exhibited only 18 ± 1% positive cells (p < 0.001, Fig. 7). We did not observe differences with control cells in cells treated with 100 μm dopamine, 100 μm dicoumarol, or 1 mm CuSO4 (not shown).
FIGURE 7.
Determination of autophagosome vesicles in RCSN-3 cells transfected with GFP-LC3. A, GFP-LC3-transfected RCSN-3 cells were treated with 100 μm Cu·DA complex (CuDA) and 100 μm Cu·DA complex and 100 μm dicoumarol (CuDAD) for 4 h. For control conditions, we used culture medium alone (Co). For positive controls, the cells were incubated for 24 h with cell culture medium in conditions of serum deprivation (CoP). B, quantitative determination of the number of cells with GFP-LC3 positive staining after treatment with 100 μm Cu·DA complex (CuDA) and 100 μm Cu·DA complex and 100 μm dicoumarol (CuDAD) for 4 h. The control conditions are the same as in A.
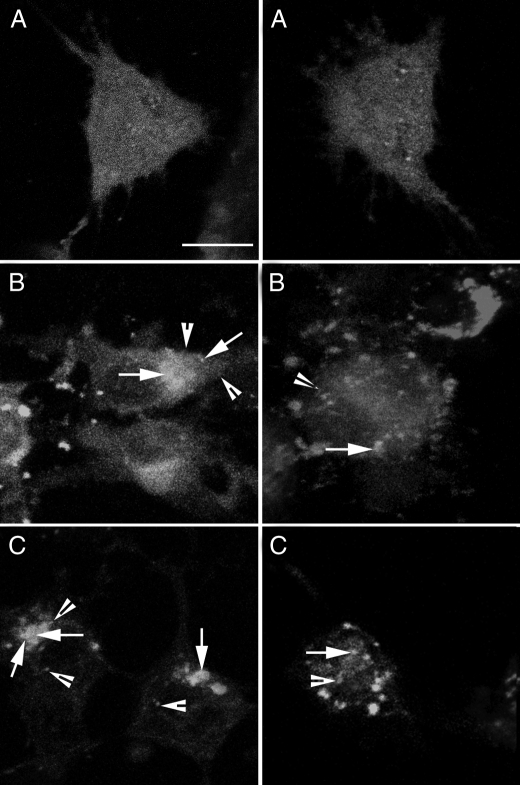
Colocalization of Autophagosomes and Mitochondria—RCSN-3 cells transfected with GFP-LC3 with green fluorescence were incubated with 3 μm Rhod-2AM (selective indicator for mitochondrial Ca2+ with red fluorescence) to determine whether mitochondria were colocalized with autophagosomes. The cells incubated with 100 μm Cu·DA in the absence or presence of 100 μm dicoumarol showed positive staining, although the positive staining was more pronounced in cells treated with Cu·DA complex alone (Fig. 8).
FIGURE 8.
Determination of colocalization of autophagosome vacuoles and mitochondria. RCSN-3 cells transfected with GFP-LC3 were incubated with 3 μm Rhod-2AM, a specific marker for mitochondrial calcium. The cells were treated with 100 μm Cu·DA complex (B) and 100 μm dicoumarol (C) for 4 h. For a control condition, the cells were incubated with cell culture medium (A) (bars = 10 μm). The arrowheads show the mitochondria (red) marked with Rhod-2AM, and the arrows show the colocalization of GFP-LC3 and Rhod-2AM (yellow).
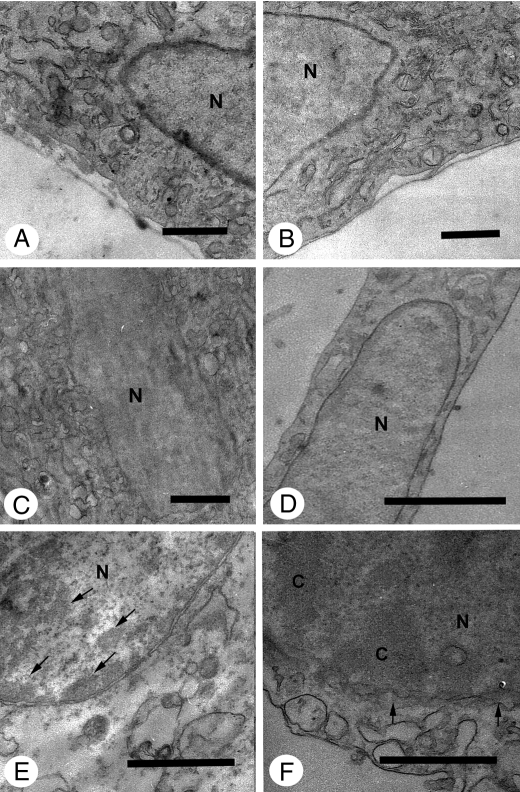
Nuclei Ultrastructural Analysis—The ultrastructure of cells in control conditions was characterized by normal nuclear and chromatin morphology. Compact clusters of chromatin appeared in highly vacuolized cells with a well preserved nuclear membrane when treated for 7 h with 100 μm Cu·DA complex. Significant portions of compact chromatin were observed within a vacuolated nuclear membrane in cells treated with 100 μm Cu·DA complex in the presence of 100 μm dicoumarol. In cells treated for 7 h with 100 μm dopamine, 1 mm CuSO4, or 100 μm dicoumarol, the nuclear morphology was well preserved without important chromatin changes in relation to control conditions (Fig. 9).
FIGURE 9.
Ultrastructural analysis of nuclei from RCSN-3 cells treated with Cu·DA complex. The ultrastructure of the nuclei was studied by using transmission electron microscopy in control conditions (A) and in cells treated for 7 h with 100 μm dopamine (B), 1 mm CuSO4 (C), 100 μm dicoumarol (D), 1 mm copper plus 100 μm dopamine (E) or 1 mm copper, 100 μm dopamine and 100 μm dicoumarol (F) (bars = 0.5 μm; nucleus, N; chromatin, C). The arrows show in E compact clusters of chromatin and in F the vacuolated nuclear membrane.
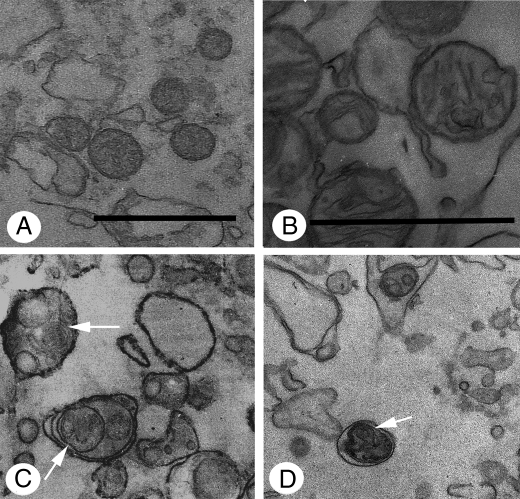
Mitochondria Ultrastructural Analysis—Mitochondria ultrastructure in cells treated with 100 μm Cu·DA complex was mainly spherical in shape with a well preserved morphology (Fig. 10A). However, the mitochondria appeared spherical with enlarged crests within an edematized matrix in cells treated with 100 μm Cu·DA complex in the presence of 100 μm dicoumarol (Fig. 10B). Autophagic vacuoles containing mitochondria can be observed in Fig. 10 (C and D). The mitochondria were complete normal in control cells or cells treated with 1 mm CuSO4, 100 μm dopamine, or 100 μm dicoumarol alone (not shown).
FIGURE 10.
Ultrastructural analysis of mitochondria from RCSN-3 cells treated with Cu·DA complex. The mitochondria ultrastructure was studied using transmission electron microscopy in cells treated for 7 h with 1 mm copper plus 100 μm dopamine (A) and 1 mm copper plus 100 μm dopamine and 100 μm dicoumarol (B) (bars = 0.5 μm). The mitochondria ultrastructure in vacuoles was studied by using transmission electron microscopy in cells treated for 2 h with 1 mm copper plus 100 μm dopamine (C) and 1 mm copper plus 100 μm dopamine and 100 μm dicoumarol (D) (bars = 0.5 μm). The arrows show autophagic vacuoles containing mitochondria.
DISCUSSION
Caspase-mediated apoptosis is the best defined mode of cell death (27). In general, apoptotic cells are characterized by exposure of phosphatidylserine on the external membrane, formation of mitochondrial permeability transition pores, caspase 3 activation, chromatin condensation, blebbing, and oligonucleosomal DNA fragmentation. However, DNA fragmentation has been reported to depend on a mechanism with direct or indirect activation of caspase 3 and mitochondria damage (28–31). DNA fragmentation has been observed both in necrosis and autophagy (32, 33).
The autophagic cell death is morphologically associated with the induction of autophagic vacuole formation and involves a biochemical process where organelles are digested in double membrane autophagic vacuoles (34). Autophagy is an intracellular bulk degradation process whereby cytoplasmic proteins and organelles are degraded and recycled through lysosomes (35–37). It plays an important role in the elimination of damaged organelles such as mitochondria, peroxisomes, and endoplasmic reticulum. Cu·DA complex induces the formation of autophagic vacuoles with double membrane, both in the absence and presence of dicoumarol, suggesting that autophagy is involved in this mechanism of cell death. The protein LC3 has been used as a specific marker for quantification of autophagosomes. LC3 is the mammalian autophagic protein that localizes to the autophagosome membrane, as well as to the cytosol (38, 39). Overexpression of GFP-LC3 is a well accepted, straightforward, and specific assessment of autophagosome formation that does not perturb autophagosome number or function (40). Transfection of RCSN-3 cells with GFP-LC3 shows that Cu·DA complex alone induces a near 4-fold increase in cells with autophagic vacuoles than it does in the presence of dicoumarol. Colocalization of GFP-LC3 and the mitochondrial calcium marker Rhod-2AM was observed, suggesting the presence of mitochondria in autophagic vacuoles. The result suggests that Cu·DA complex in the absence and presence of dicoumarol induces mitochondrial autophagic cell death. However, the lack of oligonucleosomal DNA fragmentation within 12 h when we observed chromatin alterations and autophagic vacuoles after 2 h, suggests the possibility that Cu·DA complex induces a mechanism of cell death with mitochondrial autophagy followed by apoptotic cell death independent of caspase 3 and characterized by late oligonucleosomal DNA fragmentation. These results are in agreement with reports showing that autophagy precedes apoptosis (41). Reactive oxygen species and an increase of mitochondrial calcium have been described as activators of mitochondrial permeability transition pore formation (42, 43). The role of the mitochondrial permeability transition as a key event in mitochondrial autophagy has been suggested (44). We observed a disruption of cellular redox state induced by Cu·DA complex both in the absence and presence of dicoumarol, although these were more pronounced in the presence of dicoumarol. In addition, mitochondrial membrane potential was affected by Cu·DA complex both in the absence and presence of dicoumarol, suggesting mitochondrial dysfunction. However, Cyclosporine A, an inhibitor of mitochondrial permeability transition pore formation, had no effect on cell death in cells treated with Cu·DA complex, suggesting that permeability transition pores are not involved in Cu·DA complex-induced cell death.
In Alzheimer disease, a strongly up-regulated synthesis of components of the lysosomal system has been observed (45). However, ultrastructural analyses showed that the vesicles that accumulate in dystrophic neurites are not actually lysosomes but are mainly autophagic vacuoles (46). It was suggested that mitochondria are key targets of increased autophagic degradation in Alzheimer disease (47). In Parkinson disease, Parkin is selectively recruited to dysfunctional mitochondria, and it mediates the engulfment of mitochondria by autophagosomes and the selective elimination of impaired mitochondria (48). Wild type α-synuclein is degraded by chaperone-mediated autophagy in neuronal cells (49). Macroautophagy, but not the proteasome, also contributes to α-synuclein degradation (15). Neuronal survival requires continuous lysosomal turnover of cellular constituents delivered by autophagy and endocytosis, and it can be considered as a neuroprotective mechanism (51). However, the macroautophagy we observed in RCSN-3 cells treated with Cu·DA complex in the absence and presence of dicoumarol did not seem to be a neuroprotective mechanism because the macroautophagy was followed by cell death.
The mechanism for cell death induced by Cu·DA complex alone seems to be different to the cell death induced by Cu·DA complex in the presence of dicoumarol, an inhibitor of NAD(P)H dehydrogenase. The major differences between these mechanisms are as follows. (i) In the presence of dicoumarol Cu·DA complex induces a more extensive and rapid cell death; (ii) Cyclosporine A had no effect on phosphatidylserine externalization in the presence of dicoumarol; (iii) In the presence of dicoumarol, significant portions of compact chromatin were observed within a vacuolated nuclear membrane; (iv) DNA laddering was less pronounced in the presence of dicoumarol; (v) The mitochondria morphology was more affected in the presence of dicoumarol; (vi) Probably, the most important difference was that the number of cells with autophagic vacuoles was a near 4-fold more in cells treated with Cu·DA complex alone than in the presence of dicoumarol. These differences observed in the presence of dicoumarol can be explained by the fact that the neurotoxicity mediated by Cu·DA complex in RCSN-3 cells involves dopamine oxidation to aminochrome (6). Aminochrome has two possible neurotoxic pathways: (a) aminochrome forms adducts with α-synuclein inducing and stabilizing neurotoxic protofibrils (52, 53) and (b) aminochrome can be reduced by flavoenzymes using NADH or NADPH, that catalyze the transfer of one electron to a leukoaminochrome-o-semiquinone radical. This species is extremely reactive with oxygen, auto-oxidizing with the generation of a redox, and cycling between aminochrome and the leukoaminochrome-o-semiquinone radical (6, 18, 54–58). This redox cycling results in (i) the depletion of NADH, which is required to for ATP synthesis in the mitochondria; (ii) depletion of NADPH, which is required to keep glutathione in the reduced state necessary to exert its antioxidant action; (iii) depletion of oxygen, which is required for ATP synthesis in the mitochondria; and (iv) formation of superoxide radicals, which spontaneously or enzymatically generate hydrogen peroxide, the precursor of hydroxyl radicals. However, NAD(P)H dehydrogenase prevents aminochrome neurotoxic actions such as one-electron reduction of aminochrome (6, 18, 57, 59) and formation of α-synuclein protofibrils (60). NAD(P)H dehydrogenase (EC 1.6.99.2) is a unique flavoenzyme that catalyzes the two-electron reduction of quinones to hydroquinones, using both NADH and NADPH as electron donors.
Copper is an essential metal tracer used as a cofactor by several enzymes. However, copper overload can be toxic. Wilson disease is a copper deposition disorder caused by a genetic mutation in a copper transporter ATPase (ATP7B), which is essential for the maintenance of intracellular copper concentration. The accumulation of copper in liver results in copper overload in the brain, inducing neurological Wilson disease. A study on the clinical presentations of this disease (282 cases) showed that 69% of patients were classified as having neurological Wilson disease (50). The predominant neurological features were Parkinsonism, 62.3%; dystonia, 35.4%; cerebellar, 28%; pyramidal signs, 16%; chorea, 9%; athetosis, 2.2%; myoclonus, 3.4%; and behavioral abnormalities, 16% (50). The fact that Parkinsonism is one of the major neurological symptoms in Wilson disease opens the question as to why the copper overload effect is specific for dopaminergic neurons. The ability of reduced copper to catalyze the Fenton reaction is an unspecific mechanism and cannot explain the selective action of copper. One possible explanation for the selectivity of copper resulting in Parkinsonism symptoms is copper's ability to form a complex with dopamine (Cu·DA complex). This complex is taken up by dopamine transporters (6). The dependence of dopamine uptake confers the selectivity of the neurotoxic action of Cu·DA complex. Cu·DA complex is also neurotoxic in RCHT cells derived from rat hypothalamus that have expression of norepinephrine transporter and D2 dopamine receptor. However, Cu·DA complex has no toxic effect on the CNh cell line derived from mouse cerebral cortex lacking dopamine transporters.3 This idea is supported by experiments done with animals where unilateral and intranigral injection of CuSO4 and dicoumarol presented a significant and characteristic contralateral rotational behavior, extensive loss of tyrosine hydroxylase-positive fiber density in the striatum, and cell loss in the substantia nigra (6).
In conclusion, Cu·DA complex-induced mitochondrial autophagy is an early event of cell death that occurs after 2 h of exposure, followed by a caspase 3-independent apoptotic cell death characterized by late oligonucleosomal DNA fragmentation at 12 h.
Acknowledgments
We thank Dr. Zsolt Tallocky of Columbia University Medical Center for providing the GFP-LC3 plasmid.
This work was supported by Fogarty International Research Collaboration Award Grant R03 TW07044-01 and Fondo Nacional de Desarrollo Científico y Tecnológico Grants 1020672 and 1061083.
Footnotes
The abbreviations used are: DA, dopamine; Z, benzyloxycarbonyl; FMK, fluoromethyl ketone; GFP-LC3, green fluorescent protein-light chain 3; PBS, phosphate-buffered saline; ANOVA, analysis of variance.
I. Paris, C. Perez-Pastene, E. Couve, P. Caviedes, S. LeDoux, and J. Segura-Aguilar, unpublished results.
References
- 1.Oder, W., Prayer, L., Grimm, G., Spatt, J., Ferenci, P., Kollegger, H., Schneider, B., Gangl, A., and Deecke, L. (1993) Neurology 43 120–124 [DOI] [PubMed] [Google Scholar]
- 2.Barthel, H., Hermann, W., Kluge, R., Hesse, S., Collingridge, D. R., Wagner, A., and Sabri, O. (2003) Am. J. Neuroradiol. 24 234–238 [PMC free article] [PubMed] [Google Scholar]
- 3.Caviedes, P., and Segura-Aguilar, J. (2001) Neuroreport 12 A25 [Google Scholar]
- 4.Diaz-Veliz, G., Paris, I., Mora, S., Raisman-Vozari, R., and Segura-Aguilar, J. (2008) Chem. Res. Toxicol. 21 1180–1185 [DOI] [PubMed] [Google Scholar]
- 5.Yu, W. R., Jiang, H., Wang, J., and Xie, J. X. (2008) Neurosci. Bull. 24 73–78 [DOI] [PMC free article] [PubMed] [Google Scholar]
- 6.Paris, I., Dagnino-Subiabre, A., Marcelain, K., Bennett, L. B., Caviedes, P., Caviedes, R., Olea-Azar, C., and Segura-Aguilar, J. (2001) J. Neurochem. 77 519–529 [DOI] [PubMed] [Google Scholar]
- 7.Kiss, T., and Gergely, A. (1985) J. Inorg. Biochem. 25 247–259 [DOI] [PubMed] [Google Scholar]
- 8.Wang, Y., Li, X., Wang, L., Ding, P., Zhang, Y., Han, W., and Ma, D. (2004) J. Cell Sci. 117 1525–1532 [DOI] [PubMed] [Google Scholar]
- 9.Bröker, L. E., Kruyt, F. A., and Giaccone, G. (2005) Clin. Cancer Res. 11 3155–3162 [DOI] [PubMed] [Google Scholar]
- 10.Fink, S. L., and Cookson, B. T. (2005) Infect. Immun. 73 1907–1916 [DOI] [PMC free article] [PubMed] [Google Scholar]
- 11.Bredesen, D. E. (2007) Stroke 38 652–660 [DOI] [PMC free article] [PubMed] [Google Scholar]
- 12.Krysko, D. V., Vanden Berghe, T., D'Herde, K., and Vandenabeele, P. (2008) Methods 44 205–221 [DOI] [PubMed] [Google Scholar]
- 13.Leprêtre, C., Scovassi, A. I., Shah, G. M., and Torriglia, A. (2008) Int. J. Biochem. Cell Biol. 41 1046–1054 [DOI] [PubMed] [Google Scholar]
- 14.Dagda, R. K., Zhu, J., Kulich, S. M., and Chu, C. T. (2008) Autophagy 4 770–782 [DOI] [PMC free article] [PubMed] [Google Scholar]
- 15.Vogiatzi, T., Xilouri, M., Vekrellis, K., and Stefanis, L. (2008) J. Biol. Chem. 283 23542–23556 [DOI] [PMC free article] [PubMed] [Google Scholar]
- 16.Rickmann, M., Vaquero, E. C., Malagelada, J. R., and Molero, X. (2007) Gastroenterology 132 2518–2532 [DOI] [PubMed] [Google Scholar]
- 17.Hwang, S. O., and Lee, G. M. (2008) Biotechnol. Bioeng. 99 678–685 [DOI] [PubMed] [Google Scholar]
- 18.Paris, I., Martinez-Alvarado, P., Perez-Pastene, C., Vieira, M. N., Olea-Azar, C., Raisman-Vozari, R., Cardenas, S., Graumann, R., Caviedes, P., and Segura-Aguilar, J. (2005) J. Neurochem. 92 1021–1032 [DOI] [PubMed] [Google Scholar]
- 19.Paris, I., Lozano, J., Cardenas, S., Perez-Pastene, C., Saud, K., Fuentes, P., Dagnino-Subiabre, A., Raisman-Vozari, R., Shimahara, T., Kostrzewa, J. P., Chi, D., Kostrzewa, R. M., Caviedes, P., and Segura-Aguilar, J. (2008) Neurotox. Res. 13 221–230 [DOI] [PubMed] [Google Scholar]
- 20.Chikira, M., Inoue, M., Nagane, R., Harada, W., and Shindo, H. (1997) J. Inorg. Biochem. 66 131–139 [DOI] [PubMed] [Google Scholar]
- 21.Dagnino-Subiabre, A., Marcelain, K., Arriagada, C., Paris, I., Caviedes, P., Caviedes, R., and Segura-Aguilar, J. (2000) Mol. Cell. Biochem. 212 131–134 [PubMed] [Google Scholar]
- 22.Hissin, P. J., and Hilf, R. (1976) Anal. Biochem. 74 214–226 [DOI] [PubMed] [Google Scholar]
- 23.Reers, M., Smith, T. W., and Chen, L. B. (1991) Biochemistry 30 4480–4486 [DOI] [PubMed] [Google Scholar]
- 24.Widlak, P., Li., L. Y., Wang, X., and Garrard, W. T. (2001) J. Biol. Chem. 276 48404–48409 [DOI] [PubMed] [Google Scholar]
- 25.Shrivastava, A., Tiwari, M., Sinha, R. A., Kumar, A., Balapure, A. K., Bajpai, V. K., Sharma, R., Mitra, K., Tandon, A., and Godbole, M. M. (2006) J. Biol. Chem., 281 19762–19771 [DOI] [PubMed] [Google Scholar]
- 26.Knaapen, W. M., Davies, M. J., De Bie, M., Haven, A. J., Martinet, W., and Kockx, M. M. (2001) Cardiovasc. Res. 51 304–312 [DOI] [PubMed] [Google Scholar]
- 27.Eldadah, B. A., and Faden, A. I. (2000) J. Neurotrauma 17 811–829 [DOI] [PubMed] [Google Scholar]
- 28.Cande, C., Cecconi, F., Dessen, P., and Kroemer, G. (2002) J. Cell Sci. 115 4727–4734 [DOI] [PubMed] [Google Scholar]
- 29.Dussmann, H., Rehm, M., Kogel, D., and Prehn, J. H. (2003) J. Cell Sci. 116 525–536 [DOI] [PubMed] [Google Scholar]
- 30.Park, S. Y., Cho, S. J., Kwon, H. C., Lee, K. R., Rhee, D. K., and Pyo, S. (2005) Cancer Lett. 224 123–132 [DOI] [PubMed] [Google Scholar]
- 31.Kroemer, G., and Martin, S. J. (2005) Nat. Med. 11 725–730 [DOI] [PubMed] [Google Scholar]
- 32.Higuchi, Y. (2003) Biochem. Pharmacol. 66 1527–1535 [DOI] [PubMed] [Google Scholar]
- 33.Bursch, W. (2004) FEMS Yeast Res. 5 101–110 [DOI] [PubMed] [Google Scholar]
- 34.Gozuacik, D., and Kimchi, A. (2007) Curr. Top. Dev. Biol. 78 217–245 [DOI] [PubMed] [Google Scholar]
- 35.Matsui, Y., Kyoi, S., Takagi, H., Hsu, C. P., Hariharan, N., Ago, T., Vatner, S. F., and Sadoshima, J. (2008) Autophagy 4 409–415 [DOI] [PMC free article] [PubMed] [Google Scholar]
- 36.Tettamanti, G., Saló, E., González-Estévez, C., Felix, D. A., Grimaldi, A., and de Eguileor, M. (2008) Curr. Pharm. Des. 14 116–125 [DOI] [PubMed] [Google Scholar]
- 37.Mizushima, N. (2007) Genes Dev. 21 2861–2873 [DOI] [PubMed] [Google Scholar]
- 38.Kabeya, Y., Mizushima, N., Ueno, T., Yamamoto, A., Kirisako, T., Noda, T., Kominami, E., Ohsumi, Y., and Yoshimori, T. (2000) EMBO J. 19 5720–5728 [DOI] [PMC free article] [PubMed] [Google Scholar]
- 39.Tang, G., Yue, Z., Talloczy, Z., Hagemann, T., Cho, W., Messing, A., Sulzer, D. L., and Goldman, J. E. (2008) Hum. Mol. Genet. 17 1540–1555 [DOI] [PMC free article] [PubMed] [Google Scholar]
- 40.Marino, G., and Lopez-Otin, C. (2004) Cell Mol. Life Sci. 61 1439–1454 [DOI] [PMC free article] [PubMed] [Google Scholar]
- 41.González-Polo, R. A., Boya, P., Pauleau, A. L., Jalil, A., Larochette, N., Souquère, S., Eskelinen, E. L., Pierron, G., Saftig, P., and Kroemer, G. (2005) J. Cell Sci. 15 3091–3102 [DOI] [PubMed] [Google Scholar]
- 42.Atlante, A., Calissano, P., Bobba, A., Azzariti, A., Marra, E., and Passarella, S. (2000) J. Biol. Chem. 275 37159–37166 [DOI] [PubMed] [Google Scholar]
- 43.Argaud, L., Gateau-Roesch, O., Chalabreysse, L., Gomez, L., Loufouat, J., Thivolet-Bejui, F., Robert, D., and Ovize, M. (2004) Cardiovasc. Res. 61 115–122 [DOI] [PubMed] [Google Scholar]
- 44.Rodriguez-Enriquez, S., He, L., and Lemasters, J. J. (2004) Int. J. Biochem. Cell Biol. 36 2463–2472 [DOI] [PubMed] [Google Scholar]
- 45.Cataldo, A. M., Barnett, J. L., Berman, S. A., Li, J., Quarless, S., Bursztajn, S., Lippa, C., and Nixon, R. A. (1995) Neuron 14 671–680 [DOI] [PubMed] [Google Scholar]
- 46.Nixon, R. A., Wegiel, J., Kumar, A., Yu, W. H., Peterhoff, C., Cataldo, A., and Cuervo, A. M. (2005) J. Neuropathol. Exp. Neurol. 64 113–122 [DOI] [PubMed] [Google Scholar]
- 47.Moreira, P. I., Siedlak, S. L., Wang, X., Santos, M. S., Oliveira, C. R., Tabaton, M., Nunomura, A., Szweda, L. I., Aliev, G., Smith, M. A., Zhu, X., and Perry, G. (2007) Autophagy 3 614–615 [DOI] [PubMed] [Google Scholar]
- 48.Narendra, D., Tanaka, A., Suen, D. F., and Youle, R. J. (2008) J. Cell Biol. 183 795–803 [DOI] [PMC free article] [PubMed] [Google Scholar]
- 49.Xilouri, M., Vogiatzi, T., Vekrellis, K., and Stefanis, L. (2008) Autophagy 4 917–919 [DOI] [PubMed] [Google Scholar]
- 50.Taly, A. B., Meenakshi-Sundaram, S., Sinha, S., Swamy, H. S., and Arunodaya, G. R. (2007) Medicine (Baltimore) 86 112–121 [DOI] [PubMed] [Google Scholar]
- 51.Larsen, K. E., and Sulzer, D. (2002) Histol. Histopathol. 17 897–908 [DOI] [PubMed] [Google Scholar]
- 52.Conway, K. A., Rochet, J. C., Bieganski, R. M., and Lansbury, P. T., Jr. (2001) Science 294 1346–1349 [DOI] [PubMed] [Google Scholar]
- 53.Norris, E. H., Giasson, B. I., Hodara, R., Xu, S., Trojanowski, J. Q., Ischiropoulos, H., and Lee, V. M. (2005) J. Biol. Chem. 280 21212–21219 [DOI] [PubMed] [Google Scholar]
- 54.Segura-Aguilar, J., Diaz-Veliz, G., Mora, S., and Herrera-Marschitz, M. (2002) Neurotox. Res. 4 127–131 [DOI] [PubMed] [Google Scholar]
- 55.Arriagada, A., Paris, I., Sanchez de las Matas, M. J., Martinez-Alvarado, P., Cárdenas, S., Castañeda, P., Graumann, R., Perez-Pastene, C., Olea-Azar, C., Couve, E., Herrero, M. T., Caviedes, P., and Segura-Aguilar, J. (2004) Neurobiol. Dis. 16 468–477 [DOI] [PubMed] [Google Scholar]
- 56.Díaz-Véliz, G., Mora, S., Lungenstrass, H., and Segura-Aguilar, J. (2004) Neurotox. Res. 5 629–634 [DOI] [PubMed] [Google Scholar]
- 57.Fuentes, P., Paris, I., Nassif, M., Caviedes, P., and Segura-Aguilar, J. (2007) Chem. Res. Toxicol. 20 776–783 [DOI] [PubMed] [Google Scholar]
- 58.Paris, I., Cárdenas, S., Lozano, J., Perez-Pastene, C., Graumann, R., Riveros, A., Caviedes, P., and Segura-Aguilar, J. (2007) Neurotox. Res. 12 125–134 [DOI] [PubMed] [Google Scholar]
- 59.Paris, I., Martinez-Alvarado, P., Cárdenas, S., Perez-Pastene, C., Graumann, R., Fuentes, P., Olea-Azar, C., Caviedes, P., and Segura-Aguilar, J. (2005) Chem. Res. Toxicol. 18 415–419 [DOI] [PubMed] [Google Scholar]
- 60.Cárdenas, S. P., Perez-Pastene, C., Couve, E., and Segura-Aguilar, J. (2008) Neurotoxicity Res. 13 136. [DOI] [PubMed] [Google Scholar]


