Abstract
GTP cyclohydrolase I (GTPCH) is a key enzyme in the synthesis of tetrahydrobiopterin (BH4), a required cofactor for nitricoxide synthases and aromatic amino acid hydroxylases. Alterations of GTPCH activity and BH4 availability play an important role in human disease. GTPCH expression is regulated by inflammatory stimuli, in association with reduced expression of GTP cyclohydrolase feedback regulatory protein (GFRP). However, the relative importance of GTPCH expression versus GTPCH activity and the role of GFRP in relation to BH4 bioavailability remain uncertain. We investigated these relationships in a cell line with tet-regulated GTPCH expression and in the hph-1 mouse model of GTPCH deficiency. Doxycycline exposure resulted in a dose-dependent decrease in GTPCH protein and activity, with a strong correlation between GTPCH expression and BH4 levels (r2 = 0.85, p < 0.0001). These changes in GTPCH and BH4 had no effect on GFRP expression or protein levels. GFRP overexpression and knockdown in tet-GCH cells did not alter GTPCH activity or BH4 levels, and GTPCH-specific knockdown in sEnd.1 endothelial cells had no effect on GFRP protein. In mouse liver we observed a graded reduction of GTPCH expression, protein, and activity, from wild type, heterozygote, to homozygote littermates, with a striking linear correlation between GTPCH expression and BH4 levels (r2 = 0.82, p < 0.0001). Neither GFRP expression nor protein differed between wild type, heterozygote, nor homozygote mice, despite the substantial differences in BH4. We suggest that GTPCH expression is the primary regulator of BH4 levels, and changes in GTPCH or BH4 are not necessarily accompanied by changes in GFRP expression.
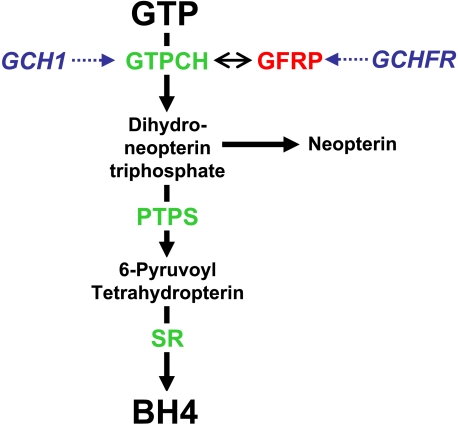
Tetrahydrobiopterin (BH4)2 is an essential cofactor for the nitric-oxide synthase isoforms and for the aromatic amino acid hydroxylases. BH4 is synthesized in cells from GTP in a three-step pathway where the first and rate-limiting enzyme is GTP cyclohydrolase I (GTPCH), encoded by GCH1 (Fig. 1). GTPCH activity can be regulated transcriptionally, for example by induction of GCH1 expression by proinflammatory cytokines (1). However, GTPCH can also be regulated post-translationally by phosphorylation (2) and through allosteric feedback by BH4 and phenylalanine, mediated by protein-protein interactions between GTPCH and GTP cyclohydrolase feedback regulatory protein (GFRP), encoded by GCHFR (Fig. 1) (3, 4). Structural studies suggest that GFRP regulates GTPCH activity by formation of a multimeric protein complex comprising two GFRP pentamers bound to one GTPCH decamer. Allosteric regulation of GTPCH by phenylalanine or BH4, through GFRP, appears to either stimulate or inhibit GTPCH activity, respectively (5).
FIGURE 1.
Schematic demonstrating the de novo synthesis of BH4. BH4 is produced from GTP by successive reactions catalyzed by the enzymes GTPCH (encoded by the GCH1 gene), 6-pyruvoyl tetrahydropterin synthase (PTPS), and sepiapterin reductase (SR). GTPCH activity is regulated by GTP cyclohydrolase feedback regulatory protein (GFRP, encoded by GCHFR), where complex formation with GTPCH induced by BH4 and phenylalanine binding causes negative feedback inhibition and stimulation of GTPCH activity, respectively.
In addition to allosteric regulation by phenylalanine or BH4, recent studies have suggested that altered expression of GFRP might also contribute to changes in GTPCH activity and BH4 levels, in response to proinflammatory stimuli and hydrogen peroxide (6–9). However, these stimuli lead to major changes in the expression of multiple genes, including GCH1 and the other BH4 biosynthetic enzymes. Accordingly, it remains unclear whether GCH1 expression alone is the critical regulator of GTPCH protein levels, GTPCH activity, and steady state BH4 levels or whether changes in the relative abundance of GTPCH and GFRP are also important.
Accordingly, we sought to systematically quantify the relationships between GCH1 expression, GTPCH protein levels, GTPCH enzymatic activity, steady state BH4 levels, and any associated changes in GFRP expression and protein levels. To avoid the potentially confounding effects of inflammatory or other nonspecific stimuli, we quantified the effects of primary and specific alterations in GCH1 and GCHFR expression, using both in vitro and in vivo model systems.
EXPERIMENTAL PROCEDURES
Generation of tet-GCH Cells—Murine fibroblasts (NIH-3T3 cells) were transfected with a tet-off plasmid and a neomycin resistance gene (“tet cells”). They were cotransfected with a plasmid encoding human GCH1, incorporating an N-terminal hemagglutinin (HA) epitope tag (10). These cells are under the control of a tetracycline response element with a plasmid encoding hygromycin B resistance gene allowing stable clones (“tet-GCH cells”) to be selected by resistance to hygromycin B. In the tet-off system, the presence of doxycycline prevents binding of the tetracycline controlled transactivator to the tetracycline response element, thus causing a “switch off” of GCH1 gene expression. sEnd.1 murine endothelial cells were used as a positive control for both GTPCH and GFRP in these experiments (11).
Cell Culture—The cells were cultured in Dulbecco's modified Eagle's medium (Invitrogen) supplemented with glutamine (2 mm), penicillin (100 units/ml), and streptomycin (0.1 mg/ml). Additionally tet-GCH cells were maintained using medium containing the antibiotics hygromycin (200 μg/ml) and genetecin (200 μg/ml). Where appropriate, doxycycline (1 μg/ml) was added to cell culture media to abolish transcription of GCH1 mRNA.
Experimental Animals—The hph-1 mouse, in which there is constitutively reduced expression of GCH1 (12), was produced by breeding of hph-1 heterozygotes producing matched litters of hph-1 homozygotes (hph), hph-1 heterozygotes (+/-), and wild type littermates (Wt) on a C57BL/b background, as previously described (13). The mice were used between 12 and 18 weeks of age and housed in individually ventilated cages with 12 h light/dark cycle and controlled temperature of 20 °C to 22 °C. The mice were given free access to a normal chow diet and water ad libitum. All of the studies were conducted in accordance with the UK Home Office Animals (Scientific Procedures) Act 1986.
Quantitative Real Time RT-PCR—Total RNA was extracted from snap frozen tissue or cell pellets in 1 ml of TRIzol solution by homogenization or freeze-thaw cycles, respectively. Total RNA was quantified with RiboGreen® RNA reagent (Invitrogen). RT-PCR was completed with SuperScript II (Invitrogen) using 1 μg of total RNA and Taqman gene expressions systems. Quantitative PCR was performed with 50 ng/μl of cDNA on an iCycler IQ real time detection system (Bio-Rad) using gene expression assays (Applied Biosystems). Gene expression levels of human GCH1, mouse GCH1, and mouse GCHFR were normalized to the housekeeping gene β-actin or GAPDH.
RT-PCR was also completed with Quantitect SYBR Green RT-PCR one-step kits, (Qiagen) using 50 ng of total RNA and the following primers for mRNA transcripts of GCH1 (5′ → 3′): mouse GCH1 forward, TGCTTACTCGTCCATTCTGC, and reverse, CCTTCACAATCACCATCTCG; and human GCH1 forward, CGCCTACTCGTCCATCCTGA, and reverse, CCTTCACAATCACCATCTCA; and for mRNA transcripts of GFRP (5′ → 3′): mouse GFRP forward, GGAGTAACGGGACTGTGGTC, and reverse, GAGGAGGGTCGTTGACGTAG. Relative quantities of mRNA were compared using the Rotor-Gene system (Corbett Research Ltd., Cambridge, UK). Gene expression levels were normalized to MLN51 (MLN-51 mouse forward, CGCCGAGGAGTCTGAGTGTG, and reverse, TCGTTAGCTTCTGATTTCAGC).
Western Blot Analysis—Tissue samples were homogenized and cells were freeze-thawed in lysis buffer (Tris 10 mm, NaCl 154 mm, pH 7.4), including a mixture of protease inhibitors (Roche Applied Science). Western blotting was carried out using standard techniques with human GTPCH, mouse GTPCH, GFRP, HA, and GAPDH antibodies. The mouse GTPCH and GFRP antibodies were kindly provided by Prof. Steven S. Gross (Weill Medical College, Cornell University, New York, NY). The human GTPCH antibody was kindly provided by Dr. Gabriele Werner-Felmayer (Institute for Medical Chemistry and Biochemistry, Innsbruck, Austria).
GTPCH Activity Assay—GTPCH activity was measured in tissue extracts and cell pellets by HPLC analysis after iodine oxidation as described previously (14). In brief, snap frozen tissue samples were homogenized, and cell pellets were freeze-thawed in lysis buffer (0.1 m Tris, 0.3 m potassium chloride, 2.5 mm EDTA, 100 μm phenylmethylsulfonyl fluoride, pH 7.8). The lysates were incubated for 1 h at 37 °C with 10 mm GTP in the absence of light. The samples were then oxidized with 0.1 m potassium iodide/iodine and deproteinated with 1 m HCl for 1 h at room temperature in the absence of light. The reaction was stopped by addition of 0.1 m ascorbic acid, and 16 units/ml of alkaline phosphatase was added for 1 h at 37 °C in the absence of light. Neopterin content was quantified by isocratic HPLC and fluorescence detection (JASCO) detection. Quantitation of neopterin was carried out by comparison with external standards and normalized for sample protein content. The protein concentration of each sample was measured using the BCA protein assay kit (Pierce).
Measurement of BH4—BH4 was measured by electrochemical detection following sample separation by HPLC as previously described (15, 16). In brief, snap frozen tissue samples were homogenized, and cell pellets were freeze-thawed in ice-cold resuspension buffer (50 mm phosphate-buffered saline, 1 mm dithioerythritol, 1 mm EDTA, pH 7.4) and centrifuged at 16,100 × g, 4 °C. The supernatants were transferred to new tubes, and ice-cold acid precipitation buffer (1 m phosphoric acid, 2 m trichloroacetic acid, 1 mm dithioerythritol) was added. After centrifugation at 16,000 × g 4 °C, the samples were injected onto an isocratic HPLC system and quantified using sequential electrochemical (Coulochem III, ESA Inc.) detection. HPLC separation was performed using a 250-mm, ACE C-18 column (Hichrom) and a mobile phase comprising 50 mm sodium acetate, 5 mm citric acid, 48 μm EDTA, and 160μm dithioerythritol (pH 5.2) at a flow rate of 1.3 ml/min. Background currents of +500 nA and -50 nA were used for the detection of BH4 on electrochemical cells E1 and E2, respectively. Quantitation of BH4 was done by comparison with external standards after normalizing for sample protein content as previously described.
GFRP Overexpression—GFRP and green fluorescent protein (GFP) overexpression was completed by transient transfection into tet-GCH cells. 2 × 10⁵ cells/well of tet-GCH cells were plated the day before transfection. GFRP cDNA clones (Invitrogen) were utilized for transfections after insertion into pcDNA3.1(+). Transfections were incubated for 48 h, and cells were harvested with trypsin.
GFRP and GTPCH Knockdown by RNA Interference—GFRP-specific, ON-TARGET plus SMARTpool siRNA was purchased from Dharmacon Thermo Scientific. The siRNAs were used as a pool of four specific siRNA duplexes with the following sequences: GFRP: Duplex 1, ACGAAUACUACGUCAACGA; Duplex 2, GACCCUGGCUCUUGCUGUA; Duplex 3, CCAUGGUGGGUGAUGAACA Duplex 4 - CCUGGAUCCUACACAGCUA. GTPCH: Duplex 1, GGUAGAAUGCUAAGUACGU; Duplex 2, CGAGAAGUGUGGCUACGUA; Duplex 3, GAGAAGGGAGAAUCGCUUU; Duplex 4, AGUAGUGAUUGAAGCGACA. tet-GCH cells were grown in Dulbecco's modified Eagle's medium (Invitrogen) supplemented with glutamine (2 mm), penicillin (100 units/ml), and streptomycin (0.1 mg/ml). 24 h prior to transfection, the cells were seeded into 6-well plates. The cells were then transfected with GFRP or GTPCH-specific siRNA (100 nm), GAPDH-positive (100 nm), or nonspecific pooled duplex negative control siRNA (100 nm). The cells were cultured for 72 h, and gene silencing was detected by analysis of GFRP and GTPCH protein expression by Western blotting using GFRP or GTPCH-specific antibodies.
Statistical Analysis—The data are expressed as the means ± S.E. (n = number of animals/cell pellet). Between group comparisons of normally distributed measurements were assessed by two-tailed Student's t test. When more than two groups were being compared, one-way analysis of variance with post-hoc Newman-Keul's multiple comparison test was used. Correlations between normally distributed measurements were made using a Pearson's correlation. p < 0.05 was considered significant.
RESULTS
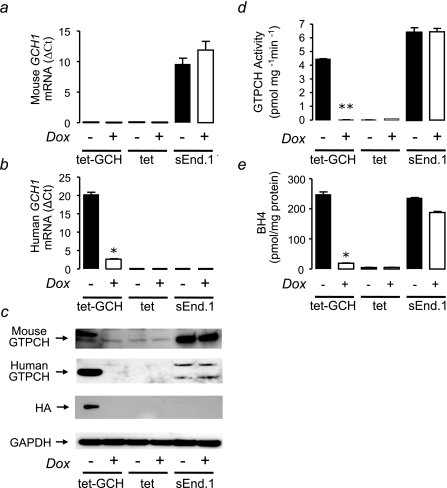
Tet-regulatable GCH1 Overexpression—We sought to evaluate the quantitative relationships between GCH1 expression, GTPCH protein and activity, and intracellular BH4 levels using a novel cell line in which the expression of human GCH1, incorporating an HA epitope tag, is regulated by doxycycline via the tet system. We measured mRNA levels of mouse and human GCH1 by real time RT-PCR and first confirmed that the expression of endogenous mouse GCH1 in tet-GCH cells was not altered on addition of doxycycline (Fig. 2a). The appropriate negative control cells (tet cells without stable transfection of human GCH1) and positive control cells (mouse endothelial sEnd.1 cells that express high levels of GCH1) demonstrated either barely detectable or high levels of mouse GCH1 expression, respectively, with no change in response to doxycycline (Fig. 2a). In contrast, tet-regulated expression of human GCH1 in tet-GCH cells was reduced more than 90% by the addition of doxycycline (Fig. 2b), accompanied by a loss of human GTPCH protein by Western blotting (Fig. 2c), a 95% reduction in GTPCH enzymatic activity, as measured by neopterin triphosphate production (Fig. 2d), and a 90% reduction in cellular biopterin levels (Fig. 2e). These initial findings confirm that tet-GCH cells provide a robust model of regulated human GCH1 expression, leading to quantitatively corresponding changes in GTPCH protein, GTPCH enzymatic activity, and steady state intracellular BH4 levels.
FIGURE 2.
Expression, protein levels, and activity of GTPCH and BH4 levels in tet-GCH cells. a, GCH1 mRNA levels from cell pellets were quantified by real time RT-PCR. Levels of mRNA were corrected for the level of the housekeeping gene β-actin. Mouse GCH1 expression in tet-GCH, tet, and sEnd.1 cells showed no difference on addition of doxycycline (Dox). b, human GCH1 was reduced in tet-GCH cells on addition of doxycycline. Control tet cells and sEnd.1 cells demonstrated no difference. c, protein levels were determined by immunoblotting with antibodies for human GTPCH, mouse GTPCH, HA, and GAPDH. Representative blots are shown. tet-GCH and tet cells exhibited low levels of mouse GTPCH. sEnd.1 cells demonstrated high levels of mouse GTPCH. Importantly all cell types showed no difference on addition of doxycycline. The presence of human GTPCH/HA tag was observed only in tet-GCH cells which was switched off on addition of doxycycline. GAPDH was used to ensure equal protein loading and showed similar levels in all cells under all conditions. d, GTPCH activity was determined in cell pellets by HPLC. GTPCH activity was abolished in the presence of doxycycline in tet-GCH, where tet cells had barely detectable levels compared sEnd.1 control cells. e, BH4 levels were determined in cell pellets by HPLC. BH4 levels in tet-GCH cells are markedly reduced on addition of doxycycline. tet and sEnd.1 control cells showed very low and high levels of BH4, respectively. The data are presented as the means ± S.E. (n = 3). *, p < 0.05 compared with tet-GCH-DOX. **, p < 0.01 compared with tet-GCH-DOX.
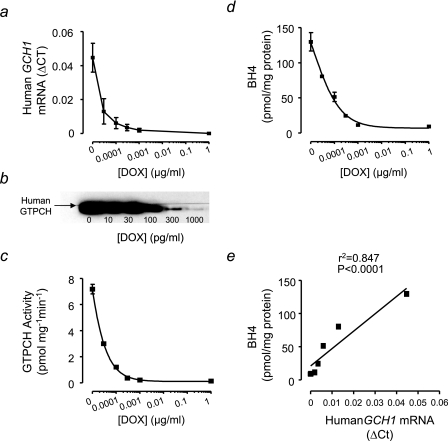
We next sought to establish in more detail the quantitative relationship between GCH1 expression and BH4 production in tet-GCH cells across a range of doxycycline concentrations. We observed a dose-dependent reduction in human GCH1 expression and GTPCH protein in tet-GCH cells exposed to increasing doxycycline concentrations (Fig. 3, a and b). Furthermore, both GTPCH enzymatic activity and cellular BH4 levels showed quantitatively parallel changes in response to doxycycline concentration (Fig. 3, c and d). Indeed, there was a striking linear relationship between human GCH1 mRNA expression and the resulting steady state intracellular BH4 levels (Fig. 3e), suggesting that GCH1 expression is the principal determinant of cellular BH4 levels through corresponding changes in GTPCH protein and enzymatic activity.
FIGURE 3.
Dose-dependent GCH1 `switch -off' in tet-GCH cells. a and b, GCH1 mRNA levels from cell pellets were quantified by real time RT-PCR. Levels of mRNA were corrected for the level of the housekeeping gene β-actin. GTPCH protein levels were determined by immunoblotting for human GTPCH. Human GCH1 expression and GTPCH protein demonstrated a dose-dependent switch-off following exposure to increasing concentrations of doxycycline (DOX) for 10 days. c, GTPCH activity was determined in cell pellets by HPLC. GTPCH enzymatic activity is attenuated following exposure of tet-GCH cells to different concentrations of doxycycline. d, BH4 levels were determined in cell pellets by HPLC and were altered in parallel with GCH1 mRNA expression, GTPCH protein levels, and enzymatic activity. e, a striking linear relationship was observed between human GCH1 mRNA expression and intracellular BH4 levels. The data are presented as the means ± S.E. (n = 3).
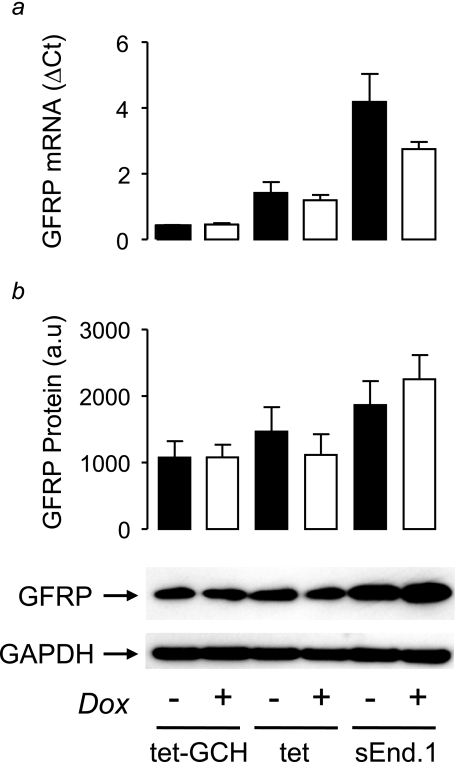
Because the level of GCHFR expression is reported to change in response to inflammatory stimuli that can induce GCH1 expression, we next tested whether alterations in BH4 levels in tet-GCH cells would be accompanied by changes in GFRP expression or protein. Despite the 50-fold change in GCH1 expression and BH4 levels observed in tet-GCH cells exposed to doxycycline, neither GCHFR expression nor GFRP protein levels were significantly altered (Fig. 4), suggesting that altered GFRP levels are not a necessary or direct consequence of primary alterations in GTPCH or BH4 levels.
FIGURE 4.
GCHFR expression and GFRP protein levels in tet-GCH cells. a, GCHFR mRNA levels from cell pellets were quantified by real time RT-PCR. The levels of mRNA were corrected for the level of the housekeeping gene β-actin. GCHFR mRNA levels demonstrated no difference on addition of doxycycline (Dox) in tet-GCH, tet, or sEnd.1 cells. b, GFRP and GAPDH protein levels were determined by immunoblotting. GFRP protein levels showed no difference on addition of doxycycline in all cell types. GAPDH was used to ensure equal protein loading and showed similar levels in all cells under all conditions. The data are presented as the means ± S.E. (n = 3).
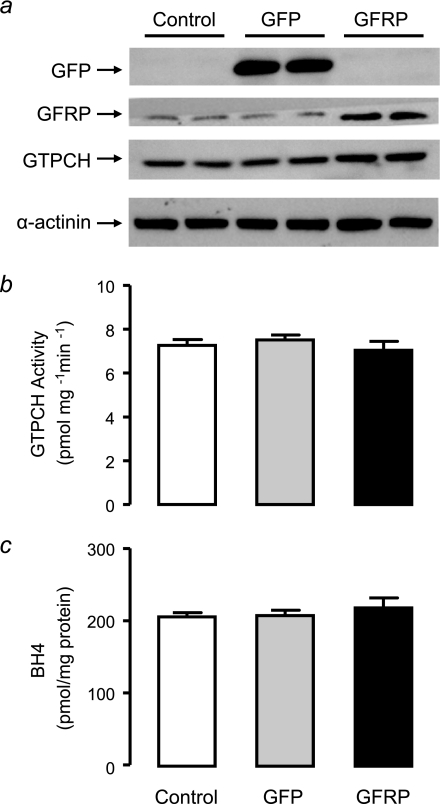
The level of GCH1 expression appears to determine the level of BH4 produced in tet-GCH cells, whereas no difference was observed in GFRP expression and protein levels. The effect of modulating GFRP in this cell line was next investigated to see whether this would influence GTPCH activity and consequently BH4 levels. tet-GCH cells were transfected with mouse GFRP and compared with GFP transfected and untreated control cells. Simultaneous transfections were carried out, and the proteins levels were determined for GFP, GFRP, human GTPCH, and α-actinin by immunoblotting (Fig. 5a). As expected, GFP protein was present only in cells that had been transfected with the protein and was absent in both control and GFRP transfected cells. GFRP protein was elevated by 60% in tet-GCH cells transfected with GFRP, and the level of human GTPCH was not altered upon transfection with GFP or GFRP (Fig. 5a). The transient transfection of GFRP was successful in tet-GCH cells as previously confirmed by protein levels, and additionally the method of transfection (GFP) did not alter GFRP or other proteins. This model was then used to determine whether overexpression of GFRP would alter the activity of GTPCH and BH4 production. GTPCH activity and BH4 levels were not altered following overexpression of GFRP or GFP (Fig. 5, b and c).
FIGURE 5.
GTPCH Protein, GTPCH activity and BH4 levels in tet-GCH cells overexpressing GFRP. tet-GCH cells were transfected with cDNAs encoding GFP or GFRP. a, GFP, GFRP, and GTPCH protein levels were determined by immunoblotting. GFP protein was present only in GFP transfected tet-GCH cells. GFRP protein was significantly elevated in tet-GCH transfected with GFRP. Human and mouse GTPCH were not altered by transfection of either GFP or GFRP.α-actinin protein as a loading control was similar levels in all cells under all conditions. b and c, GTPCH activity and BH4 levels were determined in cell pellets by HPLC. GTPCH activity and BH4 levels were not altered with overexpression of either GFP or GFRP. The data are presented as the means ± S.E. (n = 3).
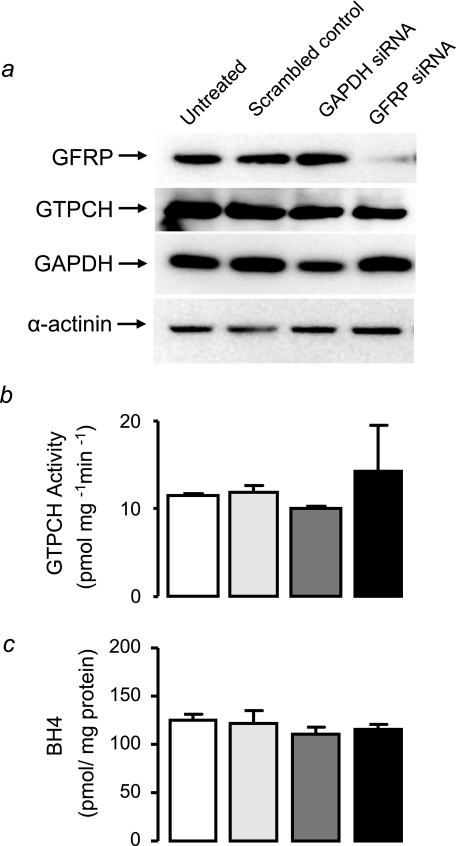
In tet-GCH cells, GTPCH is the principal regulator of BH4 levels, and overexpression of GFRP does not alter the enzymatic activity of GTPCH or levels of BH4. The knockdown of GFRP expression using GFRP-specific siRNA in these cells was next determined. This experiment will provide evidence of whether the absence of GFRP would induce prominent changes in BH4 levels through changes in GTPCH activity. GFRP-specific siRNA dramatically reduced GFRP protein by 84% (Fig. 6a). Human GTPCH was not altered by GFRP knockdown, and a down-regulation in GAPDH protein levels was also observed in tet-GCH cells treated with GAPDH-specific siRNA (Fig. 6a). α-Actinin protein levels were similar in all treated cells in both conditions, demonstrating equal protein loading (Fig. 6a). Having confirmed that GFRP protein levels are knocked down with GFRP-specific siRNA, the activity of GTPCH and BH4 levels were next established to see whether a dramatic reduction in GFRP would cause associated changes in GTPCH activity and consequently BH4 production. GTPCH activity and BH4 levels were not altered in tet-GCH cells treated with GFRP-specific siRNA compared with control cells (Fig. 6, b and c).
FIGURE 6.
Effect of GFRP knockdown on GTPCH protein, GTPCH activity, and BH4 levels in tet-GCH cells. tet-GCH cells were transfected with GFRP-specific, control GAPDH, or scrambled nonspecific siRNA. a, protein levels were determined by immunoblotting for GFRP, GTPCH, GAPDH, and α-actinin. GFRP-specific siRNA induced 84% knockdown of GFRP protein. Importantly, GAPDH knockdown and scrambled control siRNAs had no effect on GFRP protein levels. GAPDH protein was reduced with GAPDH-specific siRNA, whereas α-actinin showed similar levels in all cells under all conditions. b and c, GTPCH activity and BH4 levels were determined in cell pellets by HPLC. GTPCH activity and BH4 levels were not altered by GFRP knockdown. The data are presented as the means ± S.E. (n = 3).
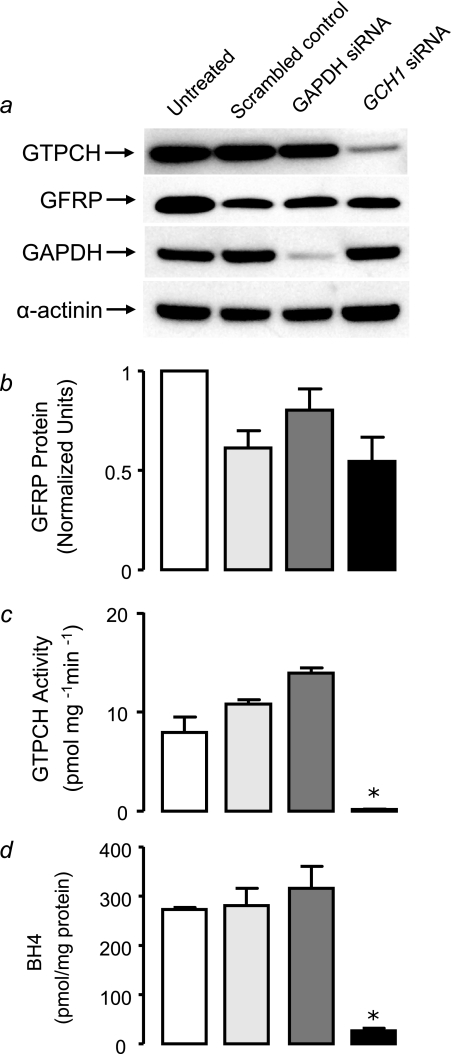
We have observed that altered GTPCH and BH4 levels are not associated with changes in GFRP in this in vitro model. To further confirm this in an endothelial cell line where GFRP regulation has previously been shown (17), we investigated the effect of GTPCH-specific RNA interference in a murine endothelial cell line (sEnd.1). Mouse GTPCH-specific siRNA reduced GTPCH protein levels by 62% (Fig. 7a). A down-regulation in GAPDH protein was also observed with GAPDH-specific siRNA, and our loading control α-actinin was not altered by siRNA treatment (Fig. 7a). Interestingly, siRNA transfection of scrambled negative and GTPCH-specific siRNA resulted in a nonspecific reduction in GFRP protein levels, but specific GTPCH knockdown had no effect on GFRP levels compared with GAPDH knockdown or scrambled siRNA transfection (Fig. 7b). GTPCH activity and BH4 levels were dramatically reduced in sEnd.1 endothelial cells treated with GTPCH-specific siRNA (Fig. 7, c and d).
FIGURE 7.
Effect of GTPCH knockdown on GFRP protein, GTPCH activity and BH4 levels in sEnd.1 cells. sEnd.1 cells were transfected with GTPCH-specific, control GAPDH, or scrambled nonspecific siRNA. a, protein levels were determined by immunoblotting for GFRP, GTPCH, GAPDH, and α-actinin. GTPCH-specific siRNA induced an 62% knockdown of GTPCH protein. There was no significant change in GFRP protein with GTPCH-specific knockdown. Importantly, GAPDH knockdown and scrambled control siRNAs did not have any effect on GTPCH protein levels. GAPDH protein was attenuated with GAPDH-specific siRNA, and α-actinin showed similar levels in all cells under all conditions. b, siRNA transfection resulted in a nonspecific reduction in GFRP protein levels in both scramble control and GTPCH-specific siRNA; however GTPCH knockdown had no effect on GFRP proteins levels compared with GAPDH knockdown or scrambled siRNA transfection. c and d, GTPCH activity and BH4 levels were determined in cell pellets by HPLC. GTPCH activity and BH4 levels were decreased by 98 and 91%, respectively, with GTPCH knockdown in sEnd.1 cells. The data are presented as the means ± S.E. (n = 3).
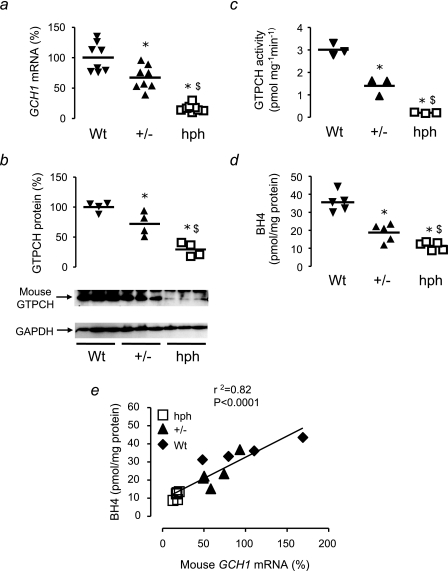
Altered GCH1 Expression in the hph-1 Mouse—Having established quantitative relationships between GCH1 expression, GTPCH, and BH4 in a reductionist cell culture system, we next investigated how primary alterations in GCH1 expression in vivo would alter GTPCH protein, enzymatic activity, and BH4 levels and the effect of these changes on GFRP levels. We determined these parameters in the hph-1 ENU mutant mouse model of reduced GCH1 expression, comparing matched Wt, heterozygote (+/-) and hph-1 (hph) littermates from heterozygote breeding pairs (13). Using real time RT-PCR, we observed a graded reduction in mouse GCH1 mRNA expression in livers of Wt, +/-, and hph mice, by 33% in +/- and by 83% in hph mice (Fig. 8a), confirming that the breeding of heterozygote pairs of hph-1 mice provides an in vivo model of a quantitative reduction in GCH1 expression, across an ∼10-fold range, on an otherwise identical genetic background.
FIGURE 8.
Relationships between GCH1 expression, GTPCH protein, GTPCH activity, and BH4 levels in hph-1 mice. a, mouse GCH1 mRNA levels from 12–18-week-old hph-1 mice were quantified by real time RT-PCR. Levels of GCH1 mRNA are shown as percentages relative to Wt, corrected for the level of the housekeeping gene MLN51. GCH1 expression in hph-1 liver extracts was reduced compared with Wt littermates showing a graded reduction from Wt to +/- to hph (n = 8 animals/group). b, immunoblotting was performed for GTPCH and GAPDH to determine equal protein loading. Liver GTPCH protein levels were reduced in hph mice compared with Wt littermates. GAPDH showed similar levels in all genotypes. The data are displayed as percentages of the mean Wt band intensity (n = 4 animals/group). c, GTPCH enzymatic activity, determined in liver homogenates by HPLC, was reduced in hph-1 mice compared with Wt, with a graded reduction in activity from Wt to +/- to hph. (n = 3 animals/group). d, BH4 levels, determined by HPLC in liver homogenates, were reduced in hph-1 mice compared with Wt littermates and +/- demonstrated an intermediate phenotype (n = 5 animals/group). The horizontal bars represent the means. *, p < 0.05 compared with Wt; $, p < 0.05 compared with +/-. e, there was a strong correlation between the expression of GCH1 and the BH4 levels in liver extracts of hph-1, +/-, and Wt mice.
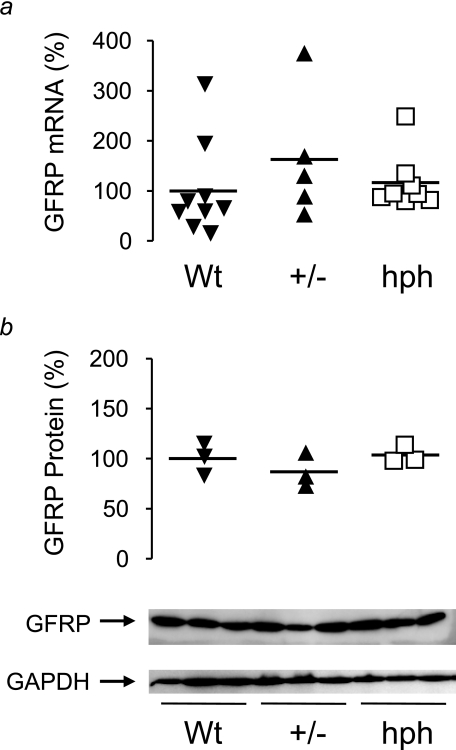
Immunoblotting for mouse GTPCH protein revealed a stepwise reduction from Wt to +/- to hph littermates (Fig. 8b), paralleled by quantitative changes in GTPCH enzymatic activity and tissue BH4 levels (Fig. 8, c and d). The levels of GCH1 expression between Wt, +/-, and hph mice were strongly correlated with BH4 levels (Fig. 8e), suggesting that in mouse liver in vivo, GCH1 expression is the primary regulator of tissue BH4 levels, without any evidence that the linear relationship between GCH1 expression and BH4 is significantly altered by other regulatory factors. Indeed, we found no difference in either GCHFR expression or GFRP protein levels between Wt, +/-, and hph mice, despite the substantial differences in GTPCH activity and BH4 levels (Fig. 9).
FIGURE 9.
Effect of altered GCH1 expression and BH4 levels on GCHFR expression and GFRP protein levels in mouse liver extracts. a, GCHFR mRNA levels from 12–18-week-old hph-1 mice were quantified by real time RT-PCR. Levels are shown as percentages relative to Wt, corrected for the level of the housekeeping gene MLN51. GCHFR expression showed no significant difference between Wt, +/-, and hph mice. The horizontal bars represent the means of n = 5–9 animals/group. b, immunoblotting was performed for GFRP and GAPDH to determine equal protein loading. Liver GFRP protein levels showed no difference between the genotypes. GAPDH showed similar levels in all genotypes. The data are displayed as percentages of the mean Wt band intensity; the horizontal bars represent the means of n = 3 animals/group.
DISCUSSION
In this study we have systematically quantified the relationships between GCH1 expression and BH4 levels in two contrasting model systems: first, in a novel cell line with tet regulatable expression of GCH1, and second, in an in vivo mouse model with a graded deficiency in GCH1 expression (the hph-1 mouse). Both of these genetic models tested the effects of primary alterations in steady state BH4 levels, through altered GCH1 expression, without the potentially nonspecific and confounding effects of stimuli such as pro-inflammatory cytokines that have been used to alter GCH1 expression in previous studies. The major findings of this study are that GCH1 mRNA expression directly correlates with the protein level and enzymatic activity of GTPCH along with BH4 production in both cultured cells and in the hph-1 mouse. Despite the marked alterations in GCH1 expression and BH4 induced in these models, GFRP mRNA and protein levels remained unchanged.
These findings provide important insights into the regulation of BH4 levels by GCH1 expression. Previous studies have reported immunostimulant induction of GCH1 mRNA expression and BH4 synthesis necessary for inducible nitric-oxide synthase activity in smooth muscle cells (18–21). Furthermore, treatment of endothelial cells with hydrogen peroxide has been shown to cause an increase in GCH1 expression and BH4 levels (22). These studies provide evidence that GCH1 expression and BH4 levels are increased concomitantly with immunostimulants and hydrogen peroxide. GTPCH activity can also be modulated by phosphorylation and by protein-protein interactions with GFRP. However no studies have tested the quantitative importance of these putative regulatory factors in modulating GTPCH activity or systematically quantified the relationship between GCH1 expression and BH4 synthesis under steady state conditions. We now show a direct correlation between BH4 levels and GCH1 expression and between BH4 levels, GTPCH activity, and GTPCH protein levels, suggesting that GTPCH specific activity remains constant across a wide range of GTPCH and BH4 levels, arguing against a significant role for feedback inhibition or other BH4-dependent regulatory pathways under these steady state conditions.
Recent studies have reported a specific role for GFRP on the regulation of BH4 synthesis and demonstrate that proinflammatory stimuli can alter the expression of GCHFR in cultured cells (6–8). Werner et al. (6) studied the regulation of GCHFR expression by proinflammatory stimuli and demonstrated that exposure of human myelomonocytoma and human umbilical vein endothelial cells leads to the suppression of GCHFR mRNA. Additionally, down-regulation of GCHFR mRNA in liver, lung, and spleen was observed following treatment of rats with lipopolysaccharide by intraperitoneal injection. Gesierich et al. (8) also observed increased expression of GCH1 in human umbilical vein endothelial cells when stimulated with interferon-γ and also a down-regulation in GCHFR mRNA. A more recent study has investigated the relationship between GTPCH and GFRP in endothelial cells and cardiac myocytes treated with lipopolysaccharide (7), observing suppression of GCHFR mRNA expression without a concomitant increase in GTPCH protein and elevated biopterin levels. Importantly, these studies did not test whether the observed changes in GCHFR expression were causally related to altered GTPCH activity or BH4 biosynthesis. A possible antioxidant role of GFRP has also been suggested. Kalivendi et al. (7) studied the effect of hydrogen peroxide on GFRP in relation to GTPCH and BH4 biosynthesis and observed an increase in GCHFR mRNA in parallel with GTPCH protein, and this resulted in a decrease in BH4 levels. These results indicate that GFRP could also be involved in oxidant signaling pathways where up-regulation of GFRP could inhibit GTPCH activity and thus reduce BH4 levels. However, in contrast to this study, Ishii et al. (9) observed changes in GFRP following exposure of endothelial cells to hydrogen peroxide. They demonstrated a marked down-regulation of GCHFR mRNA levels in brain microvascular endothelial cells compared with an increase in GCH1 mRNA and BH4 levels. The exposure of cells to proinflammatory stimuli or hydrogen peroxide could have confounding effects on the expression of other genes or on biopterin biochemistry through oxidative stress.
In our current study, we demonstrated no difference in GCHFR expression or GFRP protein levels in two distinct models of altered GCH1 expression, without the potentially confounding effects of other stimuli. Importantly, we demonstrated that modulation of GFRP by both overexpression and genetic knockdown in our tet-regulatable cell line did not affect the activity of GTPCH or BH4 levels. Moreover, genetic knockdown of GTPCH in sEnd.1 endothelial cells and, consequently, the reduction in BH4 levels were not accompanied by changes in GFRP. Therefore, genetic modulation of both GFRP and GTPCH further confirms that GTPCH is the determinant of BH4 levels and is not associated with changes in GFRP.
In support of our observations, Nandi et al. (17) also showed that under basal conditions, overexpression of GCHFR did not affect BH4 production in sEnd.1 endothelial cells but did alter BH4 levels after incubation of cells with cytokines and lipopolysaccharide. Taken together, these data suggest that GFRP may have a more important regulatory role in proinflammatory states, perhaps where BH4 is necessary for inducible nitricoxide synthase function, whereas under physiological conditions our data suggest that GTPCH is the principal regulator of steady state BH4 levels.
An important mechanism of GFRP-mediated GTPCH regulation is in relation to phenylalanine metabolism. BH4 is an essential cofactor for phenylalanine hydroxylase that catalyzes the conversion of phenylalanine to tyrosine; mutations in this gene cause phenylketonuria. GFRP appears to stimulate GTPCH activity in the presence of elevated phenylalanine levels. In support of this mechanism, clinical studies have revealed elevated biopterin levels in phenylketonuria patients with hyperphenylalaninemia (23).
Taken together, these results establish a pivotal role for GTPCH in the regulation of BH4 in both in vivo and in vitro models, with GCH1 expression directly related to steady state BH4 levels. Furthermore, mRNA expression and protein levels of GFRP are not altered despite substantial differences in GCH1 expression BH4 levels. These findings indicate that in basal states, GCH1 is the primary regulator of intracellular BH4 levels, and alterations in GCH1 expression are not associated with changes in GCHFR expression or GFRP protein levels.
Footnotes
The abbreviations used are: BH4, tetrahydrobiopterin; GTPCH, GTP cyclohydrolase I; GFRP, GTP cyclohydrolase feedback regulatory protein; Wt, wild type; HA, hemagglutinin; RT, reverse transcription; GAPDH, glyceraldehyde-3-phosphate dehydrogenase; HPLC, high pressure liquid chromatography; GFP, green fluorescent protein; siRNA, small interfering RNA.
References
- 1.Katusic, Z. S., Stelter, A., and Milstien, S. (1998) Arterioscler. Thromb. Vasc. Biol. 18 27-32 [DOI] [PubMed] [Google Scholar]
- 2.Hesslinger, C., Kremmer, E., Hultner, L., Ueffing, M., and Ziegler, I. (1998) J. Biol. Chem. 273 21616-21622 [DOI] [PubMed] [Google Scholar]
- 3.Harada, T., Kagamiyama, H., and Hatakeyama, K. (1993) Science 260 1507-1510 [DOI] [PubMed] [Google Scholar]
- 4.Milstien, S., Jaffe, H., Kowlessur, D., and Bonner, T. I. (1996) J. Biol. Chem. 271 19743-19751 [DOI] [PubMed] [Google Scholar]
- 5.Yoneyama, T., and Hatakeyama, K. (1998) J. Biol. Chem. 273 20102-20108 [DOI] [PubMed] [Google Scholar]
- 6.Werner, E. R., Bahrami, S., Heller, R., and Werner-Felmayer, G. (2002) J. Biol. Chem. 277 10129-10133 [DOI] [PubMed] [Google Scholar]
- 7.Kalivendi, S., Hatakeyama, K., Whitsett, J., Konorev, E., Kalyanaraman, B., and Vasquez-Vivar, J. (2005) Free Radic. Biol. Med. 38 481-491 [DOI] [PubMed] [Google Scholar]
- 8.Gesierich, A., Niroomand, F., and Tiefenbacher, C. P. (2003) Basic Res. Cardiol. 98 69-75 [DOI] [PubMed] [Google Scholar]
- 9.Ishii, M., Shimizu, S., Wajima, T., Hagiwara, T., Negoro, T., Miyazaki, A., Tobe, T., and Kiuchi, Y. (2005) J. Pharmacol. Sci. 97 299-302 [DOI] [PubMed] [Google Scholar]
- 10.Cai, S., Alp, N. J., Mc Donald, D., Canevari, L., Heales, S., and Channon, K. M. (2002) Cardiovasc. Res. 55 838-849 [DOI] [PubMed] [Google Scholar]
- 11.Williams, R. L., Risau, W., Zerwes, H. G., Drexler, H., Aguzzi, A., and Wagner, E. F. (1989) Cell 57 1053-1063 [DOI] [PubMed] [Google Scholar]
- 12.McDonald, J. D., and Bode, V. C. (1988) Pediatr. Res. 23 63-67 [DOI] [PubMed] [Google Scholar]
- 13.Khoo, J. P., Nicoli, T., Alp, N. J., Fullerton, J., Flint, J., and Channon, K. M. (2004) Mol. Genet Metab. 82 251-254 [DOI] [PubMed] [Google Scholar]
- 14.Werner-Felmayer, G., and Gross, S. S. (1996) in Methods in Nitric Oxide Research (Feelish, M., and Stamler, J. S., eds) pp. 271-299, John Wiley & Sons, Ltd.
- 15.Howells, D. W., Smith, I., and Hyland, K. (1986) J. Chromatogr. 381 285-294 [DOI] [PubMed] [Google Scholar]
- 16.Heales, S., and Hyland, K. (1989) J. Chromatogr. 494 77-85 [DOI] [PubMed] [Google Scholar]
- 17.Nandi, M., Kelly, P., Vallance, P., and Leiper, J. (2008) Vasc. Med. 13 29-36 [DOI] [PubMed] [Google Scholar]
- 18.Gross, S. S., Levi, R., Madera, A., Park, K. H., Vane, J., and Hattori, Y. (1993) Adv. Exp. Med. Biol. 338 295-300 [DOI] [PubMed] [Google Scholar]
- 19.Hattori, Y., and Gross, S. S. (1993) Biochem. Biophys. Res. Commun. 195 435-441 [DOI] [PubMed] [Google Scholar]
- 20.Nakayama, D. K., Geller, D. A., Di Silvio, M., Bloomgarden, G., Davies, P., Pitt, B. R., Hatakeyama, K., Kagamiyama, H., Simmons, R. L., and Billiar, T. R. (1994) Am. J. Physiol. 266 L455-L460 [DOI] [PubMed] [Google Scholar]
- 21.Walter, R., Linscheid, P., Blau, N., Kierat, L., Schaffner, A., and Schoedon, G. (1998) Immunol. Lett. 60 13-17 [DOI] [PubMed] [Google Scholar]
- 22.Shimizu, S., Shiota, K., Yamamoto, S., Miyasaka, Y., Ishii, M., Watabe, T., Nishida, M., Mori, Y., Yamamoto, T., and Kiuchi, Y. (2003) Free Radic. Biol. Med. 34 1343-1352 [DOI] [PubMed] [Google Scholar]
- 23.Ponzone, A., Guardamagna, O., Spada, M., Ponzone, R., Sartore, M., Kierat, L., Heizmann, C. W., and Blau, N. (1993) Clin. Chim. Acta 216 63-71 [DOI] [PubMed] [Google Scholar]


