

Abstract
The present study sought to characterize alcohol’s stress-response-dampening (SRD) effects on multiple measures of stress and whether these effects are mediated by reductions in sustained attention and, further, whether baseline levels of sustained attention moderate SRD. One hundred six men consumed either an alcohol (0.70 g/kg) or a placebo beverage prior to learning that they would deliver a self-disclosing speech. Structural equation models controlling for multiple baseline periods indicated that alcohol directly reduced self-reported anxiety and skin conductance levels in response to the stressor. Alcohol’s effect on reducing heart rate response, in contrast, was indirect and mediated by effects on prestress baseline. As hypothesized, differences in sustained attention partially mediated the effects of alcohol on skin conductance (but not heart rate or self-reported anxiety) and served as a moderator of alcohol’s effects on skin conductance response. Findings are discussed in terms of theoretical links among alcohol consumption, specific cognitive abilities, and stress reactivity.
Keywords: alcohol, stress, anxiety, emotion, autonomic activity
Alcohol has long been assumed to reduce stress. This idea has existed in popular culture for over 2,000 years (see Sayette, 1999) and has been the subject of scientific investigation for more than half a century (see Greely & Oei, 1999; Sayette, 1993a; Sher, 1987). Using drive theory (Dollard & Miller, 1950) as a conceptual frame, Conger (1956) was the first to formally propose that under conditions of conflict, alcohol might reduce the intensity of anxiety-based responses. His original “drive reduction hypothesis”—and later modifications to the theory provided by others (see, e.g., Cappell & Greeley, 1987; Cappell & Herman, 1972; Greeley & Oei, 1999; Sher, 1987; Sher & Grekin, 2007)—predicts a bidirectional relationship between alcohol and stress: Alcohol consumption should reduce stress (in certain situations), and (some) stressful situations should motivate alcohol consumption. Numerous studies using diverse empirical approaches clearly demonstrate that, under conducive conditions, many individuals will consume alcohol in response to various stressors and negative emotional states (see Sher & Grekin, 2007). However, the nature of alcohol’s effect on response to threat in humans remains to be fully characterized.
In particular, despite the large number of studies examining the hypothesized stress-response-dampening (SRD; Levenson, Sher, Grossman, Newman, & Newlin, 1980) effects of alcohol, there is little consensus as to whether or under what conditions alcohol reduces stress. In recent years, researchers have attempted to account for the equivocal findings noted by reviewers of this literature (e.g., Cappell & Herman, 1972) by specifying the conditions under which SRD effects should be expected (see Cappell & Greeley, 1987; Pohorecky, 1991; Sayette, 1993a; Sher, 1987; Sher & Grekin, 2007; Steele & Josephs, 1990; Wilson, 1982). One of the first such statements was made by Levenson et al. (1980), who noted that SRD effects should be most evident when a valid stressor is used (i.e., a situation known to produce stress in sober individuals), when alcohol’s effects are assessed during stress anticipation and stress onset, and when relatively large alcohol doses are administered. These researchers also advised the use of multiple baseline assessments (both predrinking and postdrinking) to control for potential changes in physiological indicators associated with consumption and the use of multiple indicators of stress, including both physiological and self-report measures (see also Greeley & Oei, 1999; Sayette, 1999; Sher & Walitzer, 1986).
The importance of individual-difference variables as moderators of susceptibility to SRD effects has been known for many years (Sher, 1987). However, research on moderators of SRD effects has been largely divorced from efforts to characterize the psychological processes mediating alcohol’s effect on SRD. In the present article, we examined the question of whether individual differences in a clinically important aspect of attention relate to SRD effects and then, further, whether changes in attentional processes mediate the magnitude of SRD. Mapping traditional measures of attentional dysfunction onto alcohol effects holds the potential for providing insights into mechanisms that explain how risk characteristics relate to etiological processes (e.g., Sher, 1991).
Attentional Factors
In attempting to account for alcohol’s variable effects on stress responses, Steele and Josephs (1988, 1990; see also Josephs & Steele, 1990) posited that alcohol should primarily produce SRD when attention to the stressor is limited. Their attention-allocation model predicts that alcohol reduces the focus (or capacity) of attention, limiting both the range of cues that can be perceived and the ability to fully process cues that are perceived. A number of studies have shown support for hypotheses derived from this model as it pertains to SRD. For example, Curtin, Lang, Patrick, and Stritzke (1998) found that alcohol reduced the magnitude of fear-potentiated startle, but only under conditions of divided attention (see also Josephs & Steele, 1990; Steele & Josephs, 1988). In a similar study, Curtin, Patrick, Lang, Cacioppo, and Birbaumer (2001) showed that alcohol reduced an electrocortical measure of attention to threat cues, but again only when attention was divided. However, other studies (e.g., Sayette, 1993a; Sayette, Smith, Breiner, & Wilson, 1992; Sher & Walitzer, 1986), including those in which measures of attention have been linked to alcohol’s effects (e.g., Sayette, Martin, Perrott, Wertz, & Hufford, 2001), have reported alcohol-related SRD even without divided attention, suggesting that competing task demands are not essential to alcohol’s anxiolytic effects or to the presumed role of attention in this process. Perhaps more critically, recent evidence (Donohue, Curtin, Patrick, & Lang, 2007) suggests that at relatively high doses (i.e., blood alcohol concentrations ≥ .07%), robust effects of alcohol on negative emotional responses can be observed in the absence of attentional manipulations. Moreover, measures of attention used in some prior experiments, such as having participants rate slides on either easy or difficult dimensions while awaiting a stressor (Josephs & Steele, 1990), arguably involve numerous processes beyond attention. In any event, the extent to which alcohol-induced reductions in attention mediate (account for) alcohol’s SRD effects has received only limited evaluation in prior work.
Another complexity with the attention-allocation model is that attention is a multidimensional construct, including both a span or capacity component and a processing component (Cowan et al., 2005). Although the original attention-allocation hypothesis suggested that alcohol influences the capacity component by reducing the focus of attention (Steele & Josephs, 1990), there is little evidence for this proposition. Tasks that were described in previous research testing the attention-allocation model as measures of attention span, such as latency to respond to a secondary task (Josephs & Steele, 1990), may more accurately reflect secondary effects on task switching (e.g., Lépine, Bernadin, & Barrouillet, 2005). Most other research on alcohol and attention, including relevant studies in the SRD literature (e.g., Curtin et al., 2001), is consistent with the idea that alcohol limits the degree of attention paid to stimuli or the extent to which stimuli are processed rather than limiting the capacity of the focus of attention per se. Recent research from our lab also suggests that alcohol’s effects on attention are limited to the processing component. For example, Bartholow et al. (2003) found that alcohol increased the interference caused by peripheral distractors; a strict interpretation of the attention-allocation model would predict a reduction of interference by alcohol. In addition, Saults, Cowan, Sher, and Moreno (2006) found that alcohol did not limit the capacity of the focus of attention in a series of change-detection memory tasks but did impair processes that are important for remembering sequences, like recoding, rehearsal, and sustaining attention.
On this basis, we examined tenets of the attention-allocation model by obtaining estimates of sustained attention both before and after consumption. Sustained attention refers to the maintenance of focused attention over extended periods (also known as vigilance; see Ballard, 1996) and therefore reflects a key processing component of attention (cf. Dias, Foxe, & Javitt, 2003). The continuous performance task (CPT; Conners, 1994; Rosvold, Mirsky, Sarason, Bransome, & Beck, 1956) is one means of assessing both baseline levels and changes in sustained attention that might result from alcohol consumption. In the CPT, participants must monitor presentations of letters and make behavioral responses to all target letters while inhibiting responses to nontargets. Thus, the task measures the extent to which participants maintain their attention in order to discriminate target and nontarget stimuli. The CPT is also widely used clinically as a measure of disorders of inhibition such as attention-deficit/hyperactivity disorder (ADHD; e.g., O’Daugherty, Nuechterlein, & Drew, 1984) and not only robustly distinguishes those with ADHD from controls but is associated with virtually all ADHD symptoms (e.g., Epstein et al., 2003). Moreover, attentional problems such as those manifested in ADHD are a strong correlate of a family history of alcohol dependence and often precede alcohol dependence developmentally (particularly when accompanied by comorbid conduct problems), suggesting that attentional problems may represent an endophenotype associated with vulnerability to alcoholism (Lie, 1992; Wilens & Biederman, 2006). Thus, from both an empirical and a clinical perspective, the CPT should be an appropriate measure of attention-related processes that might mediate alcohol’s SRD effects.
A number of previous studies have established the criterion validity of vigilance tasks for characterizing the effects of alcohol on cognition (for a review, see Koelega, 1995). Early reports tended to conclude that, unlike divided-attention tasks, vigilance tasks are insensitive to alcohol’s effects (e.g., Linnoila, 1974; Moskowitz, 1973; Moskowitz & DePry, 1968). But more recent reports have shown that, with a sufficiently large dose and a task that truly requires maintenance of attention over time, alcohol effects do emerge. For example, Rohrbaugh et al. (1988) found that impairment on CPT measures of sensitivity (a’ and d’ from signal detection theory) increased markedly between low-dose (0 and .45 g/kg) and higher dose (.80 and 1.05 g/kg) conditions (see also Linnoila, Erwin, Cleveland, Logue, & Gentry, 1978). Other researchers similarly have reported no effects at low doses (e.g., Davidson, Camara, & Swift, 1997). More important, however, in no previous study has the potential link between alcohol-induced impairment of sustained attention and alcohol-related SRD been tested. This was a major aim of the present research.
In addition to its potential role as a mediator of alcohol’s effects on SRD, attention could potentially be a moderator (i.e., change the magnitude) of alcohol’s effects. A number of researchers have suggested that alcohol’s influence on cognitive processes, especially attention, might be particularly reinforcing for individuals with reduced cognitive capacity (e.g., Giancola & Moss, 1998; Peterson, Finn, & Pihl, 1992), which could explain the association between low-cognitive function and increased alcohol abuse (e.g., Blume, Marlatt, & Schmaling, 2000; Deckel & Hesselbrock, 1996; Pihl & Peterson, 1995). On the basis of this logic, it has been hypothesized that individuals with low-cognitive function might show enhanced SRD effects of alcohol (e.g., Sayette, 1993a). However, Pihl, Assaad, and Hoaken (2003) recently reported that, in contrast to sober men with high-cognitive functioning, sober men with low-cognitive resources showed no heart rate acceleration when learning of an imminent stressor. On the basis of these data, it seems that individuals with limited resources might be less sensitive to alcohol’s SRD effects than those with more cognitive resources. Given the importance of stressor appraisal (Sayette, 1993a), individuals who do not sufficiently appraise a stressor when sober (i.e., those with low-cognitive resources) and therefore do not show a heightened stress reaction might not show a change in appraisal (and, therefore, a reduced stress response) following alcohol consumption, relative to individuals who appraise stressors more thoroughly when sober. Taken together, these data and theory suggest that differences in cognitive resources might affect the magnitude of SRD effects, though the direction of these differences is presently unclear, and existing research is conflicting.
Temporal Parameters
A critical experimental parameter affecting SRD effects is the timing of baseline measures relative to consumption. Alcohol consumption produces short-term increases in resting heart rate (e.g., Levenson et al., 1980; Sher, Bylund, Walitzer, Hartmann, & Ray-Prenger, 1994; Sher & Walitzer, 1986), whereas consumption of other (e.g., placebo) beverages generally produces short-term heart rate deceleration (e.g., Ewing & McCarty, 1983; Newlin, 1985; Sayette & Wilson, 1991). Sayette (1993b) has argued that the magnitude of SRD effects on heart rate varies as a function of the amount of time between beverage absorption and onset of the stressor. Thus, establishing the true nature of alcohol’s SRD effect on heart rate appears to depend on obtaining a postconsumption baseline in which alcohol and placebo groups do not differ. Doing so should require delaying stress onset until consumption-related changes in heart rate have abated; Sayette (1993b) noted that “the direct increase in basal heart rate associated with alcohol consumption usually requires about a 35-40 minute absorption time” (p. 804).
It also has been suggested (e.g., Sher, 1987) that similar issues can arise when using other physiological indicators of stress response, such as skin conductance level (SCL). SCL is an excellent indicator of anxiety or stress because of its relation to behavioral inhibition (Fowles, 1988). In an early study of the effect of alcohol on “emotional tension” using electrodermal activity, Greenberg and Carpenter (1957) found,
amounts of alcoholic beverage considerably less than those commonly observed to cause intoxicated behavior [estimated BACs of approximately .05%-.06%] . . . reduce[d] emotional tension, as measured by skin conductance, to a significant degree. This diminution occurred not only with the less intense variety of tension usually associated with ordinary performance [a lengthy, tedious card filing task] but also with the more intense emotional response which occurs under sudden stress [a loud, unexpected blast of noise]. (pp. 202-203)
However, SCL has only inconsistently shown SRD effects of alcohol, with some studies showing SRD effects on SCL, at least for some participants and others reporting no such effects (see Sher, 1987). Similar inconsistencies characterize the literature on skin conductance orienting responses (Maltzman & Marinkovic, 1996) and appear attributable, at least in part, to “alcohol dose [and] the type of task” (p. 252). However, beyond general design features, it seems likely that several methodological aspects of electrodermal recording contribute to the discrepancies in the literature. For example, in some of our early work (Levenson et al., 1980; Sher & Levenson, 1982), a commercial electrocardiogram (EKG) gel was used, although it is now widely accepted that such conductive mediums “should not be used because they usually contain near saturation levels of NaCl and therefore may introduce measurement errors” (Dawson et al., 1990, p. 301; see also Fowles et al., 1981). Additionally, in other prior work (Sher et al., 1994), we have directly measured skin resistance (subsequently reciprocally transformed into conductance units) using a constant current device, although methodologists argue strongly that skin conductance should typically be measured using a constant voltage technique (e.g., Dawson et al., 1990; Edelberg, 1967; Fowles et al., 1981; Montague & Coles, 1966; Wilcott & Hammond, 1965). Consideration of individual studies of alcohol’s effects on electrodermal response to stress reveals much heterogeneity of recording methods and experimental design, making it difficult to identify those variables that distinguish studies yielding positive versus null findings.
Summary and Hypotheses
The primary aim of this research was to test sustained attention as a mediator and moderator of alcohol’s hypothesized SRD effect.1 Participants were randomly assigned to consume either alcohol or a placebo beverage prior to delivering a speech on things they like and dislike about their physical appearance, as in previous research (e.g., Levenson et al., 1980). Alcohol’s hypothesized SRD effect was tested by examining changes in self-reported, cardiovascular, and electrodermal indicators of stress, using multiple baseline periods. On the basis of our review of the literature, we hypothesized that alcohol-induced limits on the ability to sustain attention would mediate the link between alcohol consumption and SRD. We also hypothesized that the magnitude of the SRD effect would differ according to baseline levels of cognitive function, operationalized here as performance on the CPT, although the direction of this moderation was unclear (see Giancola & Moss, 1998; Pihl et al., 2003). Finally, we predicted that whether alcohol produces SRD would depend on the baseline used for comparison.
Method
Participants
Men between the ages of 21 and 25 were recruited for a study of alcohol’s effects, using advertisements in local periodicals and posted flyers. Respondents were initially screened via a structured telephone interview and were determined to be ineligible if they (a) lived more than 5 miles from the laboratory site; (b) had current acute or a chronic medical or psychiatric condition or had been taking a prescription medication for a significant period of time; (c) had a history of perceived or actual alcohol-related problems or had reported ever attempting to abstain from alcohol because of concerns about drinking; (d) did not drink on a regular basis; and/or (e) smoked more than one pack of cigarettes per day (to avoid acute withdrawal effects during the rather lengthy lab session). The final sample selected for participation consisted of 106 participants (96% White/Caucasian), all of whom adhered to a preexperimental protocol that included abstention from all drugs and alcohol for 24 hr prior to their appointment, eating a light meal 4-6 hr before their session, and avoiding strenuous exercise on the day of their appointment. Participants were reminded of their appointment and these instructions with a phone call the day before and a postcard sent to their residence. Participants were compensated with a $25 stipend. Participants reported drinking alcohol an average of 2.70 times per week and 2.71 drinks per occasion over the past year.
Measures
Measures Administered at Baseline (Predrink)
Individual differences
We compiled 17 items (α = .64) indicative of symptoms of current ADHD (e.g., “Do you often have difficulty listening when someone is speaking to you?”) using Diagnostic and Statistical Manual of Mental Disorders, 4th edition (American Psychiatric Association, 1994) criteria. Participants also completed a 36-item measure of alcohol outcome expectancies developed and previously used in this laboratory (for details see Sher, Walitzer, Wood, & Brent, 1991; Sher, Wood, Wood, & Raskin, 1996). Participants entered their responses to these individual-difference measures directly into a computer, using a software-guided data entry procedure.
Cognitive function
The CPT (Conners, 1994) provided a measure of both baseline and postdrinking differences in sustained attention. The CPT is a 14-min computerized task consisting of a series of letters presented for 250 ms in 18 blocks of 20 trials at interstimulus intervals varying between 1 and 4 s. Participants were told to press the left mouse key for every letter (i.e., targets) except the letter X (i.e., nontarget). The CPT is related to a number of similar tasks that have been used in both clinical and nonclinical populations to measure sustained attention, demonstrating moderate to high reliability and validity (Halperin, Sharma, Greenblatt, & Shwartz, 1991). Changes in d’ served as our measure of changes in the ability to sustain attention throughout the task. In signal detection theory, d’ is considered to be a bias-free measure of the sensitivity of a sensory system in that it reflects a respondent’s sensory ability but is unaffected by their willingness to respond (See, Howe, Warm, & Dember, 1995; Warm, 1984). In the CPT, d’ is calculated as the standardized probability of hits (correctly responding when the target is present) minus the standardized probability of false alarms (incorrectly responding when the target is absent). Thus, larger d’ values indicate better discrimination between target and nontarget items, representing the extent to which focused attention can be sustained (see Munro, Dawson, Schell, & Sakai, 1987).
Measures Administered Following Consumption
Sustained attention
The CPT was administered both at baseline and at two postdrinking assessments during the study. The postdrinking assessments were intended to provide an index of alcohol-related changes in attention that might covary with alcohol’s effects on stress responses.
Physiological measures
Heart rate (HR) and SCL served as physiological measures of stress response. The EKG was measured with Ag/AgCl electrodes (BIOPAC EL200 series affixed with Sigma gel, BIOPAC Systems, Inc., Goleta, CA) placed on each side of the chest (with ground attached to an earlobe). Cardiac interbeat interval (IBI) was determined by measuring the time between successive R-waves online, via a peak detection algorithm. Prior to final estimation, the accuracy of all R-wave detections was reviewed and edited if necessary (e.g., due to motion artifact). IBI data were subsequently transformed into HR data prior to statistical analysis. SCL was measured with Ag/AgCl electrodes attached to the medial phalanges of the first and third fingers of the nondominant hand, using electrode paste consisting of one part 0.15 M NaCl (0.9%) to two parts Unibase (see Fowles et al., 1981). All electrodes and transducers were connected to BIOPAC amplifiers (with the electrodermal response amplifier using a constant voltage [.5 V] approach). The EKG was sampled at 1000 Hz and SCL at 1 Hz.
Subjective anxiety
Participants indicated changes in subjective levels of stress with an “anxiety scale” (ANX), or stress bar, which appeared on a computer monitor. Participants were told that they were to use the 10-point scale, ranging from 1 (extremely relaxed) to 10 (extremely tense), as an indication of how anxious they felt and that they were to use the right/left arrow keys on the computer keyboard to indicate any changes in their level of anxiety that occurred throughout the study. The computer monitored this measure once per second.
Procedure
Experimental procedures were carried out by paired graduate (GRA) and undergraduate (URA) research assistants. Only the URA was aware of true beverage condition in each session. Experimental sessions each included only 1 participant. Figure 1 graphically depicts the timeline for all experimental procedures up until the end of physiological recordings.
Figure 1.

Graphical representation of experimental tasks in the experiment. BAC = blood alcohol concentration; CPT = continuous performance task; BL = baseline.
Preexperimental procedures
Experimental sessions were scheduled to begin between 2:00 p.m. and 3:30 p.m. Upon arriving for their appointment, participants’ weight and height were measured, and their age was verified. Participants were then asked to sign an affidavit verifying that they had complied with the preexperimental instructions. The URA then took a breath sample (Alco Sensor IV; Intoximeters, St. Louis, MO) to ensure that no participants had consumed alcohol prior to the laboratory session; all readings were zero.
The GRA then told participants that the study would involve several computer tasks, the possible administration of alcohol, and that electrodes would be attached to their body so that physiological indices of nervous system activity could be measured. Participants were told that they would also be required to prepare and give a speech that would be taped and later evaluated for content by graduate students.2 Participants also were informed that the results from this study would provide insight into the relationship between alcohol use, attention, and physiological activity. After informed consent was obtained, the computerized questionnaire was administered.
After completion of the questionnaire, participants were led to the experimental room where they were seated in front of a computer. The GRA gave instructions for performing the CPT and gave a standard practice session, after which the participants completed the first CPT trial (CPT1). Participants then were asked to urinate in a nearby restroom to empty the bladder prior to beverage administration.
Predrink phase
After recording electrodes were attached, the GRA instructed participants on the use of the stress bar. A 10-min adaptation period then commenced, after which a 3-min recording was taken to establish predrink baseline levels of HR, SCL, and ANX.
Drinking protocol
Participants were randomly assigned to either the placebo group (n = 53) or the alcohol group (n = 53; a 0.70 g/kg dose, determined by body weight, in a beverage containing 100-proof Smirnoff vodka mixed with tonic).3 The placebo beverage contained a small amount of vodka (.07 g/kg) mixed with tonic to increase smell and taste cues; vodka also was smeared on the rims of all glasses. In both conditions, an experimenter ostensibly mixed a beverage containing a moderate dose of alcohol mixed in a 5:1, tonic-to-vodka, ratio. The placebo dose was achieved by using diluted vodka (nine parts decarbonated tonic to one part 100-proof vodka premixed in a vodka bottle), and the high alcohol dose was achieved by using spiked tonic (four parts tonic to one part 100-proof vodka premixed in a tonic bottle). Collars were used to indicate the actual contents of each bottle (e.g., “spiked tonic,” “regular tonic,” and so forth), and the lead experimenter removed the collars before the bottles were brought to the second experimenter, who mixed the drinks in front of the participants. All participants were informed that they had been given a moderate amount of alcohol in order to control for expectancy effects. The beverage was administered in three equal amounts over the course of 15 min (i.e., 5 min per drink). Limejuice was added for flavor.
Postdrink phase
Following ingestion of the third drink, participants sat quietly for 10 min while the alcohol was absorbed. At the end of this absorption phase, a 3-minute recording of the physiological measures and the stress bar were taken to establish the first postdrink baseline (Postdrink 1).
The participant then rinsed his mouth with water, and the URA measured the blood alcohol concentration (BAC) again. At 18 min postdrinking, the GRA gave the CPT instructions again, and the participant performed the CPT for the second time (CPT2). Seven minutes into the CPT, physiological recordings were taken for 3 min (Postdrink 2). Following the completion of CPT2, BAC was assessed for a third time.
Stress phase
At 40 min postdrink, the stress phase of the experiment began. This period consisted of continuous recording of physiological measures and the stress bar during the following five periods (participants were alone in the room during this time): (a) A 3-min prestressor phase (prestress baseline) during which participants were instructed to relax and sit quietly. (b) A 1-min instructional phase during which the following set of instructions was presented via the computer:
Next you will see the number “180” appear on the screen and the numbers will begin to count down. As the numbers count down from “180” to “0,” compose a speech on the topic of “WHAT I LIKE AND DISLIKE ABOUT MY BODY AND PHYSICAL APPEARANCE.” When the number on the screen reaches “0,” look into the camera and begin your speech. Please continue talking until “Please stop speaking” appears on this screen. Try to be as open and honest as possible. Advanced psychology students will rate the videotape of your speech for traits such as openness and defensiveness. Remember to use the Stress Bar to indicate how nervous or stressed you are feeling throughout this period.
(c) A 3-min countdown phase (countdown) during which time participants were to prepare their speech for presentation. (d) A 3-min speech phase (speech) during which participants gave their speech while being videotaped. (e) A 9-min poststressor phase (poststress) during which participants were once again asked to sit quietly and relax.
Postexperimental procedures
Following the stress phase, a fourth BAC was taken, at 60 min postdrink. At 70 min postdrink, participants were instructed to perform the third CPT (CPT3). As previously, 7 min into the CPT, 3 min of physiological recordings were taken (postexperiment baseline). After completion of the CPT, a fifth BAC was taken (82 min postdrink). Following this final breath analysis, the GRA administered a postexperimental questionnaire to evaluate the participant’s assessment of the experimental procedures. The participants were then debriefed, electrodes were removed, and those in the alcohol group were sent to an adjacent “sober-up lounge.” When their BAC registered less than .02%, transportation home was provided by cab service (placebo participants were released or sent home via cab immediately after electrodes were removed).
Results
Analytic Strategy
Mean levels of HR (in bpm), SCL, and ANX during each phase of the experiment as a function of beverage group are presented in Figure 2. Given the task demands of the CPT, participants were unable to use the stress bar during measurement intervals when the CPT was administered. Therefore, to ensure comparability between analyses, only intervals for which data were available for all measures were examined. In addition, given our primary interest in assessing stress responses during the speech period as a function of beverage and multiple baseline periods, our main analyses included only those measurement intervals (i.e., predrink, postdrink, prestress, and speech).
Figure 2.

(opposite). Mean levels of heart rate, skin conductance, and self-reported anxiety throughout the experiment as a function of beverage condition. Each tick mark along the abscissa represents 30 s of recording time. Stress bar data were not available during CPT 2 or the postexperiment baseline because participants were engaging in the continuous performance task during these intervals. Also note that during the first 30 s of each recording period, the self-reported anxiety rating reflects both the initial computer-generated setting and subsequent adjustments. Pre-Dnk BL = pre-drink baseline period (3 min); Post-Dnk BL1 = post-drinking baseline period (3 min); CPT 2 = period of physiological recording during second continuous performance task (CPT) administration (3 min); Pre-Stress BL = pre-stressor baseline period (3 min); IN = speech instructions phase (1 min); CD = countdown to speech delivery (3 min); SPCH = speech delivery period (3 min); Post-Stress = postspeech period (9 min); Post-Exp BL = post-experiment baseline period (3 min).
We examined the relations in the data using a set of path models.4 This approach models the relationship between independent and dependent variables while controlling for and examining the effect of variability due to potential mediators and allows the modeling of multiple baselines simultaneously by estimating the effects of autoregressivity. We first constructed a series of base models testing the direct influence of beverage on variation in each of our three dependent variables during the postdrink, prestress, and speech phases (see Figure 3). Next, we tested for potential mediation using a path model in which the direct effect of beverage on stress response during the speech was examined in the presence of postconsumption CPT performance (d’), controlling for baseline levels of CPT performance (see Figure 4). Finally, to test individual differences in attention as a potential moderator of alcohol’s SRD effects, we modified the base models by adding a Beverage × D’ Cross-Product term.
Figure 3.

Structural equation models depicting the direct effect of alcohol on heart rate (upper panel), skin conductance (middle panel), and self-reported anxiety (lower panel), controlling for predrinking, postdrinking, and prestress baseline levels. Values above Predrink and above Beverage are variance estimates. All path coefficients, covariances, and residuals are standardized. bpm = beats per minute.
*p < .05.
Figure 4.

Mediational model for skin conductance level (SCL; see Table 2 for specific path coefficients for each dependent variable). CPT = continuous performance task; e = error. χ2(5, N = ) = 2.55, root-mean-square error of approximation = .00, comparative fit index = 1.00.
*p < .05.
Correlations Between Baseline CPT Performance and ADHD Symptoms and Expectancies
CPT performance was significantly correlated with retrospectively rated ADHD symptoms (r = -.28, p < .01), providing convergent validity for the potential clinical relevance of the CPT in this nonclinical sample. It is also noteworthy that CPT correlated significantly with tension reduction expectancies (r = .24, p < .05) but not with other expectancies.
Manipulation Checks
BAC levels
Mean BACs for the alcohol group were 0.070% (SD = .02) during the postdrink period, 0.082% (SD = .01) during the prestress period (after CPT2), 0.085% (SD = .02) during the poststress period, and 0.08% (SD = .01) at the final reading, confirming that peak BAC had been achieved by the time of the stress manipulation. BAC readings did not change from zero in the placebo group. A univariate analysis of variance (ANOVA) confirmed that the differences between the beverage groups during the four postdrink assessments were significant (all ps < .001).
Subjective intoxication effects
Participants’ postexperimental estimates of how many drinks they consumed during the study differed by group, t(100) = -7.20, p < .001, with the placebo group estimating fewer standard drinks (M = 2.55, SD = 1.48) than the alcohol group (M = 4.80, SD = 1.67). The fact that those in the placebo group believed, on average, that they had consumed 2-3 standard drinks suggests that our cover story (that all participants consumed some alcohol) was viable. Univariate tests also showed that participants’ estimates of how drunk they felt during each experimental phase were larger in the alcohol group than in the placebo group (all ps < .001). Analyses of postexperimental estimates of perceived stress during each of the experimental phases indicated that the alcohol group reported feeling less stress than the placebo group during the countdown and speech phases (ps < .01); no other differences were significant.
Sustained attention
D’ data from the CPT were subjected to a 2 (beverage) × 3 (time) mixed ANOVA, with the three CPT assessments (predrink, postdrink, and poststress) serving as a repeated factor. Beverage (p < .05) and time (p < .001) main effects were qualified by a significant Beverage × Time interaction, F(2, 202) = 6.95, p < .01, showing that d’ scores decreased over time (likely because of cognitive fatigue), but primarily in the alcohol group (see Table 1). Simple effect tests showed that whereas d’ did not change significantly across assessments for the placebo group, F(2, 104) = 2.08, p > .13, it decreased significantly across time for the alcohol group, F(2, 98) = 20.79, p < .0001. Additional simple effect tests confirmed that d’ values for the alcohol group were significantly lower than for the placebo group during CPT2, F(1, 101) = 11.04, p < .01, and approached significance during CPT3, F(1, 101) = 3.26, p = .07.
Table 1. Mean Values of d’ From the Continuous Performance Task (CPT) as a Function of Beverage Group and Assessment Time.
| Beverage group | Task |
|||||
|---|---|---|---|---|---|---|
| CPT1 |
CPT2 |
CPT3 |
||||
| M | SD | M | SD | M | SD | |
| Placebo | 3.49 | 0.86 | 3.42a | 0.95 | 3.29b | 0.93 |
| Alcohol | 3.38 | 0.90 | 2.80a | 0.93 | 2.93b | 1.09 |
Note. The CPT was administered at predrink baseline (CPT1) at 18 min following beverage consumption (CPT2) and following the poststress period (CPT3). Larger d’ values represent greater sustained attention during the task. Means having the same subscript in the CPT2 column differ at p < .01. Means having the same subscript in the CPT3 column differ at p = .01.
Path Models
Because of equipment malfunction, all data from the main dependent measures were lost for 3 participants, data from the instructions phase through the poststress phase were lost for 1 other participant, and data from the predrink baseline phase were lost for another participant. HR data also were lost for 2 other participants. Thus, models for SCL and ANX were carried out using a sample of 101 participants with complete data (48 in the alcohol group; 53 in the placebo group), and the model for HR was carried out on a sample of 99 participants with complete data (49 in the alcohol group; 50 in the placebo group). All path models presented here were estimated using the CALIS procedure in SAS.
Main effect models
Figure 3 presents the base models in which the direct effects of beverage on levels of HR, SCL, and ANX during the speech phase were modeled while controlling for beverage effects on predrink, postdrink, and prestress baseline periods (i.e., just identified, fully autoregressive models). We chose to model these postconsumption periods because each one represents a theoretically meaningful time point in the SRD process. Effects during the postdrink period represent the immediate influence of beverage consumption. The significant positive path from beverage to postdrink for the HR and SCL models indicates that alcohol increased both HR and SCL. Effects during the prestress baseline period represent a delayed, longer term influence of beverage consumption controlling for short-term beverage consumption effects, but prior to specific information about the stressor. The SCL model shows that alcohol reduced SCL during the prestress baseline. Finally, direct effects during the speech period represent the SRD effects of alcohol controlling for beverage effects on all prior phases. As indicated by the significant negative path from beverage to speech, the models for SCL (middle panel) and ANX (bottom panel) show that alcohol had a significant SRD effect, independent of its influence on the other modeled phases. However, the model for HR (top panel) indicates that alcohol did not have a significant direct effect on HR during the speech independent of its influence on postdrink and prestress levels. However, a Sobel test5 revealed significant mediation of the HR response during the speech via alcohol effects on baseline HR (z = 3.12, p < .01). It should also be noted that, in addition to the indirect effect of alcohol on HR response to the speech, there was also an indirect effect of alcohol on the SCL response to the speech (z = 2.03, p < .05) in addition to the direct effect noted earlier.
Tests of attention as a mediator
Data presented previously indicated that participants in the alcohol group experienced a greater decrease in d’ values (sustained attention) compared with those in the placebo group. These findings provide a basis for examining postconsumption d’ values as a potential mediator (see Baron & Kenny, 1986; MacKinnon, Warsi, & Dwyer, 1995) of alcohol’s SRD effects. To test this hypothesis, we constructed a set of models in which the effects of beverage on stress responses were examined in the presence of d’ while controlling for baseline levels of d’ as well as baseline, postdrink, and prestress levels of the dependent variables. This general model is shown in Figure 4 for SCL.
Path coefficients generated for each dependent variable are presented in Table 2. Of greatest theoretical importance in Table 2 are the values representing change in the direct effect of beverage on levels of the dependent variables when controlling for the mediator, relative to the direct effect shown in Figure 3. For each model, we tested whether this change was significant by calculating the indirect effect of beverage via the mediator using the Sobel test formulation. As indicated in Table 2, d’ proved to be a significant mediator of the SRD effect, but only for SCL. This effect is shown as the significant (negative) change in the coefficient associated with the effect of beverage on the stress response (beverage → speech change).
Table 2. Standardized Path Coefficients From Models Examining CPT Performance as a Mediator of Alcohol’s SRD Effects.
| Coefficient | Stress response |
||
|---|---|---|---|
| ANX | SCL | HR | |
| Model fit | |||
| χ2(5) | 5.56 | 2.55 | 8.61 |
| RMSEA | .03 | .00 | .08 |
| CFI | .996 | 1.00 | .992 |
| Path | |||
| Beverage→ Speech | -.28* | -.07* | -.02 |
| Beverage→ Speech change | .01 | -.02* | -.01 |
| Beverage→ CPT2 | -.26* | -.26* | -.26* |
| CPT2→ Speech | -.04 | .05* | .05 |
| Beverage → Postdrinking baseline | -.02 | .11* | .22* |
| Beverage → Predrinking baseline | .03 | -.08* | -.07 |
| CPT1 → CPT2 | .68* | .68* | .68* |
| CPT2 → Prestressor baseline | .09 | -.01 | -.08 |
| Predrinking baseline → Postdrinking baseline | .50* | .86* | .88* |
| Predrinking baseline → Prestressor baseline | .05 | .06 | .31* |
| Postdrinking baseline → Prestressor baseline | .58* | .90* | .59* |
| Postdrinking baseline → Speech | .18 | .12 | .09 |
| Predrinking baseline → Speech | -.14 | -.08* | -.13 |
| Prestressor baseline → Speech | .31* | .92* | .83* |
Note. Beverage→ Speech change (in boldface) represents the change in the direct effect of beverage on measures of stress taken during the speech period in the presence of the mediator (positive numbers indicate a larger effect, negative numbers indicate a smaller effect). The change value for SCL with d’ was associated with a significant z score (i.e., significant mediation according to the Sobel test). CPT = continuous performance task; SRD = stress response dampening; ANX = anxiety; SCL = skin conductance level; HR = heart rate; RMSEA = root-mean-square error of approximation; CFI = comparative fit index.
p < .05.
Tests of attention as a moderator
We next examined whether baseline differences in sustained attention would moderate (i.e., change the magnitude of) alcohol’s SRD effects by constructing an additional set of path models similar to those shown in Figure 3, but with the addition of an exogenous variable for d’ (the moderator), an additional exogenous variable for the Beverage × D’ Cross-Product term, and additional paths from these variables to the endogenous variables (as well as covariances among all exogenous variables).
Of greatest relevance for testing our hypotheses is whether the path from the cross-product term to the dependent variable measured during the speech was significant in each of the three models (HR, SCL, and ANX), while also controlling for main effects and autoregressivity. This cross-product path was significant in the model for SCL (β = -.05, p < .05) but not for HR (β = -.08, p > .10) or ANX (β = .08, p > .40). The significant interaction in the SCL model is graphically depicted in Figure 5. Inspection of the simple slopes shows that individuals with relatively high baseline d’ values showed a particularly pronounced SRD effect of alcohol on SCL, whereas those with relatively low baseline d’ values showed no significant SRD effect.
Figure 5.
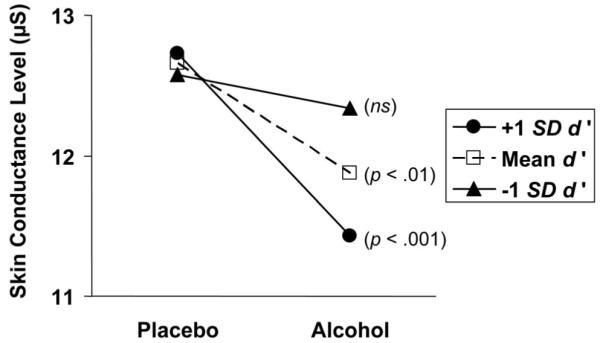
Effects of dose on skin conductance level during the speech period as a function of baseline d’ values. P values refer to whether each simple slope is significantly different from zero (see Aiken & West, 1991).
Discussion
The purpose of this experiment was to provide a thorough test of the hypothesized SRD effect of alcohol using multiple indicators of stress response (physiological and self-report), assessing and modeling the time course of alcohol effects on prestressor baselines, and examining sustained attention as a potential cognitive moderator and mediator of SRD effects. In conducting this study, we were particularly interested in multivariate modeling of alcohol’s SRD effects. Specifically, we tried to account for the effect of alcohol on basal (i.e., prestress) measures of self-report and autonomic responses in order to parse effects potentially attributable to tonic levels from those associated with reactivity. In this regard, modeling response variables as a fully endogenous, autoregressive process permitted a comprehensive representation of the time-dependent effects of our beverage manipulation on ongoing levels of our outcome variables.
The experiment produced a number of findings pertinent to our hypotheses. Foremost among these is that alcohol produced significant SRD across all stress-related dependent variables we examined. In this respect, the findings are quite consistent—perhaps uniquely so—with respect to demonstrating robust SRD effects across self-report and diverse physiological measures. As described by Sayette (1993b), simply consuming a beverage had marked effects on HR; alcohol produced an increase and placebo a decrease in HR during the first postdrink baseline period (see also Sher et al., 1994). However, by the time of the prestress baseline (24 min later), alcohol and placebo group HR means were virtually identical. A similar pattern of baseline means was observed for SCL. Although beverage had a direct SRD effect on SCL during the speech, examination of indirect effects in our structural equation models also showed that, like the HR measure, the beverage effect was partially mediated by postconsumption SCL. Thus, it appears critical to model both pre- and postdrinking baseline periods when testing the SRD hypothesis with either of these physiological measures in order to characterize the nature of the relation between the initial stimulus effects of alcohol, the passage of time, and reactivity to a stressor.
One explanation for these differences between alcohol effects on HR and SCL is that rather than directly indexing alcohol’s effect on the behavioral inhibition system, the initial alcohol-related HR acceleration (that determines the subsequent, dampened HR response) may be reflecting an effect of alcohol on central reward systems. For example, Conrod, Pihl, and their colleagues (Conrod, Peterson, & Pihl, 2001; Peterson et al., 1996) have demonstrated that initial HR acceleration to a challenge dose of alcohol is strongly related to activation of endogenous opiate systems. Consequently, the dampened HR response may be indexing not a direct anxiolytic response but an indirect effect mediated by (competing) positive reinforcement.
In addition to these effects on the main dependent variables, alcohol consumption also significantly decreased sustained attention. This finding is consistent with those of numerous other studies generally showing that alcohol impairs this form of attention (see Koelega, 1995), given sufficient dosing and task difficulty. The present results go beyond any previous reports by showing that decreased attention was correlated with the SRD effect of alcohol for SCL (but not HR or ANX); a finding consistent with the hypothesized mediation. At a general level, this finding is consistent with the basic tenets of the attention-allocation model (e.g., Steele & Josephs, 1990) and represents an important statistical test of the mediational hypothesis implied by the theory. Also, although we did not directly assess whether alcohol-induced impairment of attention limited assessment of the stressor (as posited by the appraisal-disruption model; Sayette, 1993a), it is reasonable to speculate that full appraisal of the stressor was unlikely, given that some details concerning the nature of the impending threat were withheld from participants until after intoxication. The significant positive association between the d’ mediator variable and SCL during the speech (β = .05, p < .05; see Table 2) also indicates that the stress response was larger when attentional resources were greater.
The fact that changes in sustained attention mediated the SRD effect on SCL but not the other dependent variables merits consideration. On the one hand, this finding is puzzling, in part because SCL has only inconsistently shown SRD effects in prior work (see Sher, 1987). However, methodological and design limitations in a number of those earlier studies, as reviewed previously, could explain some of this inconsistency. On the other hand, the importance of attention in the SRD process is underscored by other research in which SCL has been described as an indirect index of attention and information processing during challenging cognitive tasks (see, e.g., Dawson & Nuechterlein, 1984; Katkin, 1975; Tracy et al., 2000). That SCL was associated with attention-related processes in the present study is supported by a significant positive correlation between baseline d’ values and predrink SCL in the overall sample (r = .21, p < .05).
The finding that individuals with high baseline d’ scores showed a relatively large SRD effect on SCL, whereas those with low baseline d’ did not show a significant effect, also supports this contention and suggests that individuals with a greater ability to sustain attention may be particularly vulnerable to alcohol’s stress-reducing effects. Data from individuals with low baseline levels of sustained attention may simply reflect a floor effect, wherein alcohol does not significantly reduce attention beyond an already low baseline level. Although these data might seem to conflict with the idea that individuals with low executive function are at increased risk for development of alcohol use disorders because they experience stronger SRD effects (Giancola & Moss, 1998; Peterson et al., 1992; Sayette, 1993a), it is important to consider that attention is a particular cognitive ability that can be distinguished from other so-called higher cognitive processes at least in terms of the involvement of certain prefrontal cortical areas hypothetically affected by alcohol. Along these lines, Toichi et al. (2004) found that attention-specific tasks, including the CPT, elicited greater oxygen utilization in the dorsolateral prefrontal cortex than tasks associated with higher cognitive functions, suggesting that sustaining attention is more resource demanding in some respects. These data stress the need for specificity in determining what cognitive processes are impaired by alcohol and how individual differences in these processes interact with alcohol to determine SRD effects. Unfortunately, the present study was not designed to isolate specific cognitive processes that alone and in combination might be most closely coupled with stress reactivity.
Fowles (1988) has outlined the importance of cognitive factors in determining the extent to which environmental circumstances (e.g., acute stressors) produce anxiety:
Cognitive factors are relevant here, inasmuch as the appraisal of the significance of environmental stimuli is crucial to their effect. Cognitive distortions would, therefore, influence the impact of environmental cues, amplifying or attenuating their ability to activate the relevant motivational system. (p. 376)
Fowles also argued that the aversive motivational system is manifest in autonomic activity primarily through electrodermal responses. Our findings are entirely consistent with this hypothesis, in that alcohol-induced impairment of attention limited activation of the aversive system represented by SCL.
Depending on one’s perspective, it could be said that individuals with more attention-related cognitive resources have the best chance to benefit from “alcohol myopia.” This explanation gains some support from our unexpected finding that tension-reduction expectancies significantly correlated with baseline d’ values, obtained prior to any experimental manipulation. Whether these individuals developed stronger tension-reduction expectancies from direct experience with alcohol’s SRD effects, however, cannot be determined from these data.
Limitations and Future Directions
The methods used in the present study were limited in some important ways. For example, our measure of attention did not occur simultaneously with the experience of the stressor; other paradigms, particularly those in which attention is measured online via cortical responses to threat cues (e.g., Curtin et al., 2001), have a distinct advantage in this respect. Nevertheless, the structure of the present paradigm still permits the conclusion that attention was reduced following alcohol consumption, which was, in turn, related to stress response. However, both in the present design and even in designs using an “online” measure of attention, it is difficult to make strong inferences concerning mediation. Rather than a causal chain in which alcohol affects attention, which, in turn, affects stress response, it is possible that our data reflect alcohol affecting a common determinant of both sustained attention and (electrodermal) stress reactivity. A more definitive case for mediation would require more intensive experimentation (e.g., attempting to directly antagonize alcohol effects on attention independently of effects on brain areas thought to mediate anxiolysis). Thus, the findings reported here should not only be replicated independently but also extended to further evaluate the case for mediation. Further research also should address present design limitations such as including a null beverage control condition in which participants neither expect nor receive alcohol (see Footnote 3) as well as multiple doses to determine whether the findings reported here are “dose responsive.” We deliberately used a relatively large dose of alcohol that, on average, brought participants to blood alcohol levels associated with “bingeing” (NIAAA, 2004). The generalizability of the findings to populations other than young White men also needs to be established.
The fact that our attention measure was a significant mediator of SCL but not of HR or ANX warrants additional comment. Much extant support for the attention-allocation model has come from self-report measures of anxiety (see Steele & Josephs, 1990), and thus we expected reduced attention to at least partially account for alcohol’s SRD effects on ANX. However, the notion that self-report and physiological indices of stress and anxiety are only loosely coupled and have overlapping but distinct determinants has been recognized for decades (Lang, 1968), and thus it should not necessarily be surprising that statistical analyses consistent with a physiological measure of stress would not hold for a self-report measure. Beyond this general truism, additional theoretical and measurement considerations might be important. For example, as noted earlier, there may be two routes to reduced stress response, as indicated by differential patterns of response on SCL and HR. Theoretically, decreased self-reported anxiety could be reflecting both competing increased positive reward (as indexed by increased prestressor HR) and decreased activity of the behavioral inhibition systems (as indexed by decreased SCL response). If this is the case, then one would expect changes to CPT performance to be more strongly associated with changes in SCL than with changes in HR or ANX. Additionally, our self-report measure of anxiety has the virtue of being temporally sensitive to rapidly changing emotional experience, more so than temporally discrete, multi-item questionnaire measures. However, this high degree of temporal resolution undoubtedly comes at a psychometric cost. Consistent with basic principles of both classical test theory and generalizability theory, single-item assessments are likely to be less reliable than multi-item measures. Although the reliability of our assessment is clearly increased by aggregation over each recording interval, and our measure was sufficiently valid to both covary with our stressor manipulation and show beverage effects, it may have been insufficiently sensitive to show meaningful associations with intraindividual changes in better measured variables. Note that both our measures of attention and electrodermal activity are ratio scale variables that demonstrate high autoregressivity. This high autoregressivity reflects a combination of relatively high true score variability at baseline and/or highly similar intraindividual change in response to experimental conditions. In contrast, our self-report measure is at the ordinal level, and estimated autoregressivity is considerably lower, suggesting a combination of both relatively low true score variability at baseline and/or less consistent intraindividual changes in response to experimental conditions. The net result of these differences in measurement characteristics is that it simply may be more difficult to estimate covariation in intraindividual change between CPT and ANX than between CPT and SCL.
Conclusions
The present findings are unique in characterizing the effect of alcohol on SRD by simultaneously considering multiple measures of stress response and explicitly modeling the time course of intoxication using autoregressive path models. Clearly, prestressor levels of measures used to infer stress response vary systematically as a function of dosing and time, and these changes have important implications for inferences concerning alcohol’s effects on different measures of stress response. The fact that d’ was a significant mediator of SCL but not HR underscores the fact that HR and SCL index different underlying physiological processes and are not redundant measures of the stress response (e.g., Dawson, Schell, & Filion, 2000). One potentially important difference between these two measures is that whereas SCL is an unambiguous measure of activity in the sympathetic nervous system, increased HR can reflect either increased sympathetic activity, decreased parasympathetic activity, or both (see Brownley, Hurwitz, & Schneiderman, 2000; Dawson et al., 2000). Therefore, alcohol-related SRD on electrodermal outcomes can be attributed to a suppression of sympathetic activity. Whereas the beverage effect on HR was totally mediated by postconsumption levels, effects on SCL were not dependent on postconsumption increases in SCL. Thus, although earlier reviews suggested that alcohol’s SRD effects were more pronounced on HR than on SCL (e.g., Sayette, 1993a; Sher, 1987), in the present data, the effects on SCL were actually more straightforward than the effects on HR.
Thus, the present data suggest that SCL should continue to be used as an index of stress in future studies. Indeed, Dawson et al. (2000) have argued that in studies in which reactions to stressful situations have been examined—particularly those in which active avoidance coping is not possible, as was the case here—the electrodermal system is likely to be particularly responsive. From this perspective, it may be fallacious to attempt to build a unitary model of the effect of alcohol on stress and negative emotional states. That is, cognitive theories such as alcohol myopia and appraisal disruption may be accounting for uniquely different phenomena than neuropharmacological theories that posit direct actions of ethanol on brain centers underlying affective states (Sher & Grekin, 2007; Sher, Grekin, & Williams, 2005). Both approaches can be meaningful, indeed, perhaps required if a comprehensive understanding of the affective consequences of alcohol is to be achieved.
Acknowledgments
This research was supported by a Research Board grant from the University of Missouri and by National Institute on Alcohol Abuse and Alcoholism Grants P50 AA11998 and R01 AA7231.
Footnotes
We also examined a host of individual-difference variables as potential moderators of alcohol’s SRD effects. A summary of these analyses is available from Kenneth J. Sher upon request.
This study was not intended to provide a direct test of the appraisal-disruption model, even though our inclusion of multiple baseline periods is an important feature of such studies. Although we have previously shown that providing details about a speech topic can be stressful (Farha & Sher, 1989), participants in the present study were not made aware of the embarrassing nature of the topic of their speech until after beverage consumption. Consequently, and in line with the appraisal-disruption model, our findings must be contextualized with respect to the opportunity for preliminary but limited appraisal.
Limited resources for the present study required us to choose two beverage groups. To ensure compatibility with our own (e.g., Sher et al., 1994; Sher & Walitzer, 1986) and other prior work on SRD (Josephs & Steele, 1990; Sayette et al., 2001; Sayette & Wilson, 1991; Steele & Josephs, 1988), we opted to use an alcohol group and a placebo group. Recently, the value of using such two-group designs has been called into question (see Testa et al., 2006). Concerns fall primarily along two lines: (a) placebo participants might compensate for anticipated alcohol-induced impairment by increasing their effort and more strongly engaging cognitive control resources during laboratory tasks and (b) anticipated effects of alcohol (i.e., expectancies) often mediate observed effects in both active dose and placebo conditions. The present data are relevant to this debate and provide a response in defense of the use of placebo groups in alcohol research. With regard to the first issue, the tasks used in the present study are not likely to be susceptible to efforts at compensation. The measure of sustained attention used here (d’) is known to be largely unaffected by motivation to respond, a point emphasized by several scholars in the vigilance literature (e.g., See, Howe, Warm, & Dember, 1995; Warm, 1984). Thus, even if placebo participants were motivated to compensate for anticipated impairment by alcohol, their CPT performance, as expressed by the d’ estimate, would not necessarily be expected to reflect this motivational state. Moreover, had placebo participants attempted to compensate, and had this attempt been successful, we would expect d’ values to increase from predrink to postdrink administrations of the CPT; this was not observed (see Table 1). The findings reported in Table 1 also indicate that placebo participants were not devoting some of their attention to concerns over whether or how much alcohol they received. Thus, although findings consistent with a compensatory effect have been observed in some other studies using cognitive tasks (e.g., Fillmore, 2003; Fillmore & Blackburn, 2002; Testa et al., 2006), such concerns appear unwarranted in the present study. The second concern about the use of placebo manipulations relates to the possibility that individual differences in expectancies drive observed differences in behavior. Testa and colleagues (2006) concluded that “expectancies may represent an important cognitive factor that actually mediates the behavioral responses to alcohol” (p. 340). If this were the case here, then we should observe that participants in the placebo condition are just as likely to experience SRD as those in the alcohol condition, so long as they hold strong expectancies that alcohol reduces stress. To test for this possibility, we conducted a set of simple correlations between tension-reduction expectancies and our main dependent variables measured during the speech period. Among participants in the placebo group (n = 51), these correlations turned out to be positive (rs = .31, .28, and .30 for SCL, ANX, and HR, respectively, ps < .05), suggesting that higher levels of tension-reduction expectancies among placebo participants was associated with increased stress. From the standpoint of understanding placebo effects, this finding suggests that placebo participants did not simply conform to the effects that they anticipated would occur when drinking alcohol; otherwise, we would have expected negative correlations between tension-reduction expectancies and stress responses in this group. This finding could indicate that expecting to experience SRD from alcohol, and then not actually experiencing it, produces small to moderate increases in stress, perhaps because of an expectancy violation effect (see Olson, Roese, & Zanna, 1996). It is interesting to note that among participants in the alcohol group, higher tension-reduction expectancies were associated with decreases in stress during the speech period, as measured by the HR variable (r = -.29, p < .05). Taken together, these findings suggest that responses to beverage consumption are not solely driven by expectancy effects. Nevertheless, it is clear from other research that expectancies often do importantly determine the extent to which alcohol influences behavior, even when no beverage is consumed (see, e.g., Bartholow & Heinz, 2006; Friedman, McCarthy, Bartholow, & Hicks, 2007).
Consistent with the majority of studies in this literature, we also used a more traditional repeated measures ANOVA approach to examine the data. These analyses produced findings largely redundant with the structural equation modeling approach and thus are not presented here.
References
- Aiken LS, West SG. Multiple regression: Testing and interpreting interactions. Sage; Newbury Park, CA: 1991. [Google Scholar]
- American Psychiatric Association . Diagnostic and statistical manual of mental disorders. 4th ed. Author; Washington, DC: 1994. [Google Scholar]
- Ballard JC. Computerized assessment of sustained attention: A review of factors affecting vigilance performance. Journal of Clinical & Experimental Neuropsychology. 1996;18:843–863. doi: 10.1080/01688639608408307. [DOI] [PubMed] [Google Scholar]
- Baron RM, Kenny DA. The moderator-mediator variable distinction in social psychological research: Conceptual, strategic, and statistical considerations. Journal of Personality and Social Psychology. 1986;51:1173–1182. doi: 10.1037//0022-3514.51.6.1173. [DOI] [PubMed] [Google Scholar]
- Bartholow BD, Heinz A. Alcohol and aggression without consumption: Alcohol cues, aggressive thoughts, and hostile perception bias. Psychological Science. 2006;17:30–37. doi: 10.1111/j.1467-9280.2005.01661.x. [DOI] [PubMed] [Google Scholar]
- Bartholow BD, Pearson M, Sher KJ, Wieman LC, Fabiani M, Gratton G. Effects of alcohol consumption and alcohol susceptibility on cognition: A psychophysiological examination. Biological Psychology. 2003;64:167–190. doi: 10.1016/s0301-0511(03)00108-x. [DOI] [PubMed] [Google Scholar]
- Blume AW, Marlatt GA, Schmaling KB. Executive cognitive function and heavy drinking behavior among college students. Psychology of Addictive Behaviors. 2000;14:299–302. [PubMed] [Google Scholar]
- Brownley KA, Hurwitz BE, Schneiderman N. Cardiovascular psychophysiology. In: Cacioppo JT, Tassinary LG, Berntson GG, editors. Handbook of psychophysiology. 2nd ed. Cambridge University Press; Cambridge, England: 2000. pp. 224–264. [Google Scholar]
- Cappell H, Greeley J. Alcohol and tension reduction: An update on research and theory. In: Blane HT, Leonard KE, editors. Psychological theories of drinking and alcoholism. Guilford Press; New York: 1987. pp. 15–54. [Google Scholar]
- Cappell H, Herman CP. Alcohol and tension reduction: A review. Journal of Studies on Alcohol. 1972;33:33–64. [PubMed] [Google Scholar]
- Conger JJ. Alcoholism: Theory, problem, and challenge: II. Reinforcement theory and the dynamics of alcoholism. Quarterly Journal of Studies on Alcohol. 1956;13:296–305. [PubMed] [Google Scholar]
- Conners CK. Conners’ continuous performance tests (Version 3.0) [Computer program] Multi-Health Systems Inc; 1994. [Google Scholar]
- Conrod PJ, Peterson JB, Pihl RO. Reliability and validity of alcohol-induced heart rate increase as a measure of sensitivity to the stimulant properties of alcohol. Psychopharmacology. 2001;157:20–30. doi: 10.1007/s002130100741. [DOI] [PubMed] [Google Scholar]
- Cowan N, Elliott EM, Saults JS, Morey CC, Mattox S, Hismjatullina A, Conway ARA. On the capacity of attention: Its estimation and its role in working memory and cognitive aptitudes. Cognitive Psychology. 2005;51:42–100. doi: 10.1016/j.cogpsych.2004.12.001. [DOI] [PMC free article] [PubMed] [Google Scholar]
- Curtin JJ, Lang AR, Patrick CJ, Stritzke WGK. Alcohol and fear-potentiated startle: The role of competing cognitive demands in the stress-reducing effects of intoxication. Journal of Abnormal Psychology. 1998;107:547–565. doi: 10.1037//0021-843x.107.4.547. [DOI] [PubMed] [Google Scholar]
- Curtin JJ, Patrick CJ, Lang AR, Cacioppo JT, Birbaumer N. Alcohol affects emotion through cognition. Psychological Science. 2001;12:527–531. doi: 10.1111/1467-9280.00397. [DOI] [PubMed] [Google Scholar]
- Davidson D, Camara P, Swift R. Behavioral effects and pharmacokinetics of low-dose intravenous ethanol in humans. Alcoholism: Clinical and Experimental Research. 1997;21:1294–1299. [PubMed] [Google Scholar]
- Dawson M, Nuechterlein K. Psychophysiological dysfunctions in the developmental course of schizophrenic disorders. Schizophrenia Bulletin. 1984;10:207–232. doi: 10.1093/schbul/10.2.204. [DOI] [PubMed] [Google Scholar]
- Dawson ME, Schell AM, Filion DL. The electrodermal system. In: Cacioppo J, Tassinary L, editors. Principles of psychophysiology: Physical, social, and inferential elements. Cambridge University Press; New York: 1990. pp. 295–324. [Google Scholar]
- Dawson ME, Schell AM, Filion DL. The electrodermal system. In: Cacioppo JT, Tassinary LG, Berntson GG, editors. Handbook of psychophysiology. 2nd ed. Cambridge University Press; Cambridge, England: 2000. pp. 200–223. [Google Scholar]
- Deckel AW, Hesselbrock V. Behavioral and cognitive measurements predict scores on the MAST: A 3-year prospective study. Alcoholism: Clinical and Experimental Research. 1996;20:1173–1178. doi: 10.1111/j.1530-0277.1996.tb01107.x. [DOI] [PubMed] [Google Scholar]
- Dias EC, Foxe JJ, Javitt DC. Changing plans: A high density electrical mapping study of cortical control. Cerebral Cortex. 2003;13:701–715. doi: 10.1093/cercor/13.7.701. [DOI] [PubMed] [Google Scholar]
- Dollard J, Miller NE. Personality and psychotherapy: An analysis in terms of learning, thinking, and culture. McGraw-Hill; New York: 1950. [Google Scholar]
- Donohue KF, Curtin JJ, Patrick CJ, Lang AR. Intoxication level and emotional response. Emotion. 2007;7:103–112. doi: 10.1037/1528-3542.7.1.103. [DOI] [PubMed] [Google Scholar]
- Edelberg R. Electrical properties of the skin. In: Brown CC, editor. Methods in psychophysiology. Williams & Wilkins; Baltimore: 1967. pp. 1–53. [Google Scholar]
- Epstein JN, Erkanli A, Conners CK, Klaric J, Costello JE, Angold A. Relations between continuous performance test performance measures and ADHD behaviors. Journal of Abnormal Child Psychology. 2003;31:543–554. doi: 10.1023/a:1025405216339. [DOI] [PubMed] [Google Scholar]
- Ewing JA, McCarty D. Are the endorphins involved in mediating the mood effects of ethanol? Alcoholism: Clinical and Experimental Research. 1983;7:271–275. doi: 10.1111/j.1530-0277.1983.tb05458.x. [DOI] [PubMed] [Google Scholar]
- Farha JG, Sher KJ. The effects of consent procedures on the psychophysiological assessment of anxiety: A methodological inquiry. Psychophysiology. 1989;26:185–191. doi: 10.1111/j.1469-8986.1989.tb03153.x. [DOI] [PubMed] [Google Scholar]
- Fillmore MT. Drug abuse as a problem of impaired control: Current approaches and findings. Behavioral and Cognitive Neuroscience Reviews. 2003;2:179–197. doi: 10.1177/1534582303257007. [DOI] [PubMed] [Google Scholar]
- Fillmore MT, Blackburn J. Compensating for alcohol-induced impairment: Alcohol expectancies and behavioral disinhibition. Journal of Studies on Alcohol. 2002;63:237–246. doi: 10.15288/jsa.2002.63.237. [DOI] [PubMed] [Google Scholar]
- Fowles DC. Psychophysiology and psychopathology: A motivational approach. Psychophysiology. 1988;25:373–391. doi: 10.1111/j.1469-8986.1988.tb01873.x. [DOI] [PubMed] [Google Scholar]
- Fowles DC, Christie MC, Edelberg R, Grings WW, Lykken DT, Venables PH. Committee report: Publication recommendations for electrodermal measurements. Psychophysiology. 1981;19:404–407. [Google Scholar]
- Friedman RS, McCarthy DM, Bartholow BD, Hicks J. Interactive effects of alcohol outcome expectancies and alcohol cues on nonconsumptive behavior. Experimental and Clinical Psychopharmacology. 2007;15:102–114. doi: 10.1037/1064-1297.15.1.102. [DOI] [PubMed] [Google Scholar]
- Giancola PR, Moss HB. Executive cognitive functioning in alcohol use disorders. In: Galanter M, editor. Recent developments in alcoholism, Volume 14: The consequences of alcoholism. Plenum Press; New York: 1998. pp. 227–251. [DOI] [PubMed] [Google Scholar]
- Greeley J, Oei T. Alcohol and tension reduction. In: Leonard KE, Blane HT, editors. Psychological theories of drinking and alcoholism. 2nd ed. Guilford Press; New York: 1999. pp. 14–53. [Google Scholar]
- Greenberg LA, Carpenter JA. The effect of alcoholic beverages on skin conductance and emotional tension. I. Wine, whisky, and alcohol. Quarterly Journal of Studies on Alcohol. 1957;18:190–204. [PubMed] [Google Scholar]
- Halperin JM, Sharma V, Greenblatt E, Shwartz ST. Assessment of the continuous performance test: Reliability and validity in a nonreferred sample. Psychological Assessment. 1991;3:603–608. [Google Scholar]
- Josephs RA, Steele CM. The two faces of alcohol myopia: Attentional mediation of psychological stress. Journal of Abnormal Psychology. 1990;99:115–126. doi: 10.1037//0021-843x.99.2.115. [DOI] [PubMed] [Google Scholar]
- Katkin ES. Electrodermal lability: A psychophysiological analysis of individual differences in response to stress. In: Sarason IG, Spielberger CD, editors. Stress and anxiety. Vol. 2. Aldine; Washington, DC: 1975. pp. 141–176. [Google Scholar]
- Koelega HS. Alcohol and vigilance performance: A review. Psychopharmacology. 1995;118:233–249. doi: 10.1007/BF02245951. [DOI] [PubMed] [Google Scholar]
- Lang PJ. Fear reduction and fear behavior: Problems in treating a construct. In: Schlien JM, editor. Research in psychotherapy. Vol. 3. American Psychological Association; Washington, DC: 1968. pp. 90–102. [Google Scholar]
- Lepine R, Bernadin S, Barrouillet P. Attention switching and working memory spans. European Journal of Cognitive Psychology. 2005;17:329–345. [Google Scholar]
- Levenson RW, Sher KJ, Grossman LM, Newman J, Newlin DB. Alcohol and stress response dampening: Pharmacological effects, expectancy, and tension reduction. Journal of Abnormal Psychology. 1980;89:528–538. doi: 10.1037//0021-843x.89.4.528. [DOI] [PubMed] [Google Scholar]
- Lie N. Follow-ups of children with attention deficit hyperactivity disorder (ADHD): Review of literature. Acta Psychiatrica Scandinavica. 1992;85(368 Suppl):40. [PubMed] [Google Scholar]
- Linnoila M. Effect of drugs and alcohol on psychomotor skills related to driving. Annals of Clinical Research. 1974;6:7–18. [PubMed] [Google Scholar]
- Linnoila M, Erwin CW, Cleveland WP, Logue PE, Gentry WD. Effects of alcohol on psychomotor performance of men and women. Journal of Studies on Alcohol. 1978;39:745–758. doi: 10.15288/jsa.1978.39.745. [DOI] [PubMed] [Google Scholar]
- MacKinnon DP, Warsi G, Dwyer JH. A simulation study of mediated effect measures. Multivariate Behavioral Research. 1995;30:41–62. doi: 10.1207/s15327906mbr3001_3. [DOI] [PMC free article] [PubMed] [Google Scholar]
- Maltzman I, Marinkovic K. Alcohol, alcoholism, and the autonomic nervous system: A critical account. In: Begleiter H, Kissin B, editors. The pharmacology of alcohol and alcohol dependence. Oxford University Press; New York: 1996. pp. 248–308. [Google Scholar]
- Montague JD, Coles EM. Mechanism and measurement of the galvanic skin response. Psychological Bulletin. 1966;65:261–279. doi: 10.1037/h0023204. [DOI] [PubMed] [Google Scholar]
- Moskowitz H. Laboratory studies of the effects of alcohol on some variables related to driving. Journal of Safety Research. 1973;5:185–199. [Google Scholar]
- Moskowitz H, DePry D. Differential effect of alcohol on auditory vigilance and divided-attention tasks. Quarterly Journal of Studies on Alcohol. 1968;29:54–63. [Google Scholar]
- Munro LL, Dawson ME, Schell AM, Sakai LM. Electrodermal lability and rapid performance decrement in a degraded stimulus continuous performance task. Journal of Psychophysiology. 1987;1:249–257. [Google Scholar]
- Newlin DB. The antagonistic placebo response to alcohol cues. Alcoholism: Clinical and Experimental Research. 1985;9:411–461. doi: 10.1111/j.1530-0277.1985.tb05573.x. [DOI] [PubMed] [Google Scholar]
- National Institute on Alcohol Abuse and Alcoholism National Institute of Alcohol Abuse and Alcoholism Council approves definition of binge drinking. NIAA Newsletter. 2004 Winter;3 [Google Scholar]
- O’Daugherty M, Nuechterlein KH, Drew B. Hyperactive and hypoxic children: Signal detection, sustained attention, and behavior. Journal of Abnormal Psychology. 1984;93:178–191. doi: 10.1037//0021-843x.93.2.178. [DOI] [PubMed] [Google Scholar]
- Olson JM, Roese NJ, Zanna MP. Expectancies. In: Higgins ET, Kruglanski AW, editors. Social psychology: Handbook of basic principles. Guilford Press; New York: 1996. pp. 211–238. [Google Scholar]
- Peterson J, Finn P, Pihl RO. Cognitive dysfunction and the inherited predisposition to alcoholism. Journal of Studies on Alcohol. 1992;53:154–160. doi: 10.15288/jsa.1992.53.154. [DOI] [PubMed] [Google Scholar]
- Peterson JB, Gianoulakis C, Conrod PJ, Pihl RO, Stewart SH, Finn PR, et al. Ethanol-induced change in cardiac and endogenous opiate function and risk for alcoholism. Alcoholism: Clinical and Experimental Research. 1996;20:1542–1552. doi: 10.1111/j.1530-0277.1996.tb01697.x. [DOI] [PubMed] [Google Scholar]
- Pihl RO, Assaad JM, Hoaken PNS. The alcohol-aggression relationship and differential sensitivity to alcohol. Aggressive Behavior. 2003;29:302–315. [Google Scholar]
- Pihl RO, Peterson J. Drugs and aggression: Correlations, crime and human manipulative studies and some proposed mechanisms. Journal of Psychiatry and Neuroscience. 1995;20:141–149. [PMC free article] [PubMed] [Google Scholar]
- Pohorecky LA. Stress and alcohol interaction: An update of human research. Alcoholism: Clinical and Experimental Research. 1991;15:438–459. doi: 10.1111/j.1530-0277.1991.tb00543.x. [DOI] [PubMed] [Google Scholar]
- Rohrbaugh JW, Stapleton JM, Parasuraman R, Frowein HW, Adinoff B, Varner JL, et al. Alcohol intoxication reduces visual sustained attention. Psychopharmacology. 1988;96:442–446. doi: 10.1007/BF02180021. [DOI] [PubMed] [Google Scholar]
- Rosvold H, Mirsky AF, Sarason I, Bransome ED, Jr., Beck LH. A continuous performance test of brain damage. Journal of Consulting Psychology. 1956;20:343–350. doi: 10.1037/h0043220. [DOI] [PubMed] [Google Scholar]
- Saults JS, Cowan N, Sher KJ, Moreno MV. Does alcohol myopia shrink the scope of attention? 2006. Manuscript in preparation. [Google Scholar]
- Sayette MA. An appraisal-disruption model of alcohol’s effects on stress responses in social drinkers. Psychological Bulletin. 1993a;114:459–476. doi: 10.1037/0033-2909.114.3.459. [DOI] [PubMed] [Google Scholar]
- Sayette MA. Heart rate as an index of stress response in alcohol administration research: A critical review. Alcoholism: Clinical and Experimental Research. 1993b;17:802–809. doi: 10.1111/j.1530-0277.1993.tb00845.x. [DOI] [PubMed] [Google Scholar]
- Sayette MA. Does drinking reduce stress? Alcohol Research and Health. 1999;23:250–255. [PMC free article] [PubMed] [Google Scholar]
- Sayette MA, Martin CS, Perrott MA, Wertz JM, Hufford MR. A test of the appraisal-disruption model of alcohol and stress. Journal of Studies on Alcohol. 2001;62:247–256. doi: 10.15288/jsa.2001.62.247. [DOI] [PubMed] [Google Scholar]
- Sayette MA, Smith DW, Breiner MJ, Wilson GT. The effects of alcohol on emotional response to a social stressor. Journal of Studies on Alcohol. 1992;53:541–545. doi: 10.15288/jsa.1992.53.541. [DOI] [PubMed] [Google Scholar]
- Sayette MA, Wilson GT. Intoxication and exposure to stress: The effects of temporal patterning. Journal of Abnormal Psychology. 1991;100:56–62. doi: 10.1037//0021-843x.100.1.56. [DOI] [PubMed] [Google Scholar]
- See JE, Howe SR, Warm JS, Dember WN. Meta-analysis of the sensitivity decrement in vigilance. Psychological Bulletin. 1995;117:230–249. [Google Scholar]
- Sher KJ. Stress response dampening. In: Blane HT, Leonard KE, editors. Psychological theories of drinking and alcoholism. Guilford Press; New York: 1987. pp. 227–271. [Google Scholar]
- Sher KJ. Children of alcoholics: A critical appraisal of theory and research. University of Chicago Press; Chicago: 1991. The John D. and Catherine T. MacArthur Foundation series on mental health and development. [Google Scholar]
- Sher KJ, Bylund DB, Walitzer KS, Hartmann J, Ray-Prenger C. Platelet monoamine oxidase (MAO) activity: Personality, substance use, and the stress-response-dampening effect of alcohol. Experimental and Clinical Psychopharmacology. 1994;2:53–81. [Google Scholar]
- Sher KJ, Grekin ER. Alcohol and affect regulation. In: Gross J, editor. Handbook of emotion regulation. Guilford Press; New York: 2007. pp. 560–580. [Google Scholar]
- Sher KJ, Grekin E, Williams N. The development of alcohol problems. Annual Review of Clinical Psychology. 2005;1:493–523. doi: 10.1146/annurev.clinpsy.1.102803.144107. [DOI] [PubMed] [Google Scholar]
- Sher KJ, Levenson RW. Risk for alcoholism and individual differences in the stress response dampening effect of alcohol. Journal of Abnormal Psychology. 1982;91:350–367. doi: 10.1037//0021-843x.91.5.350. [DOI] [PubMed] [Google Scholar]
- Sher KJ, Walitzer KS. Individual differences in the stress-response-dampening effect of alcohol: A dose-response study. Journal of Abnormal Psychology. 1986;95:159–167. doi: 10.1037//0021-843x.95.2.159. [DOI] [PubMed] [Google Scholar]
- Sher KJ, Walitzer KS, Wood PK, Brent EE. Characteristics of children of alcoholics: Putative risk factors, substance use and abuse, and psychopathology. Journal of Abnormal Psychology. 1991;100:427–448. doi: 10.1037//0021-843x.100.4.427. [DOI] [PubMed] [Google Scholar]
- Sher KJ, Wood MD, Wood PK, Raskin G. Alcohol outcome expectancies and alcohol use: A latent variable cross-lagged panel study. Journal of Abnormal Psychology. 1996;105:561–574. doi: 10.1037/0021-843X.105.4.561. [DOI] [PubMed] [Google Scholar]
- Sobel ME. Asymptotic intervals for indirect effects in structural equations models. In: Leinhart S, editor. Sociological methodology. Jossey-Bass; San Francisco: 1982. pp. 290–312. [Google Scholar]
- Steele CM, Josephs RA. Drinking your troubles away II: An attention-allocation model of alcohol’s effect on psychological stress. Journal of Abnormal Psychology. 1988;97:196–205. doi: 10.1037//0021-843x.97.2.196. [DOI] [PubMed] [Google Scholar]
- Steele CM, Josephs RA. Alcohol myopia: Its prized and dangerous effects. American Psychologist. 1990;45:921–933. doi: 10.1037//0003-066x.45.8.921. [DOI] [PubMed] [Google Scholar]
- Testa M, Fillmore MT, Norris J, Abbey A, Curtin JJ, Leonard KE, et al. Understanding alcohol expectancy effects: Revisiting the placebo condition. Alcoholism: Clinical and Experimental Research. 2006;30:339–348. doi: 10.1111/j.1530-0277.2006.00039.x. [DOI] [PMC free article] [PubMed] [Google Scholar]
- Toichi M, Findling RL, Kubota Y, Calabrese JR, Wiznitzer M, McNamara NK, Yamamoto K. Hemodynamic differences in the activation of the prefrontal cortex: Attention vs. higher cognitive processing. Neuropsychologia. 2004;42:698–706. doi: 10.1016/j.neuropsychologia.2003.08.012. [DOI] [PubMed] [Google Scholar]
- Tracy JI, Mohamed F, Faro S, Tiver R, Pinus A, Bloomer C, et al. The effect of autonomic arousal on attentional focus. NeuroReport. 2000;11:4037–4042. doi: 10.1097/00001756-200012180-00027. [DOI] [PubMed] [Google Scholar]
- Warm JS. An introduction to vigilance. In: Warm JS, editor. Sustained attention in human performance. Wiley; Chichester, England: 1984. pp. 1–14. [Google Scholar]
- Wilens TE, Biederman J. Alcohol, drugs, and attention-deficit/hyperactivity disorder: A model for the study of addictions in youth. Journal of Psychopharmacology. 2006;20:580–588. doi: 10.1177/0269881105058776. [DOI] [PubMed] [Google Scholar]
- Wilcott RC, Hammond LJ. On the constant-current error in skin resistance measurement. Psychophysiology. 1965;2:39–41. doi: 10.1111/j.1469-8986.1965.tb02632.x. [DOI] [PubMed] [Google Scholar]
- Wilson GT. Alcohol and anxiety: Recent evidence on the tension reduction theory of alcohol use and abuse. In: Blankenstein KR, Polivy J, editors. Self-control and self-modification of emotional behavior. Plenum Press; New York: 1982. pp. 117–141. [Google Scholar]