Introduction
Glaucoma may be the second leading cause of blindness in the world, affecting about 60 million people globally.1,2 The true prevalence may be underestimated as up to half of patients with glaucoma are undiagnosed, and a large proportion of glaucoma patients who are eligible for registration as legally blind remain unregistered.3–7
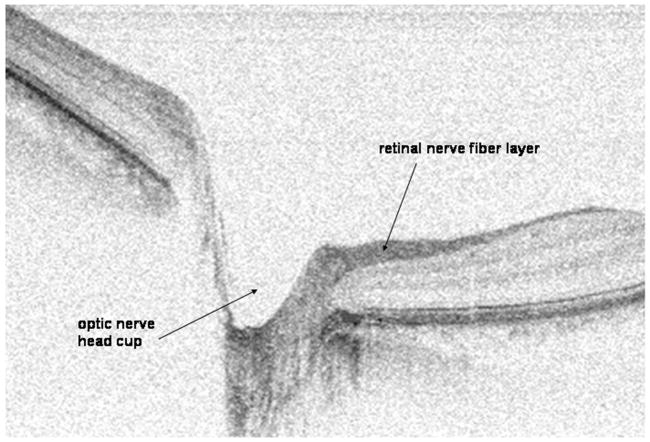
Glaucoma is a characteristic optic neuropathy characterized by retinal ganglion cell death, which then leads to retinal nerve fiber layer (RNFL) thinning and optic nerve head (ONH) cupping. The most important risk factor is elevated intraocular pressure. Since these structural changes in the RNFL and ONH may result in irreversible visual field (VF) loss,8,9 the early diagnosis of glaucoma is vital for the early initiation of treatment that may stop or slow down further permanent vision loss. One reason why early diagnosis often does not occur is that patients are usually asymptomatic early in their disease. Another problem preventing early diagnosis is that the standard clinical methods for diagnosing glaucoma (ie, VF testing) can only diagnose glaucomatous vision loss after up to 40% of the nerve tissue is lost irreversibly.10–13 VF testing is also not an ideal method to diagnose glaucoma because these tests rely on not only the subjective test response of the patient but also the subjective interpretation of the physician.
Because of the need to diagnose glaucoma not only earlier but also in a more objective manner, various imaging technologies have been developed over the past decade in an attempt to quantitatively analyze progressive glaucomatous structural changes, such as RNFL thinning and/or ONH cupping, both of which are known to precede clinically detectable VF defects. So far, there are 3 main commercially available imaging technologies that are used to image glaucomatous structural changes: confocal scanning laser ophthalmoscopy (CSLO) (Heidelberg Retina Tomograph—HRTII and III, Heidelberg Engineering, Germany), scanning laser polarimetry (SLP) (GDxVCC, Carl Zeiss Meditec Inc, Dublin, CA), and optical coherence tomography (OCT). We feel that spectral domain optical coherence tomography (SDOCT), also called Fourier domain OCT, has the greatest potential for imaging glaucomatous structural changes.
Before describing SDOCT in more detail, we will describe the science as to why CSLO, SLP, and traditional time domain optical coherence tomography (TDOCT) have not been proven to be better than a complete eye examination (which includes VF testing and stereo disc photography).14,15
CSLO (HRT)
CSLO uses a 670-nm wavelength diode laser source to create a 3-dimensional image of the surface topography of the ONH (Fig. 1). The CSLO method provides sectioning capability by use of a short confocal parameter. Owing to the low numerical aperture of the human eye, the depth sectioning capability is approximately 200 to 300 μm. This limits this modality to depicting only ONH and retinal surface topography, and RNFL thickness can not be directly measured. The accuracy of the height measurement at each point is approximately 20 μm. HRTII parameters (ie, cup volume, linear cup-disc ratio, rim area, etc.) and associated summary indices are also not objectively determined because parameters are dependent on the correct placement of the contour line (optic disc margin) by the operator. With HRTIII, there is an operator-independent assessment of the optic disc border, but evidence-based data on this function are still minimal at present.
Figure 1.
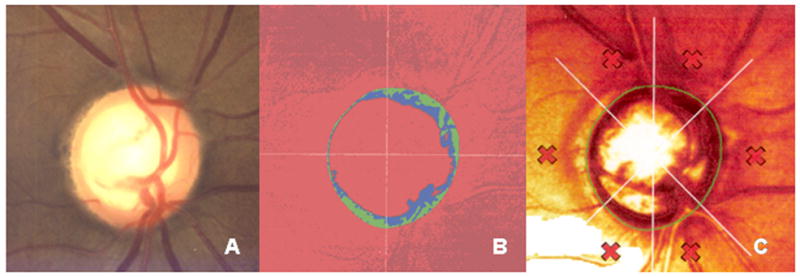
Optic nerve photograph (A) and confocal scanning laser ophthalmoscopy (Heidelberg Retina Tomograph, HRTII, Heidelberg Engineering, Germany) images (B and C) of the right eye of a 52-year-old white man with physiologic cupping.
SLP (GDxFCC and GDxVCC—Fixed and Variable Corneal Compensator)
Although SLP technology can not directly measure RNFL thickness, it allows for an indirect calculation of the RNFL thickness measurement.
SLP imaging is possible if a structure is birefringent, and birefringent structures in the eye include the cornea and the RNFL. The RNFL exhibits birefringence owing to the orderly arrangement of axons and microtubules within the RNFL. When the GDx sends a 780-nm polarized laser beam through the RNFL, phase retardation of the polarized light occurs. A simplified formula [phase retardation = birefringence × RNFL thickness × (2π/wavelength)] shows that the amount of phase retardation is proportional to RNFL thickness. The GDx then calculates RNFL thickness by taking the phase retardation, the actual value that is measured by the GDx machine, and dividing it by a constant birefringence value. Both the GDxFCC and GDxVCC (formerly of Laser Diagnostic Technologies Inc, San Diego, CA) and the GDxVCC (now of Carl Zeiss Meditec Inc, Dublin, CA) assume a constant RNFL birefringence value for all patients and for all areas of the retina. Studies have since shown that RNFL birefringence values in normal subjects not only are different for different people but also may vary in different areas of the retina, and RNFL birefringence values change with glaucomatous damage.16–18 As direct in vivo measurements of RNFL birefringence values vary 3-fold in normal patients, RNFL thickness values may be incorrectly calculated by the GDxFCC and VCC machines by over 30%.16
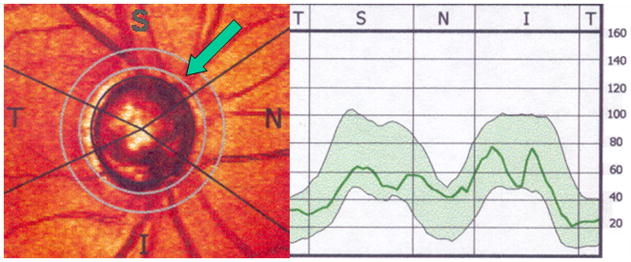
In the GDx machine, the RNFL thickness values are calculated along a 3.2-mm diameter 8-pixel wide circular scan that is centered on the disc and that is known as the “calculation circle” (Fig. 2). The temporal-superior-nasal-inferior-temporal graph is a plot of the RNFL thickness around the optic nerve along the calculation circle. In most normal individuals, the temporal-superior-nasal-inferior-temporal (TSNIT) graph has a “double hump” shape with the superior and inferior peripapillary RNFL having the thickest values compared with the normally thinner nasal and temporal RNFL.
Figure 2.
Retinal nerve fiber layer (RNFL) thickness determined by scanning laser polarimetry (GDxVCC). The RNFL thickness within the “calculation circle” (green arrow) is displayed graphically on the right.
TDOCT (Stratus OCT3)
OCT is analogous to ultrasound imaging, except that it uses light instead of sound to acquire high-resolution images of ocular structures.19 Similar to ultrasound, an image is created owing to differences in the reflectivity or backscattering of different ocular structures. Instead of an ultrasound A-scan representing a 1-dimensional line of data, the term A-line is used to describe a 1-dimensional line of OCT data. As multiple A-scans are combined to create a 2-dimensional ultrasound picture, multiple A-lines are combined to create a 2-dimensional OCT image.
Unlike CSLO and SLP, OCT can directly image both the ONH and the RNFL. Unlike ultrasound imaging where sound travels more slowly, light travels so fast that a fundamentally different way to process information from the eye is needed in OCT. For the leading commercially available TDOCT machine, Stratus OCT Model 3000 (Carl Zeiss Meditec Inc, Dublin, CA), the laser in the “source arm” is a 820-nm low-coherence near-infrared superluminescent laser diode (SLD) light source (Fig. 3). The light from the SLD light source passes through a fiber coupler that splits light to the “reference arm” and the “sample arm” (ie, the eye). The interference from light coming back from the reference arm and the eye is then received by a photodetector in the “detector arm.” By translating the reference arm mirror and spinning the scanning galvanometer mirror, a 2-dimensional image of the scanned optic nerve or retina is created. The axial resolution of the Stratus OCT is approximately 10 μm.
Figure 3.
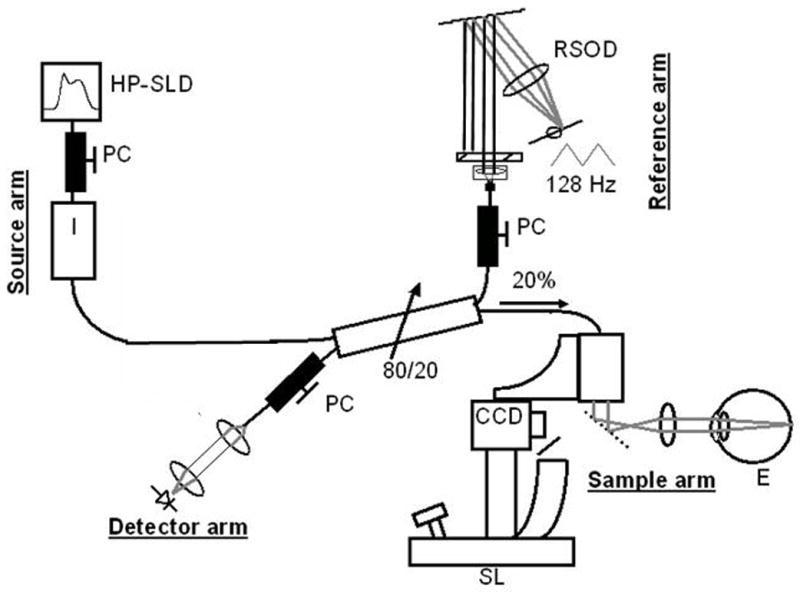
Time domain optical coherence tomography (TDOCT) set-up. CCD indicates charge-coupled device camera; E, eye; HP-SLD, high-power superlumninescent diode;PC, polarization controller; RSOD, rapid scanning optical delay line; SL, slit lamp.
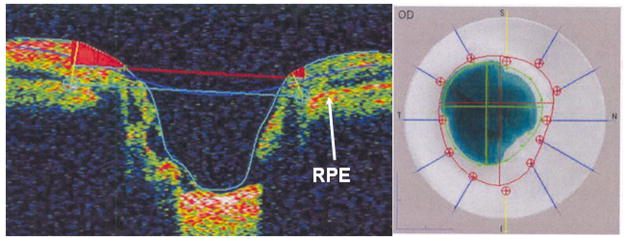
For ONH imaging, the Stratus OCT scans along 6 radial 4-mm line scans centered on the ONH (Fig. 4). Interpolation is used to fill in the missing data about the ONH topography between the 6 radial line scans. As the Stratus OCT takes over 1 full second to scan a 2-dimensional image of the ONH, the scan area is limited and microsaccades and motion artifacts are introduced. As the latter necessitates realignment of the A-lines, true ONH topography with TDOCT is not possible.
Figure 4.
Time domain optical coherence tomography (Stratus OCT3, Carl Zeiss Meditec Inc, Dublin, CA) imaging of the right optic nerve of a 52-year-old white man with physiologic cupping. Left image, This is the vertical cross-section through the optic nerve head. The reference plane (upper horizontal line) 150 μm above the retinal pigment epithelium (RPE) divides the neuroretinal rim above from the cup below. Right image, The cup is delimited by the inner circle and the disc border by the outer dotted circle.
RNFL measurements are acquired along a 3.46-mm diameter circular scan around the ONH and are presented graphically as a “double hump” in the normal eye (Fig. 5). However, the Stratus OCT does not measure the RNFL thickness either inside or outside this circular scan.
Figure 5.
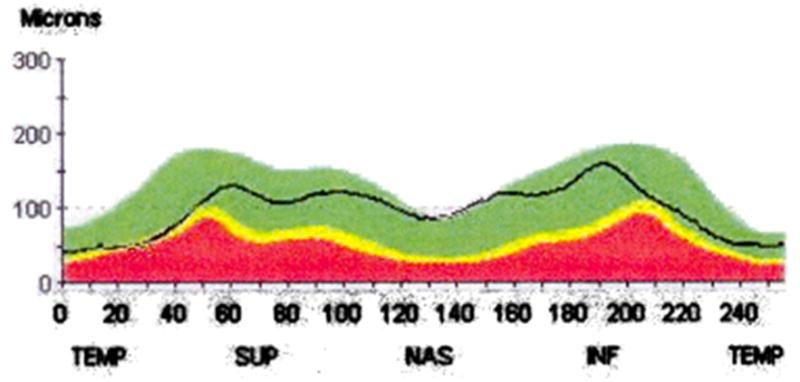
Time domain optical coherence tomography (Stratus OCT3, Carl Zeiss Meditec Inc, Dublin, CA) retinal nerve fiber layer (RNFL) thickness graph of the right optic nerve of a 52-year-old white man with physiologic cupping. RNFL thickness values are obtained from a 3.46 circular scan centered around the optic nerve head. Temporal (TEMP), superior (SUP), nasal (NAS), and inferior (INF) represent the area of RNFL relative to the optic nerve head.
Most importantly, OCT provides clinically relevant images that correlate well with histology and has thus been proven to be an important technology in the evaluation of glaucoma and retinal diseases.20–22 Despite the advantages of OCT technology, the main limitations of the commercially available TDOCT machine are its low resolution (ie, 10 μm) and slow acquisition speed (ie, average 1.28 s for a 2-dimensional image composed of 512 A-lines).
To achieve ultrahigh resolution (UHR) TDOCT imaging, which enables better axial resolutions of <3 μm, a titanium:sapphire laser source has been used in prototype machines, which are not commercially available. However, there are 2 disadvantages of the UHR TDOCT imaging system: (1) the titanium:sapphire laser costs almost 10 times the cost of the Stratus OCT3’s SLD light source and (2) the higher resolutions are achieved at the expense of slower acquisition speeds, which is a consequence of the inverse relation between resolution and acquisition speed.23–25
Despite the advancements in CSLO, SLP, and TDOCT technology, none of these methods have proven to be better than a complete eye examination with stereo disc photography and VF testing.14,15 Clinical studies have suggested that the sensitivities and specificities range from 74% to 94% and 65% to 91%, respectively, for detecting glaucoma using these 3 technologies.14,26–31 Certain abnormal parameters for all of these 3 technologies in glaucoma suspects have been shown to be associated with the future development of primary open angle glaucoma.32–34
On the basis of the science of SDOCT and the images and video movies that can be obtained with SDOCT, we feel that SDOCT has the most promise for the early diagnosis of preperimetric glaucoma and for the objective quantitative monitoring of glaucomatous disease progression.
SDOCT, Also Called Fourier Domain OCT
Until the end of the year 2006, all Food and Drug Administration (FDA)-approved commercially available OCT machines were based on TDOCT technology, including the Stratus OCT3.35 So far, SDOCT (also called Fourier domain OCT) is the only technology that affords unprecedented simultaneous UHR with ultrahigh acquisition speeds.36 This technology is possible, because it uses a spectrometer that is a fundamentally more efficient way to process information coming back from the reference arm and the eye (Fig. 6).
Figure 6.
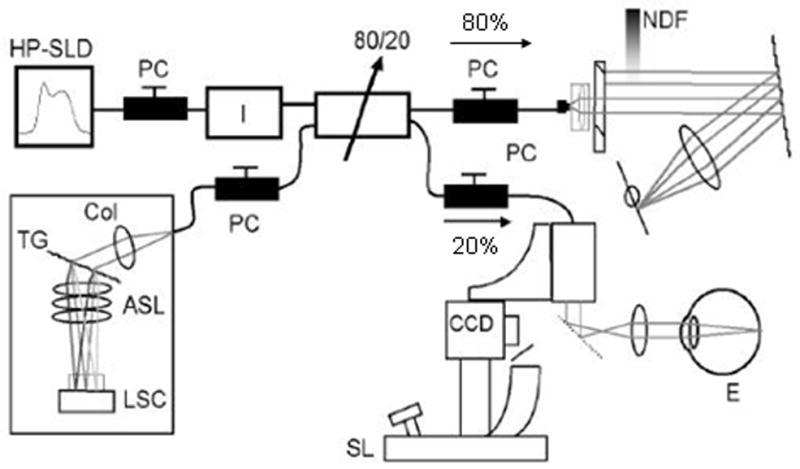
Spectral domain optical coherence tomography (SDOCT) set-up. ASL indicates air-spaced focusing lens; CCD, charge-coupled device camera; Col, collimator; E, eye; HP-SLD, high-power superluminescent diode; LSC, linescan camera; NDF, neutral density filter; PC, polarization controller; SL, slit lamp; TG, transmission grating.
The first prototype video-rate SDOCT system was built by Johannes de Boer, PhD, at the Massachusetts General Hospital.36–42 Although the light source is the same as in TDOCT (ie, either an SLD light source or a titanium:sapphire laser source), the main difference between TDOCT and SDOCT is the way the information is processed as light comes back from the reference arm and the eye (Fig. 6). In contrast to TDOCT, which uses a point detector or photodetector in the detector arm (Fig. 3), SDOCT uses a spectrometer (Fig. 6) that is composed of the transmission grating and the air-spaced focusing lens. In SDOCT, depth information is acquired by analyzing the interference patterns in a spectrum of mixed reflected lights.25,35,43,44 This information from the spectrometer then undergoes Fourier transformation to create an image; therefore, this technology has also been referred to as Fourier domain OCT.25,36
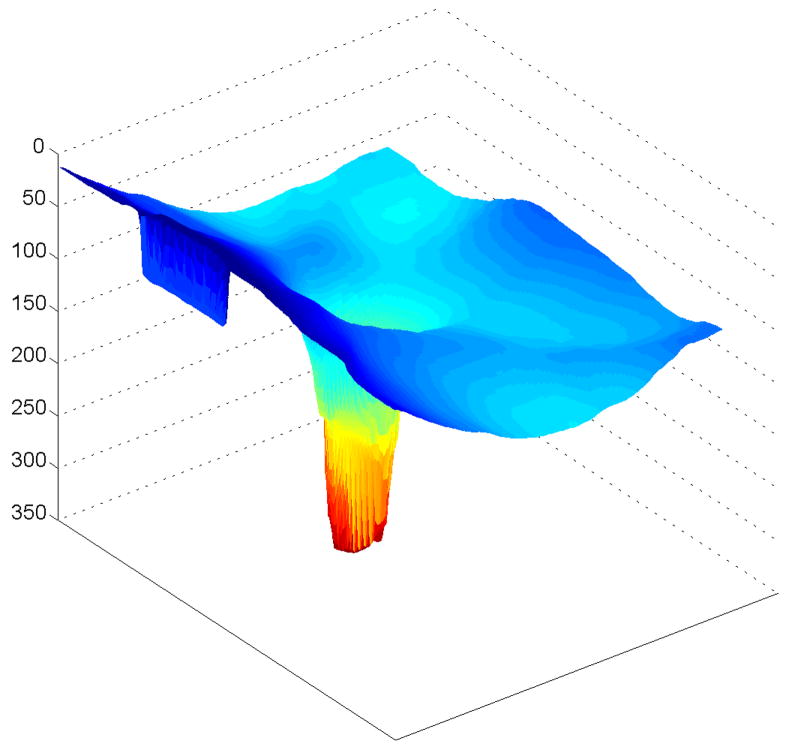
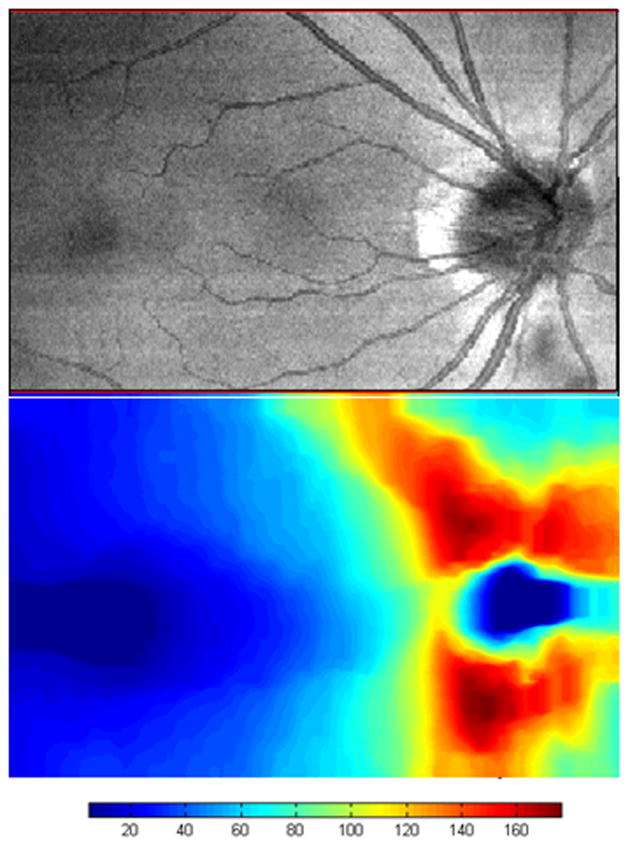
Because of the greater efficiency of the spectrometer, ultrahigh speed data acquisition of weaker signals is possible. SDOCT’s higher acquisition speeds allow for the transition from 2-dimensional to 3-dimensional and video ophthalmic imaging (Fig. 7). With SDOCT, A-lines can be acquired at a rate of 29,000/s (at 6-μm axial resolution), which is 73 times faster than the Stratus OCT3. At a 14,500 Alines/s rate, a 3.5-μm axial resolution can be achieved, which is 3 times better than Stratus OCT3.36,41 Since SDOCT can acquire 29 frames/s (1000 A-lines per frame), a 2-dimensional image can be obtained in 1/29 of a second. Because faster acquisition speeds allow for scanning of larger areas of the retina, SDOCT can create RNFL thickness maps of large regions of the posterior pole (Fig. 8).
Figure 7.
Spectral domain optical coherence tomography (SDOCT) 3-dimensional image of the normal left eye of a 38-year-old Korean woman. The image is elongated 4 times. The image was scanned with a prototype SDOCT system with a superluminescent diode laser (SLD, Superlum, Moscow, Russia) with a full width at half-maximum spectral width of 50 nm centered at 840 nm and with a resolution of 6 μm.
Figure 8.
Spectral domain optical coherence tomography (SDOCT) integrated reflectance image (top) and retinal nerve fiber layer thickness map (bottom) of the normal right eye of a 43-year-old white man. The image was scanned with a prototype SDOCT system with a titanium:sapphire laser (Femtolaser, Austria) with a central wavelength of 800 nm and a full width at half-maximum spectral bandwidth of about 140 nm with a 2.8-μm axial resolution. The scale is in microns. The foveal area is on the left, and the normal bowtie retinal nerve fiber layer thickness pattern is shown around the optic nerve head on the right. The area scanned is 8.85×5.73 mm.
Unlike TDOCT, which achieves UHR images by increasing acquisition times, SDOCT can achieve UHR imaging near 2-μm axial resolution without a significant increase in acquisition times and with a titanium:sapphire laser source (Figs. 9, 10).42,45 The FDA-approved commercially available SDOCT machines to date only give us axial resolutions of about 5 to 7 μm (compared with Stratus TDOCT at 10 μm), because these machines use the cheaper, easier-to-maintain SLD light source.
Figure 9.
Spectral domain optical coherence tomography (SDOCT) image of the normal right optic nerve of a 43-year-old white man. The image was scanned with a prototype SDOCT system with a titanium:sapphire laser (Femtolaser, Austria) with a central wavelength of 800 nm and a full width at half-maximum spectral bandwidth of about 140 nm with a 2.8-μm axial resolution. The image is elongated 2 times.
Figure 10.
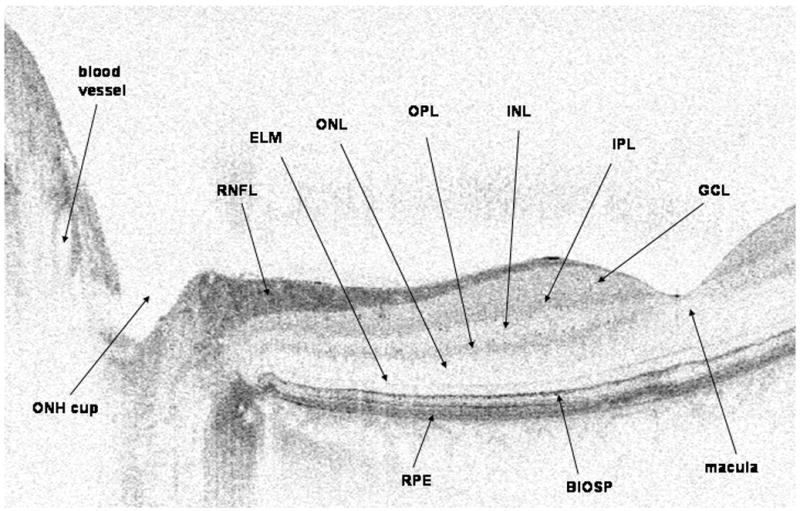
Spectral domain optical coherence tomography (SDOCT) image of the normal right optic nerve and fovea of a 43-year-old white man. The image was scanned with a prototype SDOCT system with a titanium:sapphire laser (Femtolaser, Austria) with a central wavelength of 800 nm and a full width at half-maximum spectral bandwidth of about 140 nm with a 2.8-μm axial resolution. The image is elongated 2 times. BIOSP indicates boundary between the inner and outer segments of the photoreceptors; ELM, external limiting membrane; GCL, ganglion cell layer; INL, inner nuclear layer; IPL, inner plexiform layer; ONH, optic nerve head; ONL, outer nuclear layer; OPL, outer plexiform layer; RNFL, retinal nerve fiber layer; RPE, retinal pigment epithelium.
The image quality, expressed as the SNR (signal-to-noise ratio), of the SDOCT system is better than that of TDOCT.37,38 For example, in the experimental prototype SDOCT system that was at the Massachusetts Eye and Ear Infirmary, the SLD light source was centered at 840 nm with a bandwidth range of 50 nm. The axial resolution in a TDOCT system would increase with optical bandwidth, but its SNR is inversely proportional to an increase in optical bandwidth.41,42 As the light source bandwidth does not affect the SNR performance of an SDOCT configuration, any source can be used in SDOCT without compromising image quality. Unlike titanium:sapphire laser sources, ultrabroad bandwidth superluminescent diode light sources have been developed that are compact, relatively inexpensive, and require low maintenance. The combination of new light sources and SDOCT technology has greatly improved ophthalmic imaging. In addition, the SNR can be reduced further with pulsed illumination instead of continuous wave illumination.46–48 In analogy to stroboscopic illumination, sample motion can be frozen by using a pulsed light source.47 This pulsed illumination subsequently reduces the detrimental effects of sample motion during scanning, thereby providing a 4.4 relative SNR advantage compared with that of continuous wave illumination.48 As a result, less artifacts and clearer images can be acquired. SDOCT has, therefore, evolved into a preferred technology for UHR ophthalmic imaging.
By the end of the year 2006, many imaging companies began to market SDOCT machines in the United States, and some of these machines and companies include the following: RTVue (Optovue, Fremont, CA), Spectralis (Heidelberg Engineering Inc, Heidelberg, Germany), SOCT Copernicus (Optopol Technology, Zawiercie, Poland), Cirrus HD-OCT (Carl Zeiss Meditec Inc, Dublin, CA), 3D OCT-1000 (Topcon, Paramus, NJ), etc. At the time of this writing, not all of these machines have glaucoma software or an age-matched normal database.
Because the new SDOCT machines give 3-dimensional data instead of TDOCT’s 2-dimensional data, new algorithms for SDOCT machines need to be developed to better evaluate the ONH in glaucoma patients. For ONH imaging and analysis, SDOCT can produce a 2-dimensional integrated reflectance image, which is similar to a CSLO image (Fig. 8, top). Although CSLO and TDOCT have been largely limited to ONH topography and 2-dimensional imaging, SDOCT may now allow us to better measure neuroretinal rim tissue volume. A parameter called the “minimum distance band” (MDB) may better reflect the actual amount of nerve tissue coursing through the ONH (Fig. 11).49 In this parameter, the “minimum distance” refers to the band of tissue or the shortest distance between the retinal pigment epithelium edge and the ONH surface. All nerve axons coming from the photoreceptors that course through the ONH on the way to the brain must necessarily pass through this narrow MDB, which encircles the cup. This band area could provide an objective quantification of the nerve tissue in the neuroretinal rim, and any focal regions of thinning in this band may indicate glaucomatous neuroretinal rim thinning. As determination of the MDB or neuroretinal rim area only requires determination of the highly reflective ONH surface and the also highly reflective retinal pigment epithelium edge, this value should be easily determined in all glaucoma patients. This ability to consistently determine an objective 3-dimensional parameter of nerve tissue becomes more significant when we realize that not all glaucoma patients can generate a reliable RNFL thickness map.
Figure 11.
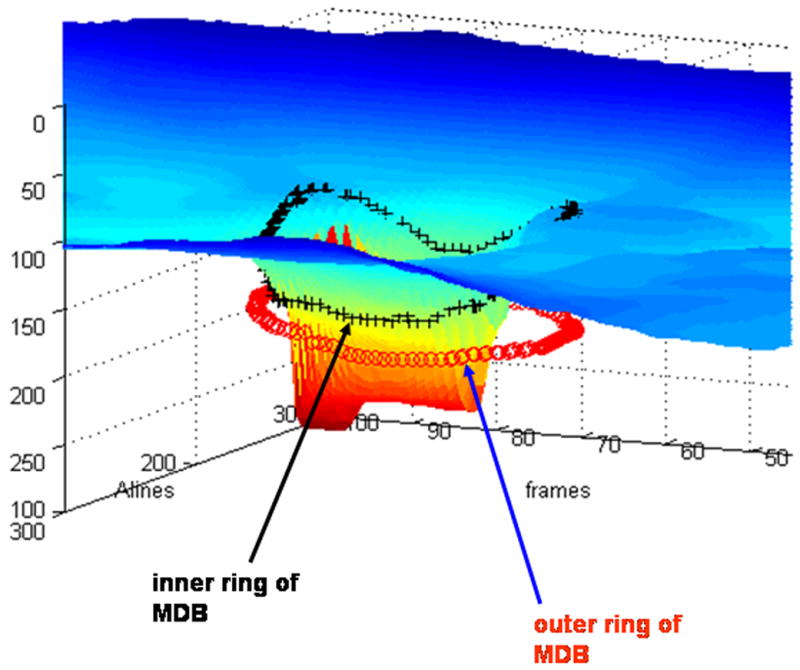
Method for “minimum distance band” (MDB) determination in spectral domain optical coherence tomography (SDOCT) images of the optic nerve head. The inner ring of the MDB is shown by the black crosses and correspond to the optic nerve head surface. The outer ring of the MDB is shown by the tiny circles and correspond to the edge of the retinal pigment epithelium. The image was scanned with a prototype SDOCT system with a superluminescent diode laser (SLD, Superlum, Moscow, Russia) with a full width at half-maximum spectral width of 50 nm centered at 840 nm and with a resolution of 6 μm.
Because ultrahigh acquisition speeds now allow for 3-dimensional scanning of large areas of the retina, SDOCT can create RNFL thickness maps of large regions of the posterior pole. This is in contrast to TDOCT Stratus OCT that only determines the RNFL thickness values along a circular scan around the ONH, but does not give any information of RNFL thickness either inside or outside this circular scan (Fig. 12). The importance of RNFL thickness determination in the early diagnosis of glaucoma can not be overstated because RNFL thinning may in theory be the earliest structural change clinically detectable as RNFL thinning has been shown to occur as early as 6 years before VF loss.11 RNFL thickness maps can also be potentially used for a thorough evaluation of the RNFL in the longitudinal monitoring of glaucoma patients, which is extremely important in the clinical management of a life-long disease.50 The problem with relying on RNFL thickness measurements in evaluating glaucoma patients is that this parameter is more difficult to reliably measure compared with ONH topography. When determining RNFL thickness for SDOCT RNFL thickness maps, the anterior and posterior boundaries of the RNFL can be determined owing to the reflectivity changes between the RNFL-vitreous and RNFL-inner plexiform layer.50 When the RNFL undergoes glaucomatous changes and thinning, the reflectivity of this tissue decreases, which makes the posterior RNFL border often difficult to determine. However, ONH topography is always very easy to determine in OCT because of the consistently sharp change in reflectivity between the vitreous and the ONH surface, even if the ONH undergoes glaucomatous cupping. Therefore, ONH topography and new SDOCT ONH parameters (ie, MDB) may be more consistently reliable parameters in the evaluation of glaucoma patients.
Figure 12.
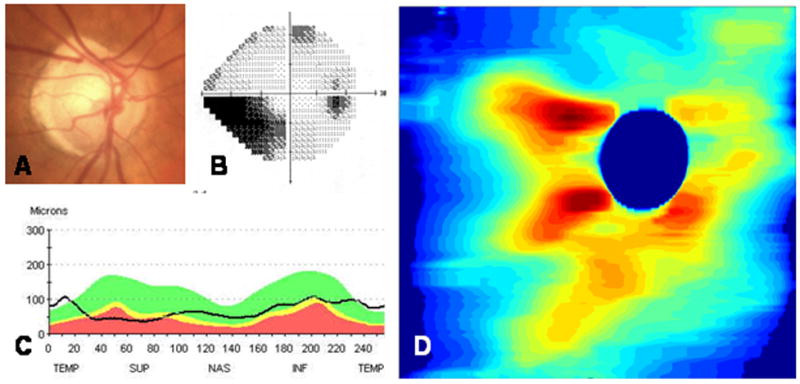
The right eye of a 77-year-old white woman was found to have mixed mechanism glaucoma. Her fundus photograph (A) showed superior neuroretinal rim thinning that corresponds to an inferior nasal step (B) on Humphrey visual field testing (24-2). From the Stratus OCT3 (Carl Zeiss Meditec Inc, Dublin, CA), retinal nerve fiber layer (RNFL) thinning was greater superiorly than inferiorly (C). Spectral domain optical coherence tomography (SDOCT) RNFL thickness map displays the entire peripapillary RNFL thickness (D), with greater RNFL thinning superiorly than inferiorly. The image was scanned with a prototype SDOCT system using a superluminescent diode laser (SLD, Superlum, Moscow, Russia) with a full width at half-maximum spectral width of 50 nm centered at 840 nm and with a resolution of 6 μm.
SDOCT imaging also has the capability of creating 3-dimensional video movies of the ONH and RNFL. Using Doppler principles, spectral domain optical doppler tomography also provides information on retinal blood flow dynamics.51,52 Better noninvasive methods to assess blood flow abnormalities in vivo may help us to better understand the vascular theories of glaucomatous damage. SDOCT also has the capability of directly measuring in vivo RNFL birefringence, which may change in glaucoma and that may help in more accurate RNFL thickness determinations.53 Anterior segment imaging is also possible with SDOCT.54
Conclusions
SDOCT can provide objective, quantitative, and reproducible images of the ONH and RNFL, both of which undergo structural changes in glaucoma before VF loss. Current imaging technologies (ie, HRT, GDx, and TDOCT) have not been proven to be better than more subjective qualitative traditional clinical assessment of the eye with stereo disc photography and VF testing. The most recent development of SDOCT has enabled ophthalmic imaging with unprecedented simultaneous ultrahigh speed and UHR. The faster acquisition speed of SDOCT enables 3-dimensional video imaging of the ONH, 3-dimensional RNFL thickness maps, and better anterior segment imaging. These new advancements in SDOCT may lead to earlier diagnosis or better longitudinal monitoring of patients with glaucoma, one of the leading causes of blindness worldwide.
Acknowledgments
Drs Chen and de Boer received funding from NIH RO1 EY14975. Dr de Boer is a recipient of grant/research support from NIDEK Inc. Drs de Boer and Mujat have patents in SDOCT technology.
References
- 1.The International Bank for Reconstruction and Development—The World Bank. WorldAQ3 Development Report. Oxford: Oxford University Press; 1993. [Google Scholar]
- 2.Quigley HA. Number of people with glaucoma world wide. Br J Ophthalmol. 1996;80:389–393. doi: 10.1136/bjo.80.5.389. [DOI] [PMC free article] [PubMed] [Google Scholar]
- 3.Dielemans I, Vingerling JR, Wolfs RC, et al. The prevalence of primary open-angle glaucoma in a population-based study in the Netherlands. The Rotterdam Study. Ophthalmology. 1994;101:1851–1855. doi: 10.1016/s0161-6420(94)31090-6. [DOI] [PubMed] [Google Scholar]
- 4.Leske MC, Connell AM, Schachat AP, et al. The Barbados Eye Study. Prevelance of open angle glaucoma. Arch Ophthalmol. 1994;112:821–829. doi: 10.1001/archopht.1994.01090180121046. [DOI] [PubMed] [Google Scholar]
- 5.Mitchell P, Smith W, Attebo K, et al. Prevalence of open-angle glaucoma in Australia. The Blue Mountains Eye Study. Ophthalmology. 1996;103:1661–1669. doi: 10.1016/s0161-6420(96)30449-1. [DOI] [PubMed] [Google Scholar]
- 6.King AJ, Reddy A, Thompson JR, et al. The rates of blindness and of partial sight registration in glaucoma patients. Eye. 2000;14:613–619. doi: 10.1038/eye.2000.152. [DOI] [PubMed] [Google Scholar]
- 7.Coleman AL. Glaucoma. Lancet. 1999;354:1803–1810. doi: 10.1016/S0140-6736(99)04240-3. [DOI] [PubMed] [Google Scholar]
- 8.Van Buskirk EM, Cioffi GA. Glaucomatous optic neuropathy. Am J Ophthalmol. 1992;113:447–452. doi: 10.1016/s0002-9394(14)76171-9. [DOI] [PubMed] [Google Scholar]
- 9.Lin SC, Singh K, Jampel HD, et al. Optic nerve head and retinal nerve fiber layer analysis. A report by the American Academy of Ophthalmology. Ophthalmology. 2007;114:1937–1949. doi: 10.1016/j.ophtha.2007.07.005. [DOI] [PMC free article] [PubMed] [Google Scholar]
- 10.Quigley HA, Addicks EM, Green WR. Optic nerve damage in human glaucoma. III. Quantitative correlation of nerve fiber loss and visual field defect in glaucoma, ischemic neuropathy, papilledema, and toxic neuropathy. Arch Ophthalmol. 1982;100:135–146. doi: 10.1001/archopht.1982.01030030137016. [DOI] [PubMed] [Google Scholar]
- 11.Sommer A, Katz J, Quigley HA, et al. Clinically detectable nerve fiber atrophy precedes the onset of glaucomatous field loss. Arch Ophthalmol. 1991;109:77–83. doi: 10.1001/archopht.1991.01080010079037. [DOI] [PubMed] [Google Scholar]
- 12.Kerrigan-Baumrind LA, Quigley HA, Miller NR, et al. Number of ganglion cells in glaucoma eyes compared with threshold visual field tests in the same persons. Invest Ophthalmol Vis Sci. 2000;41:741–748. [PubMed] [Google Scholar]
- 13.Reyes RD, Tomita G, Kitazawa Y. Retinal nerve fiber layer thickness within the area of apparently normal visual field in normal-tension glaucoma with hemifield defect. J Glaucoma. 1998;7:329–335. [PubMed] [Google Scholar]
- 14.Greaney MJ, Hoffman DC, Garway-Heath DF, et al. Comparison of optic nerve imaging methods to distinguish normal eyes from those with glaucoma. Invest Ophthalmol Vis Sci. 2002;43:140–145. [PubMed] [Google Scholar]
- 15.Deleon-Ortega JE, Arthur SN, McGwin G, et al. Discrimination between glaucomatous and nonglaucomatous eyes using quantitative imaging devices and subjective optic nerve head assessment. Invest Ophthalmol Vis Sci. 2006;47:3374–3380. doi: 10.1167/iovs.05-1239. [DOI] [PMC free article] [PubMed] [Google Scholar]
- 16.Cense B, Chen TC, Park BH, et al. Thickness and birefringence of healthy retinal nerve fiber layer measured with polarization-sensitive optical coherence tomography. Invest Ophthalmol Vis Sci. 2004;45:2606–2612. doi: 10.1167/iovs.03-1160. [DOI] [PubMed] [Google Scholar]
- 17.Huang XR, Bagga H, Greenfield DS, et al. Variation of peripapillary retinal nerve fiber layer birefringence in normal human subjects. Invest Ophthalmol Vis Sci. 2004;45:3073–3080. doi: 10.1167/iovs.04-0110. [DOI] [PubMed] [Google Scholar]
- 18.Huang XR, Knighton RW. Microtubules contribute to the birefringence of the retinal nerve fiber layer. Invest Ophthalmol Vis Sci. 2005;46:4588–4593. doi: 10.1167/iovs.05-0532. [DOI] [PubMed] [Google Scholar]
- 19.Huang D, Swanson EA, Lin CP, et al. Optical coherence tomography. Science. 1991;254:1178–1181. doi: 10.1126/science.1957169. [DOI] [PMC free article] [PubMed] [Google Scholar]
- 20.Chen TC, Cense B, Miller JW, et al. Histologic correlation of in vivo optical coherence tomography images of the human retina. Am J Ophthalmol. 2006;141:1165–1168. doi: 10.1016/j.ajo.2006.01.086. [DOI] [PubMed] [Google Scholar]
- 21.Gloesmann M, Hermann B, Schubert C, et al. Histologic correlation of pig retina radial stratification with ultra high resolution optical coherence tomography. Invest Ophthalmol Vis Sci. 2003;44:1696–1703. doi: 10.1167/iovs.02-0654. [DOI] [PubMed] [Google Scholar]
- 22.Fukuchi T, Takahashi K, Shou K, et al. Optical coherence tomography findings in normal retina and laser-introduced choroidal neovascularization in rats. Graefes Arch Clin Exp Ophthalmol. 2001;239:41–46. doi: 10.1007/s004170000205. [DOI] [PubMed] [Google Scholar]
- 23.Fujimoto JG. Optical coherence tomography for ultrahigh resolution in vivo imaging. Nat Biotechnol. 2003;21:1361–1367. doi: 10.1038/nbt892. [DOI] [PubMed] [Google Scholar]
- 24.Drexler W, Sattmann H, Hermann B, et al. Enhanced visualization of macular pathology with the use of ultrahigh-resolution optical coherence tomography. Arch Ophthalmol. 2003;121:695–706. doi: 10.1001/archopht.121.5.695. [DOI] [PubMed] [Google Scholar]
- 25.Yi K, Chen TC, de Boer JF. Spectral domain optical coherence tomography. Tech Ophthalmol. 2006;4:170–174. [Google Scholar]
- 26.Zangwill LM, Bowd C, Berry CC, et al. Discriminating between normal and glaucomatous eyes using the Heidelberg Retina Tomograph, GDx Nerve Fiber Analyzer, and Optical Coherence Tomograph. Arch Ophthalmol. 2001;119:985–993. doi: 10.1001/archopht.119.7.985. [DOI] [PubMed] [Google Scholar]
- 27.Blumenthal EZ, Weinreb RN. Assessment of the retinal nerve fiber layer in clinical trials of glaucoma neuroprotection. Survey Ophthalmol. 2001;45:305–312. doi: 10.1016/s0039-6257(01)00202-8. discussion 332–334. [DOI] [PubMed] [Google Scholar]
- 28.Choplin NT, Lundy DC. The sensitivity and specificity of scanning laser polarimetry in the detection of glaucoma in a clinical setting. Ophthalmology. 2001;108:899–904. doi: 10.1016/s0161-6420(00)00652-7. [DOI] [PubMed] [Google Scholar]
- 29.Trible JR, Schultz RO, Robinson JC, et al. Accuracy of scanning laser polarimetry in the diagnosis of glaucoma. Arch Ophthalmol. 1999;117:1298–1304. doi: 10.1001/archopht.117.10.1298. [DOI] [PubMed] [Google Scholar]
- 30.Sinai MJ, Essock EA, Fechtner RD, et al. Diffuse and localized nerve fiber layer loss measured with a scanning laser polarimeter: sensitivity and specificity of detecting glaucoma. J Glaucoma. 2000;9:154–162. doi: 10.1097/00061198-200004000-00005. [DOI] [PubMed] [Google Scholar]
- 31.Hwang JM, Kim TW, Park KH, et al. Correlation between topographic profiles of localized retinal nerve fiber layer defects as determined by optical coherence tomography and red-free fundus photography. J Glaucoma. 2006;15:223–228. doi: 10.1097/01.ijg.0000212218.96932.f7. [DOI] [PubMed] [Google Scholar]
- 32.Zangwill LM, Weinreb RN, Beiser JA, et al. Baseline topographic optic disc measurements are associated with the development of primary open-angle glaucoma: the Confocal Scanning Laser Ophthalmoscopy Ancillary Study to the Ocular Hypertension Treatment Study. Arch Ophthalmol. 2005;123:1188–1197. doi: 10.1001/archopht.123.9.1188. [DOI] [PubMed] [Google Scholar]
- 33.Mohammadi K, Bowd C, Weinreb RN, et al. Retinal nerve fiber layer thickness measurements with scanning laser polarimetry predict glaucomatous visual field loss. Am J Ophthalmol. 2004;138:592–601. doi: 10.1016/j.ajo.2004.05.072. [DOI] [PubMed] [Google Scholar]
- 34.Lalezary M, Medeiros FA, Weinreb RN, et al. Baseline optical coherence tomography predicts the development of glaucomatous change in glaucoma suspects. Am J Ophthalmol. 2006;142:576–582. doi: 10.1016/j.ajo.2006.05.004. [DOI] [PubMed] [Google Scholar]
- 35.Yi K, deBoer JF, Chen TC. Optic nerve head and retinal nerve fiber layer imaging in glaucoma. Contemp Ophthalmol. 2007;6:1–7. [Google Scholar]
- 36.Chen TC, Cense B, Pierce MC, et al. Spectral domain optical coherence tomography. Ultra-high speed, ultra-high resolution ophthalmic imaging. Arch Ophthalmol. 2005;123:1715–1720. doi: 10.1001/archopht.123.12.1715. [DOI] [PubMed] [Google Scholar]
- 37.Leitgeb R, Hitzenberger CK, Fercher AF. Performance of Fourier domain vs. time domain optical coherence tomography. Opt Express. 2003;11:889–894. doi: 10.1364/oe.11.000889. [DOI] [PubMed] [Google Scholar]
- 38.de Boer JF, Cense B, Park BH, et al. Improved signal to noise ratio in spectral domain compared with time domain optical coherence tomography. Opt Lett. 2003;28:2067–2069. doi: 10.1364/ol.28.002067. [DOI] [PubMed] [Google Scholar]
- 39.Nassif NA, Cense B, Park BH, et al. In vivo human retinal imaging by ultrahigh-speed spectral domain optical coherence tomography. Opt Lett. 2004;29:480–482. doi: 10.1364/ol.29.000480. [DOI] [PubMed] [Google Scholar]
- 40.Nassif NA, Cense B, Park BH, et al. In vivo high-resolution video-rate spectral domain optical coherence tomography of the human retina and optic nerve. Opt Express. 2004;12:367–376. doi: 10.1364/opex.12.000367. [DOI] [PubMed] [Google Scholar]
- 41.Cense B, Nassif NA, Chen TC, et al. Ultrahigh-resolution high speed retinal imaging using spectral-domain optical coherence tomography. Opt Express. 2004;12:2435–2447. doi: 10.1364/opex.12.002435. [DOI] [PubMed] [Google Scholar]
- 42.Wojtkowski M, Srinivasan V, Ko T, et al. Ultrahigh-resolution, high-speed, fourier domain optical coherence tomography and methods for dispersion compensation. Opt Express. 2004;12:2404–2422. doi: 10.1364/opex.12.002404. [DOI] [PubMed] [Google Scholar]
- 43.Fercher AF, Hitzenberger CK, Kamp G, et al. Measurement of intraocular distances by backscattering spectral interferometry. Opt Commun. 1995;117:43–48. [Google Scholar]
- 44.Wojtkowski M, Leitgeb R, Kowalczyk A, et al. In vivo human retinal imaging by fourier domain optical coherence tomography. J Biomed Opt. 2002;7:457–463. doi: 10.1117/1.1482379. [DOI] [PubMed] [Google Scholar]
- 45.Wojtkowski M, Srinivasan V, Jujimoto JG, et al. Three-dimensional retinal imaging with high-speed ultrahigh-resolution optical coherence tomography. Ophthalmology. 2005;112:1734–1746. doi: 10.1016/j.ophtha.2005.05.023. [DOI] [PMC free article] [PubMed] [Google Scholar]
- 46.Yun SH, Tearney GJ, de Boer JF, et al. Motion artifacts in optical coherence tomography with frequency-domain ranging. Opt Express. 2004;12:2977–2998. doi: 10.1364/opex.12.002977. [DOI] [PMC free article] [PubMed] [Google Scholar]
- 47.Yun JW, Tearney GJ, de Boer JF, et al. Pulsed-source and swept-source spectral-domain optical coherence tomography with reduced motion artifacts. Opt Express. 2004;12:5614–5624. doi: 10.1364/opex.12.005614. [DOI] [PMC free article] [PubMed] [Google Scholar]
- 48.You JW, Chen TC, Mujat M, et al. Pulsed illumination spectral-domain optical coherence tomography for human retinal imaging. Opt Express. 2006;14:6739–6748. doi: 10.1364/oe.14.006739. [DOI] [PubMed] [Google Scholar]
- 49.Povazay B, Hofer B, Hermann B, et al. Minimum distance mapping using three-dimensional opticalAQ4 coherence tomography for glaucoma diagnosis. J Biomed Opt. 2007;12:041204. doi: 10.1117/1.2773736. [DOI] [PubMed] [Google Scholar]
- 50.Mujat M, Chan RC, Cense B, et al. Retinal nerve fiber thickness map determined from optical coherence tomography images. Opt Express. 2005;13:9480–9491. doi: 10.1364/opex.13.009480. [DOI] [PubMed] [Google Scholar]
- 51.Leitgeb R, Schmetterer L, Drexler W, et al. Real time assessment of retinal blood flow with ultrafast acquisition by color doppler Fourier domain optical coherence tomography. Opt Express. 2003;11:3116–3121. doi: 10.1364/oe.11.003116. [DOI] [PubMed] [Google Scholar]
- 52.White BR, Pierce MC, Nassif N, et al. In vivo dynamic human retinal blood flow imaging using ultrahigh-speed spectral domain optical coherence tomography. Opt Express. 2003;11:3490–3497. doi: 10.1364/oe.11.003490. [DOI] [PubMed] [Google Scholar]
- 53.Cense B, Chen TC, Park BH, et al. In vivo birefringence and thickness measurements of the human retinal nerve fiber layer using polarization-sensitive optical coherence tomography. J Biomed Opt. 2004;9:121–125. doi: 10.1117/1.1627774. [DOI] [PubMed] [Google Scholar]
- 54.Christopoulos V, Kagemann L, Wollstein G, et al. In vivo corneal high-speed, ultra-high resolution optical coherence tomography. Arch Ophthalmol. 2007;125:1027–1035. doi: 10.1001/archopht.125.8.1027. [DOI] [PMC free article] [PubMed] [Google Scholar]


