Abstract
Determination of the proportion of neutrophils in the peripheral blood is important for diagnostic purposes in medicine and for evaluating new drugs in the pharmaceutical industry. To measure the neutrophil concentration in rat blood, a fast and accurate flow cytometric method was developed. Rat neutrophils were quantified by using primary antibodies that recognize the RP1 antigen and secondary antibodies conjugated with fluorescein isothiocyanate. The flow cytometric method was calibrated by comparing cytometric results with data from a manual differential count. The results obtained by these 2 methods correlated with a Pearson correlation coefficient of 0.91 and were in agreement according to subsequent statistical analysis. To confirm the usefulness of the method in preclinical applications, the production of neutrophils in rats was stimulated by pegfilgrastim. Blood samples were taken at predetermined time points, and the pharmacodynamic profile was determined. These results confirmed that the flow cytometric method for neutrophil quantification is accurate and much faster than the manual microscopic method. Moreover, the flow cytometric method is easy to use, suggesting that it could become the method of choice for preclinical applications.
Abbreviations: ANC, absolute neutrophil count; FITC, fluorescein isothiocyanate; WBC, white blood cell count
Determination of neutrophil concentration is a widespread practice in human medicine, in veterinary medicine, and in the pharmaceutical industry.10,13,16,19 In particular, neutrophil concentration is an important parameter for preclinical tests on laboratory animals.14,24 Neutrophil granulocytes are myeloid blood cells with diverse functions in vertebrate organisms, including defense against bacterial, fungal, and other infections, with specialized cellular functions such as phagocytosis, adherence, chemotaxis, and secretion.2 The number of neutrophils can change dramatically due to many diverse pathologic conditions and drugs. Pegfilgrastim is pegylated granulocyte-colony stimulating factor, a drug used to accelerate neutrophil recovery and reduce the incidence of infections after chemotherapy.4 Bacterial infections, acute inflammation, and some malignancies typically lead to neutrophilia, whereas leukemias, autoimmune diseases, and chemotherapy frequently cause neutropenia.19
Microscopic determination of the neutrophil percentage in blood is a common method used in human and veterinary clinics as well as in the pharmaceutical industry. The microscopic assessment of neutrophil concentration suffers from low reliability, owing to the quality of the blood smear and skill of the analyst. Furthermore, microscopy is time-consuming. Manual differentiation of white blood cells is still considered to be the routine method for validation of automated instrumentation.10,22
Parallel with the classic manual method, flow cytometry has emerged as a key technology in clinical laboratories. Flow cytometry offers the possibility of analyzing a high number of samples in a short time. In comparison to classic microscopic counting techniques, flow cytometry offers less biased, more accurate, and more precise sample assessment. Flow cytometers in current use include stand-alone instruments and those incorporated in hematology analyzers. Automated hematology analyzers using optical measurements typically are used for testing a restricted set of parameters. Automated analyzers have not replaced the manual method due to the inaccuracy of assignment of monocytes, eosinophils, and basophils from many animal species,27 and they fail to resolve band neutrophils adequately.3 In contrast, flow cytometers are highly flexible instruments that can measure various properties of cells and their relative counts in different cell systems. Therefore flow cytometers may be more desirable than automatic hematology machines in many settings, especially in the research area. Flow cytometry has been developing in parallel with the development of new fluorescent dyes conjugated with antibodies. Because most antibodies are made for human clinical applications, the main obstacle to maximal application of flow cytometry in veterinary medicine is the lack of species-specific antibodies. Although flow cytometry can rapidly evaluate many cells,27,30 the accuracy of flow-based cell quantification compared with the standard manual method is uncertain until direct comparison studies are reported.
In the current study, a flow cytometric method for the determination of rat neutrophil concentration in peripheral blood was developed. Such a technique would be useful for evaluating new drugs in preclinical studies, particularly as a screening method for selection of the best analog of a drug. The flow cytometric method was compared with traditional manual counting under light microscopy. Various characteristics of the new method, such as accuracy and ease of use, were examined.
Materials and Methods
Animals.
A total of 60 male and female Wistar rats (HsdRccHan:WIST; Harlan, San Pietro al Natisone, Italy) between 2 and 3 mo of age were used in this study. They were housed 4 to 5 per cage in a room with controlled temperature (23 ± 1 °C) and humidity (40% to 70%) and a 12:12-h light:dark cycle. Food and water were available ad libitum. All rats received care in compliance with the European Convention for the Protection of Vertebrate Animals9 and European Directive 86/609/EEC.1 The study was approved by the Veterinary Administration of the Republic of Slovenia.
Blood collection.
Blood samples of 250 μL were obtained from the orbital venous plexus under light CO2 anesthesia by using microcentrifuge tubes containing EDTA (Microtainer Brand Tubes with EDTA, Becton Dickinson, Franklin Lakes, NJ). Samples were mixed gently and put on a roller mixer until analysis in an automated blood counter (ABC Vet, ABX Diagnostics, Montpelier, France) within 1 h after collection.
Induction of neutrophil proliferation.
Eight rats were injected subcutaneously with pegfilgrastim (250 μg/kg; Neulasta, Amgen, Thousand Oaks, CA) to stimulate the production of neutrophil granulocytes. Blood samples were taken before injection and 6, 48, 96, 168, and 192 h after the injection. Absolute neutrophil counts were determined by using manual and flow cytometric methods as described in following sections.
Manual determination of neutrophil counts.
Blood smears were made from a drop of EDTA-treated blood, dried in air, and stained (Hemacolor Stain for Microscopy, Merck, Darmstadt, Germany). The slides were examined under light microscopy (Olympus BX51, Europa Holding Company, Hamburg, Germany), and 150 to 200 white blood cells were counted. To eliminate inefficiencies associated with mechanical desktop tally counters, we used counting software (EasyCell Counter).8 Each leukocyte was assigned to one of the following categories: lymphocytes, monocytes, segmented neutrophils, band neutrophils, eosinophils, basophils, and other cells. For each category, the percentage was calculated by dividing the number of cells in each category of leukocytes by the total number of leukocytes counted. Twelve of the 60 slides were counted three times to get information about the precision of the method.
Flow cytometric determination of neutrophils.
Blood samples were diluted (1:2) with serum-free PBS (0.01 M sodium phosphate, 0.15 M sodium chloride, pH 7.2) to adjust the red and white blood cell concentrations. Erythrocytes in the samples were lysed by adding 0.5 mL of a lysing solution (OptyLyse C Solution, Beckman Coulter, Fullerton, CA) to 50 μL of diluted blood, mixing, and incubating for 10 min at room temperature. Then 0.5 mL serum-free PBS was added to each sample, mixed, and incubated for 10 min at room temperature. The samples were centrifuged for 5 min at 500 × g. Each pellet was mixed with 50 μL PBS, followed by 20 µL of primary antibody solution (50 μg/mL). The primary antibody solution contained a purified mouse antirat granulocyte monoclonal antibody that specifically recognizes the RP1 antigen on rat segmented and band neutrophils (BD Pharmingen, Franklin Lakes, NJ). After addition of the primary antibody, the samples were mixed and incubated for 30 min at room temperature, followed by the addition of 2 mL PBS containing 0.2% fetal calf serum and 0.01% NaN3 and centrifugation for 5 min at 500 × g. Supernatant liquid was discarded, and 50 μL of secondary antibody [50 μg/mL; fluorescein isothiocyanate (FITC)-conjugated polyclonal goat antimouse immunoglobulin antibodies (BD Pharmingen)] was added. The tubes were kept in the dark at room temperature for 15 min, 0.5 mL of PBS containing 0.2% fetal calf serum and 0.01% NaN3 was added to each tube, and tubes were centrifuged for 1 min at 500 × g. Supernatant liquid was discarded, and pellets each were resuspended in 0.5 mL serum-free PBS. To determine appropriate concentrations of primary and secondary antibodies for samples, antibody titration was performed as recommended by the manufacturer. These experiments tested 1, 2, 4, 6, and 20 μL of the primary antibody and 1.25, 2.5, 5, 7.5, and 25 μL of the secondary antibodies in the ratio of 1:1.25 (primary versus secondary antibodies; stock concentration of antibodies, 1 mg/mL). All samples were analyzed by flow cytometry within 6 h of collection.
Data acquisition and analysis were performed on a flow cytometer (Altra Flow Cytometer, Beckman Coulter) with a 488-nm water-cooled laser. Green fluorescence was collected through a 520- to 530-nm bandpass filter. A minimum of 10,000 cells within the gated region were analyzed; data were presented by using the software provided with the flow cytometer by the manufacturer (Beckman Coulter).
Calculation of absolute neutrophil count (ANC).
The manual ANC (ANCm) was calculated as the total leukocyte count (WBC) multiplied by the percentages of segmented neutrophils (Ns) and band neutrophils,(Nb) as follows:
The flow cytometric ANC (ANCfc) was calculated as WBC multiplied by the percentage of neutrophils as determined by using the antirat granulocyte monoclonal and FITC-conjugated secondary antibodies (NAb-FITC):
Here, WBC and ANC are given as number of cells per liter (n × 109cells/L), whereas segmented and band neutrophils are given as percentages of the total leukocyte count.
Statistics.
All statistics were calculated by using Microsoft Excel software (Microsoft Corporation, Redmond, WA). Mean, standard deviation, and coefficient of variation were determined for parallel samples. Differences in precision between the 2 methods were assessed by using Student t tests. To compare the results obtained by using the manual and flow cytometric methods, Pearson's correlation coefficient and the concordance correlation coefficient were calculated. Passing–Bablok regression was conducted by using statistical software (MedCalc for Windows, version 9.5.2.0, MedCalc Software, Mariakerke, Belgium). We hypothesized that manual and flow cytometric ANCs evaluated at each time point by using a paired-sample t test would not differ. A P value of less than 0.05 was considered statistically significant.
Results
Detection of neutrophils by flow cytometry.
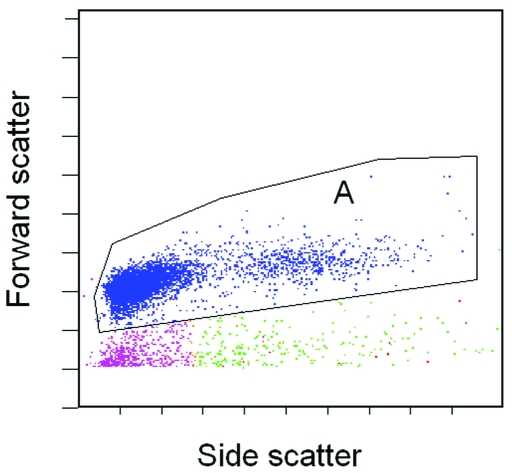
Figure 1 shows representative dot plot graph of leukocytes in rat peripheral blood (region A) obtained after erythrocytes in the blood samples were lysed.
Figure 1.
Representative flow cytometric analysis of rat peripheral blood leukocytes by forward and side scatter characteristics. Region A is the main leukocyte population.
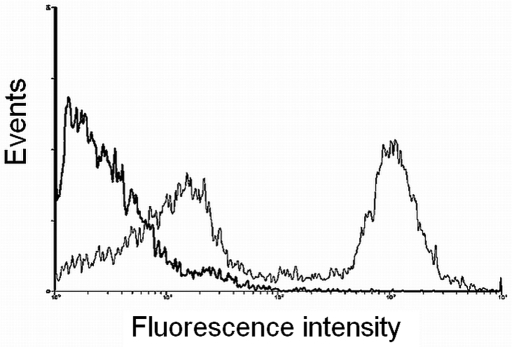
The specificity of the primary antibody for detection of rat neutrophils was established by the manufacturer (BD Pharmingen). According to results of antibody titration, the most appropriate quantities for conjugation with rat neutrophils were 1 or 2 μL of primary antibody and 1.25 or 2.5 μL of secondary antibodies. Rat blood leukocytes then were analyzed for expression of FITC fluorescence Figure 2. On the histograms, fluorescent neutrophils were clearly distinguishable from other blood cells. Histograms of fluorescence intensity were recorded for each animal, and the percentage of neutrophils in the white blood cells was calculated. Blood samples that were not treated with primary antibodies served as negative controls and lacked green fluorescence (black line on Figure 2).
Figure 2.
Cells were treated with primary antibodies specific for rat neutrophils and FITC-conjugated secondary antibodies. The histogram shows the green fluorescence (530 nm bandpass) of the rat leukocytes (narrow line, 2 peaks). Cells untreated with primary antibodies were used as a negative control (wide line, 1 peak).
Flow cytometric method for determination of neutrophil concentration is in agreement with microscopic enumeration.
To determine whether flow cytometric evaluation offers an acceptable alternative to traditional manual scoring methods, the concentration of neutrophils in rat peripheral blood were determined by the 2 methods and results compared. To obtain control values, peripheral blood samples before and after treatment with pegfilgrastim were evaluated with an automated hematologic analyzer to determine the numbers of white blood cells. Measurement of precision showed that the mean coefficient of variation estimated from 3 independent analyses (n = 12) for each method was 15.4 for microscopic counting and 6.8 for the flow cytometric method. The difference in precision between the 2 methods was significant (t test, P = 0.01).
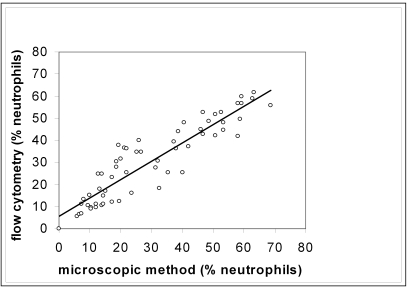
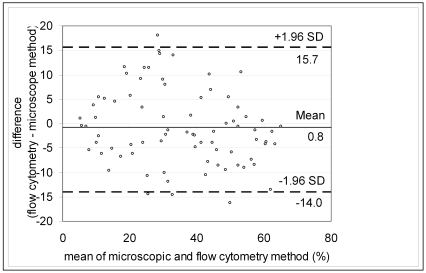
The results of the manual and flow cytometric methods were compared and plotted on a scatter graph (Figure 3). The 2 methods showed strong positive correlation (Pearson correlation coefficient, 0.91), indicating good association, but the range of data was insufficient for using typical linear regression analysis to provide reliable estimates of the slope and intercept.14,31 The data were improved by using Passing–Bablok regression, which yielded an intercept of 1.43 (95% confidence interval, –2.12 to 4.61) and a slope of 0.91 (95% confidence interval = 0.83 to 1.01), indicating that no constant or proportional error was present. The concordance correlation coefficient was 0.908, which is considered to indicate near-perfect agreement.14A difference plot with acceptance limits defined by inherent analytical imprecision was constructed to judge the acceptability of the method (Figure 4).14,20
Figure 3.
Correlation between flow cytometric and microscopic methods. A line-fitted plot of regression analysis comparing the microscope-determined percentage of neutrophils to flow cytometric-determined percentage of neutrophils, r = 0.91.
Figure 4.
A difference plot in which the difference between the 2 methods was plotted against the mean value of the methods. Dotted lines represent 1.96 SD above and below the mean (95% prediction interval).
Application of neutrophil quantification by flow cytometry.
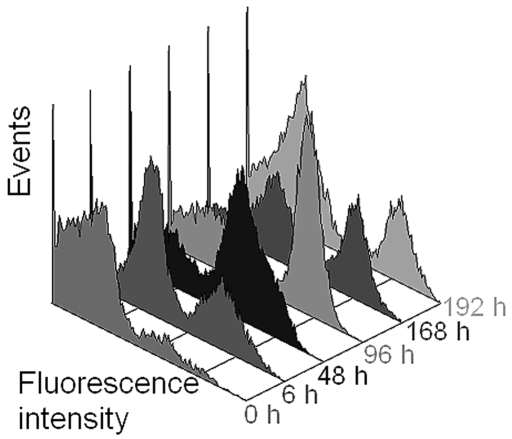
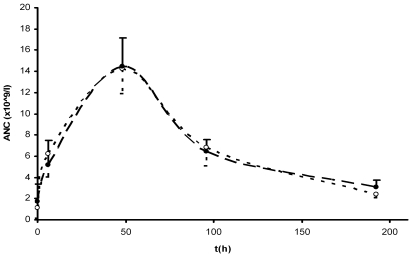
Rats were treated with pegfilgrastim to stimulate proliferation of neutrophils4,17 (Figures 5 and 6). Peripheral blood samples were collected subsequently for both microscopic and flow cytometric analysis. Neutrophil counts remained unchanged at 6 h after treatment, but then increased after 48 h, peaked after 96 h, and began to decline after 168 h (Figure 5). To show the utility of the flow cytometric method for neutrophil counts over a broad range of values, the ANC was calculated for each time point of blood collection by using both methods, thus yielding a pharmacodynamic profile (Figure 6).
Figure 5.
Three-dimensional histogram of the green-fluorescence of rat leukocytes after induction with pegfilgrastim. Samples were obtained from an untreated rat (0 h) and at various times after induction.
Figure 6.
Pegfilgrastim-induced pharmacodynamic profile. Each point on the graph represents the absolute neutrophil count (mean ± 1 SD; n = 8). Solid circles, flow cytometry; open circles, microscopy.
Discussion
In this study, a new method for the determination of neutrophil concentration in rats by flow cytometry was evaluated. Rats are the most widely used rodents in toxicology and pharmacokinetic studies, and rat peripheral blood tests have great potential for providing investigators with useful information.15 The development of the flow cytometric method for evaluating neutrophil concentration represents a technologic advance over manual, microscopy-based method for data collection. Flow cytometric scoring eliminates bias and allows evaluation of a much greater number of cells per animal, thus greatly improving the accuracy of the method. The flow cytometric neutrophil count in our study is twice as precise as the manual neutrophil count and is in agreement with other observations.21
The described flow cytometric method uses an antibody specific to rat neutrophils and FITC-conjugated secondary antibodies, such that neutrophils could be quantified as the percentage of the total population of the gated leukocytes (Figures 1 and 2). Reproducible monoclonal antibody staining relies on the correct ratio of antibody to cells,18 and some authors12 have recommended verification of the amount of monoclonal antibodies used in each staining procedure and the type of sample used. Appropriate titration can reduce nonspecific binding as well as lead to the desired specific epitope binding.24 The present study used purified mouse antirat granulocytes monoclonal antibodies proven to react specifically with rat peripheral blood neutrophils without binding rat macrophages and eosinophils.11 This monoclonal antibody recognizes the RP1 antigen, which is expressed on rat segmented and band neutrophils. Therefore, the flow cytometric method described does not differentiate between segmented and band neutrophils, but this deficiency is irrelevant for determining the ANC. Nevertheless, veterinary assessments and diagnoses often depend on band versus segmented neutrophil counts. In addition, microscopic evaluation of stained blood films cannot be replaced entirely with any automatic technique for review of other blood cell types, particularly changes in red blood cells (toxic changes, inclusions, micronuclei, hemoparasites, and other alterations in cellular morphology).15,27 In our study the manual technique was used as a reference method to calibrate the flow cytometric results. The correlation coefficient obtained (0.91) is comparable to those in similar studies.5,7,10,13,17,22,26,28 Furthermore, the flow cytometric method was evaluated for acceptability based on inherent imprecision by using a difference plot, because correlation coefficients are inappropriate for comparing analytical methods.14,20,31
One of the key benefits of the presented flow cytometric method is speed. The entire protocol, including sample preparation, staining, and analysis, was accomplished within 3 h even though many samples had to be measured. The determination of neutrophil concentration by the microscope-based method is quite time-consuming, especially when more than 30 different blood samples have to be evaluated. Although fully automated blood cell counters have been used widely in human medical laboratories for decades,29 appropriate software for using automated blood cell counters to evaluate samples from several animal species has been developed only recently.16 These counters are currently available in a limited number of veterinary laboratories; in contrast, a flow cytometer has become standard laboratory equipment.
Few studies compare automated and manual techniques for evaluating animal blood cells. Three studies5,6,23 described a flow cytometric method for evaluation of bone marrow differentials in rats and compared the resulting data with results from a manual count method. In a recent study,23 microscopic analysis was associated with higher variation in rat bone marrow parameters than was flow cytometric evaluation; this difference was attributed to the smaller number of enumerated cells. We also noted this problem: to get results from light microscopy sufficiently quickly, you are forced to count only a limited number of cells. The consequence of that can be error, introduced by the sample size. None of the described methods alone provide the exact number of neutrophil granulocytes. In contrast, coupling our flow cytometric method together with data from the hematologic analyzer does provide an absolute count of rat neutrophils in a blood sample.
We used a hematologic analyzer to measure the total number of leukocytes. If a hematologic analyzer is unavailable, flow count beads can be used to obtain the absolute leukocyte count. In doing so, a known volume and concentration of brightly fluorescent beads is added to the sample and run on the flow cytometer. Because the concentration of beads is known, the volume of analyzed sample can be calculated. The number of cellular events can then be counted and the concentration of the sample is determined.
In conclusion, the flow cytometric method for neutrophil quantification presented here is easy to use, accurate, and rapid. The only equipment needed is a flow cytometer and perhaps a blood cell counter, machines that are in common laboratory use. These characteristics ensure that the new cytometric method is valuable for screening of neutrophil granulocyte count in preclinical drug testing. The applicability of the flow cytometric method for determination of neutrophils was confirmed through a preclinical pharmacodynamic study of pegfilgrastim in rats.
Acknowledgments
The authors are grateful to Andreja Nataša Kopitar for helpful discussions, Edi Kranjc for technical assistance, and Dr Mike Galsworthy for careful reading of the manuscript.
References
- 1.Anon 1986 Directive 86/609/EEC of 24 November 1986 on the approximation of laws, regulations and administrative provisions of the Member States regarding the protection of animals used for experimental and other scientific purposes. Off J Eur Communities L358:1–29 [Google Scholar]
- 2.Bashir S, Cardigan R. 2003. Granulocyte concentrates: how can we assess their quality? Transfus Med 13:245–257 [DOI] [PubMed] [Google Scholar]
- 3.Briggs C, Kunka S, Fujimoto H, Hamaguchi Y, Davis BH, Machin SJ. 2003. Evaluation of immature granulocyte counts by XEIG Master: upgraded software for the XE2100 automated hematology analyzer. Lab Hematol 9:117–124 [PubMed] [Google Scholar]
- 4.Crawford J. 2002. Pegfilgrastim administered once per cycle reduces incidence of chemotherapy-induced neutropenia. Drugs 62Suppl 1:89–98 [DOI] [PubMed] [Google Scholar]
- 5.Criswell KA, Bleavins MR, Zielinski D, Zandee JC. 1998. Comparison of flow cytometric and manual bone marrow differentials in Wistar rats. Cytometry 32:9–17 [PubMed] [Google Scholar]
- 6.Criswell KA, Bleavins MR, Zielinski D, Zandee JC, Walsh KM. 1998. Flow cytometric evaluation of bone marrow differentials in rats with pharmacologically induced hematologic abnormalities. Cytometry 32:18–27 [DOI] [PubMed] [Google Scholar]
- 7.de Jonge R, Brouwer R, van Rijn M, van Acker BAC, Otten HJAM, Lindemans J. 2006. Automated analysis of pleural fluid total and differential leukocyte counts with the Sysmex XE2100. Clin Chem Lab Med 44:1367–1371 [DOI] [PubMed] [Google Scholar]
- 8.Dogsa I. 2006. EasyCell counter. [Cited 2007 Mar 08]. Available at: http://www.bf.uni-lj.si/zivilstvo/o-oddelku/katedre-in-druge-org-enote/za-mikrobiologijo/software/easycell.html
- 9.ETS123 European convention for the protection of vertebrate animals used for experimental and other scientific purposes. 1986. Strasbourg (France): Council of Europe Press [Google Scholar]
- 10.Finn LS, Hall J, Xu M, Rutledge JC. 2004. Flow cytometric validation of automated differentials in pediatric patients. Lab Hematol 10:112–118 [DOI] [PubMed] [Google Scholar]
- 11.Gotoh S, Itoh M, Fujii Y, Arai S, Sendo F. 1986. Enhancement of the expression of a rat neutrophil-specific cell surface antigen by activation with phorbol myristate acetate and concanavalin A. J Immunol 13:643–650 [PubMed] [Google Scholar]
- 12.Gratama JW, Bolhuis RLH, Van't Veer MB. 1999. Quality control of flow cytometric immunophenotyping of haematological malignancies. Clin Lab Haematol 21:155–160 [DOI] [PubMed] [Google Scholar]
- 13.Hijiya N, Onciu M, Howard SC, Zang Z, Cheng C, Sandlund JT, Kyzer EP, Behm FG, Pui C. 2004. Utility of automated counting to determine absolute neutrophil counts and absolute phagocyte counts for pediatric cancer treatment protocols. Cancer 101:2681–2686 [DOI] [PubMed] [Google Scholar]
- 14.Jensen AL, Kjelgaard-Hansen M. 2006. Method comparison in the clinical laboratory. Vet Clin Pathol 35:276–286 [DOI] [PubMed] [Google Scholar]
- 15.Lanning LL. 2006. Toxicologic pathology assessment, p 109–133. In: Jacobson-Kram D, Keller KA. Toxicological testing handbook. 2nd ed New York (NY): Informa Healthcare USA [Google Scholar]
- 16.Mathers RA, Evans GO, Bleb G, Tornow T. 2007. Total and differential leucocyte counts in rat and mouse bronchoalveolar lavage fluids using the Sysmex XT2000iV. Comp Clin Pathol 16:29–39 [Google Scholar]
- 17.Molineux G, Kinstler O, Briddel B, Hartley C, McElroy P, Kerzic P, Sutherland W, Stoney G, Kern B, Fletcher FA, Cohen A, Korach E, Ulich T, McNiece I, Lockbaum P, Miller-Messana MA, Gardner S, Hunt T, Schwab G. 1999. A new form of filgrastim with sustained duration in vivo and enhanced ability to mobilize PBPC in both mice and humans. Exp Hematol 27:1724–1734 [DOI] [PubMed] [Google Scholar]
- 18.Owens MA, Vall HG, Hurley AA, Wormsley SB. 2000. Validation and quality control of immunophenotyping in clinical flow cytometry. J Immunol Methods 243:33–50 [DOI] [PubMed] [Google Scholar]
- 19.Parham DM, Ready R, Stine K, Quiggins C, Becton D, North P. 2002. Comparison of manual and automated leukocyte count for determination of the absolute neutrophil count: application to a pediatric oncology clinic. Med Pediatr Oncol 38:183–186 [DOI] [PubMed] [Google Scholar]
- 20.Petersen PH, Stöckl D, Blaabjerg O, Pedersen B, Birkemose E, Thienpont L, Lassen JF, Kjeldsen J. 1997. Graphical interpretation of analytical data from comparison of a field method with a reference method by use of difference plots. Clin Chem 43:2039–2046 [PubMed] [Google Scholar]
- 21.Ross DW, McMaster K. 1983. Neutropenia: the accuracy and precision of the neutrophil count in leukopenic patients. Cytometry 3:287–291 [DOI] [PubMed] [Google Scholar]
- 22.Ruzicka K, Veitl M, Thalhammer-Scherrer R, Schwarzinger I. 2001. The new hematology analyzer Sysmex XE2100. Arch Pathol Lab Med 125:391–396 [DOI] [PubMed] [Google Scholar]
- 23.Saad A, Palm M, Widell S, Reiland S. 2000. Differential analysis of rat bone marrow by flow cytometry. Comp Haematol Int 10:97–101 [Google Scholar]
- 24.Smith GC, Hall RL, Walker RM. 2002. Applied clinical pathology in preclinical toxicology testing, p 123–156. In: Haschek WM, Rousseaux CG, Wallig MA. Handbook of toxicologic pathology. 2nd ed London (UK): Academic Press [Google Scholar]
- 25.Stewart CC, Stewart SJ. 2001. Cell preparation for the identification of leukocytes, p 207– 251. In: Darzynkiewicz Z, Crissman HA, Robinson JP. Methods in cell biology. vol 63, 3rd ed London (UK): Academic Press; [DOI] [PubMed] [Google Scholar]
- 26.Suzuki S, Eguchi N. 1999. Leukocyte differential analysis in multiple laboratory species by a laser multiangle polarized light scattering separation method. Exp Anim 48:107–114 [DOI] [PubMed] [Google Scholar]
- 27.Tarrant JM. 2005. The role of flow cytometry in companion animal diagnostic medicine. Vet J 170:278–288 [DOI] [PubMed] [Google Scholar]
- 28.Walters J, Garrity P. 2000. Performance evaluation of the Sysmex XE2100 hematology analyzer. Lab Hematol 6:83–92 [Google Scholar]
- 29.Weiser MG. 1987. Modification and evaluation of a multichannel blood cell counting system for blood analysis in veterinary haematology. J Am Vet Med Assoc 190:411–415 [PubMed] [Google Scholar]
- 30.Weiss DJ. 2002. Application of flow cytometric techniques to veterinary clinical hematology. Vet Clin Pathol 31:72–82 [DOI] [PubMed] [Google Scholar]
- 31.Westgard JO. 1998. Points of care in using statistics in method comparison studies. Clin Chem 44:2240–2242 [PubMed] [Google Scholar]


