

Recent developments in micro/nano-scale technology have enabled the generation of extracellular matrix (ECM) protein microarrays with well-defined geometries. These patterned surfaces have shown utility for the study and control of a variety of cellular behaviors.[1–7] In particular, the patterning of proteins with feature sizes smaller than a single cell have demonstrated potential application for use as tools to control cellular activity.[4, 8] To date, most research has been limited to studies with single protein factors due to technical limitations of existing printing methods. Herein, we describe the development of a microscale direct writing (MDW) technology for the generation of complex ECM protein arrays at subcellular feature size with multiple components. Automated printing techniques based on atomic force microscopy were developed to allow programmable generation of cell-compatible surfaces with multiple ECM proteins, at a subcellular feature size of 6–9 microns. Cell-compatible, two component ECM protein arrays were systematically generated with varying spacing and composition. These arrays were then studied for their effects on cellular attachment and spreading of a model cell line, human myofibroblasts. Interestingly, the precise tuning of spacing and placement two components at subcellular resolution can lead to an increase in cellular alignment. Given the complexity of the in vivo cellular microenvironment, we believe the MDW methods described here could prove generally applicable for the study and optimization of biomaterial surfaces.
Protein arrays with defined chemical composition and spatial resolution have potential for use in a variety of biomedical and biotechnological applications.[9–11] Recent studies have shown that the ability to control cell adhesion and spreading with well-defined ECM protein patterns at microscale resolution can effect a number of cell behaviors, including division, migration, apoptosis and differentiation. [1–7] A number of methods for creating protein patterns have been developed, including inkjet printing,[12, 13] and Dip-Pen Nanolithography (DPN),[14] and most commonly, microconatct printing (μcp).[15–17] The first step of μcp is generally the creation of a master or stamp in PDMS. The stamp is then used to generate protein patterns by direct contact with a given substrate. During the direct contact (printing) process, all of the features in the master pattern are transferred at one time. However, to generate complex patterns with multiple components, additional printing steps are required, and these must be properly aligned with the existing pattern from the previous printing. The micron-scale alignment necessary to make high resolution features from separate components is challenging, in particular when the number of components is greater than two. [18–20] Alternatively, methods that directly write proteins onto surfaces in the serial manner, such as MDW, inkjet printing and DPN, allow for straightforward alignment and the facile generation of the multiple components protein arrays.[21, 22]
Inkjet printing, MDW and DPN share some common features as direct writing technologies. However, the feature sizes of the protein patterns produced by different writing techniques vary by orders of magnitude. For example, ink jet printing typically give rise to protein patterns with the feature sizes more than 100 μm, while protein arrays with the feature size as small as 50 nm have been prepared by DPN.[12, 22] While DPN has the potential to generate very small resolution protein features, throughput is limited, in particular when the design requires complex, non-repeating patterns, multiple inks, and micro-milimeter scale.[23] We have developed MDW for the facile generation of the multiple components protein arrays with the feature size between 1 to 10 μm.
Atomic force microscopy (AFM) allows for the visualization and manipulation of nanoscale objects by direct or indirect contact.[24] We hypothesized that this technology could be developed into a platform for the generation of multi-protein, cell-compatible microenvironments. Here, we used a cantilever-based surface patterning tools (SPT) to generate micrometer scale patterns in a serial manner (Supplemental Information).[25] We reasoned that AFM-based printing could have several potential advantages over soft lithography methods for this application. First, the movement of the AFM stage is precisely controlled allowing the writing procedure to be programmed, thereby alleviating challenges with alignment at micron scale. Since the spatial position of each movement is saved in the computer, alignment of multiple printing steps becomes straightforward. Second, the serial nature of the process permits fine-tuning and printing quality control during printing. As proof of principle of the alignment advantages of MDW, we prepared a four component microarray with 25 micrometer spot to spot resolution, and a spot size of ~ 5 microns (Figure 1). Alignment of these letters was achieved by computer control, demonstrating the potential for complex patterns with micron spot size – a process that would be challenging using traditional μcp methods.
Figure 1.
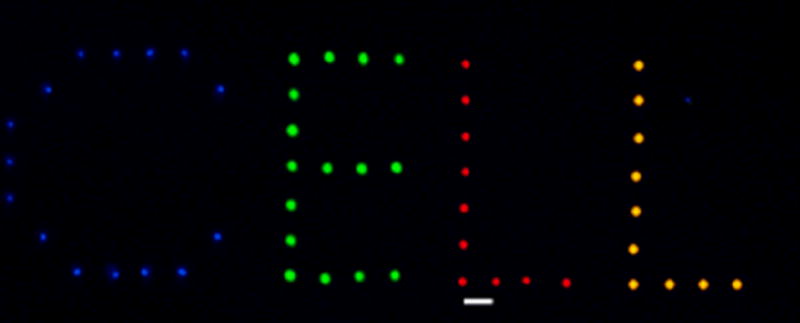
A multiple components microarray has been prepared by MDW with four different dyes: DAPI, FITC-BSA, Alexa-546 fibrinogen, and Alexa-647 fibrinogen, and the scale bar represents 25 μm.
First, to explore the potential of these printing methods, we generated complex two protein arrays with a range of patterns and spacing as shown in Figure 2. Mini-arrays with five different protein compositions (100:0, 75:25, 50:50, 25:75, 0:100; the number of red fluorescence spots: the number of green fluorescence spots) form a protein composition gradient in the vertical direction of the array. In the horizontal direction, the distance between the centers of the neighboring spots in each mini-array varied from 18 to 42 μm in 6 μm increments. These spacing intervals were chosen based upon literature reports that the distance of 25 μm between FN spots, which have a diameter of 3 μm, is critical for the spreading of mouse B16F1 melanoma cells.[26] This protein ratio and spot spacing yielded protein arrays composed of 25 different combinations of mini-arrays. Red fluorescence (Alexa-546) labeled fibrinogen and green fluorescence (FITC) labeled BSA were chosen as model proteins to be arrayed on the surface.
Figure 2.

Fluorescence image of two component protein arrays composed of 25 different combinations of mini-arrays, one of which is demarcated with a white square. Red spots are Alexa-546 labeled fibrinogen and green spots are FITC-labeled BSA. The numbers at the top of the image represent the distance between spots and number on the left of the image are the ratio of red spots to green spot.
Of note, 16,800 spots are present in the pattern shown in the Figure 2. Effective, error-free printing of this many spots required control of a number of parameters. First, humidity control during arraying was important -- low humidity during the writing process resulted in the rapid evaporation of the writing solution, and too high humidity resulted in excessively large protein spots. For example, 40% humidity was determined to be optimal for arraying fibronectin (FN) while 70% humidity is necessary for arraying laminin (LN). These differences in the optimal humidity may be attributed to the specific composition of the protein buffer. Second, the surface chemistry of the substrates was a critical factor in the writing process. Hydrophobic octyltrichlorosilane (OTS) treated glass surface was required both for the generation of small protein spots and the post printing coating with Ethylene Oxide/Propylene Oxide Block Copolymer (Pluronic F108) to control cell adhesion.
The sizes of the spots could be varied using cantilevers of different width (10 μm or 30 μm) or by adjusting writing parameters mentioned above (e.g., humidity, surface chemistry of the substrate, etc.--data not shown). In this work, the size (diameter) of spots in the array was about 6–9 μm, which is slightly bigger than the size of a focal adhesion site, and smaller than the size of these adherent cells, which are usually in the range of 20–50 μm.[27, 28] The area of each mini-array was 480 μm × 480 μm, a dimension chosen to have a statistically relevant number of cells attached to each mini-array.
One method of spatially controlling cell adhesion to patterned proteins is by first printing the proteins, and then blocking the surrounding areas with Pluronic F108.[29]. Chen and coworkers have demonstrated that this method is applicable to many common culture substrates by simply tuning their hydrophobicity.[29] We adapted this technique for use with MDW. In brief, protein arrays were prepared on octyltrichlorosilane treated glass slides. Their hydrophobic surface (WCA ≈ 90°) permit the physical adsorption of Pluronic surfactants and strong binding with ECM proteins such as fibronectin, enabling the generation of high quality protein arrays.[30] The slides were washed with PBS, and incubated in 0.5% (w/v) Pluronic F108 solution to inhibit unspecific cell attachment.
To assess the utility of these MDW-generated arrays in the study of cell adhesion studies, we first examined a single component protein (FN) array, in which the effects of spacing between neighboring protein spots on cell adhesion and spreading could be compared with the existing literature on single protein, FN arrays. FN was arrayed in the positions occupied by the red fluorescence protein spots in Figure 2, thereby resulting in 19 different mini-arrays, each with different spot spacing. Figure 3a shows fluorescence images of a model cell line, C2C12 myoblasts, on the FN array after incubation for 3 hr, which was the minimum time necessary to obtain good cell spreading. Cells were stained with DAPI as a nuclear counter stain and Phalloidin as an actin stain to determine the number of cells per unit area, their shape (size), respectively. Qualitative cell response in this image can be directly correlated to the red protein spots in the mini-array shown in Figure 2. It is apparent that cells have taken a spread-out morphology in the mini-array where the space between protein spots is close (i.e., 18 and 24 μm), while cells adopt a spherical shape when the space between protein spots is further away (i.e., 42 μm). Differences in cell spreading and morphology are evident in the enlarged fluorescence images (Figure 3b, 3c).
Figure 3.

C2C12 myoblast adhesion and spreading on protein arrays with different spot spacing. A) Collage of fluorescence images of C2C12 adhesion on FN arrays after 3 hr of incubation. B,C) Enlarged images of the red squares shown in Figure 3a. D) Correlation between FN surface coverage and cell density (black) or cell spreading (green). The scale bars in the Figure 3b and 3c represent 20 μm.
These results were subsequently quantified via laser scanning cytometry and automated image analysis.[31] The goal was to determine cell density and cell spreading as a function of distance between protein spots. The metric for cell spreading was the average green fluorescence (actin) intensity per mini-array and that for cell density was the average blue fluorescence (nuclei) intensity per mini-array. As mentioned earlier, previous investigators have studied the effects of micro-patterned FN spots on spreading of mouse B16F1 melanoma cells, and their data have shown that the surface coverage of the FN spots rather than the geometry of the FN spots is critical for cell spreading.[26] The surface coverage of the FN spots was plotted against green/blue fluoresce intensity (Figure 3d). These results show that 10% or greater FN coverage is necessary for maximum cell adhesion and spreading, which corresponds to 26 μm spacing between the centers of neighboring FN spots. Given that the size of each FN spot is about 9 μm, this leads to a spacing of about 17 μm between the edges of the FN spots. These data are similar to that observed by previous investigators who reported that 15% FN surface coverage is critical for optimal cell spreading[26].
One potential advantage of the MDW methods developed here over conventional micro-contact printing is in its ability to generate multiple component protein arrays. We generated two component protein arrays to examine the behavior of cells in more complex two-dimensional environments (Figure 4). A mixture of laminin (LN) and collagen (COL) IV (under the commercial name human ECM from BD bioscience) was chosen as the second component for our ECM protein array. The adhesive properties of LN/COL mixture are sufficiently different from FN to allow for differences in cell adhesion and spreading on the protein array to be observed. Two component (FN/(LN/COL)) gradients were prepared with 18 μm spacing between the centers of neighboring protein spots, based upon our prior result that a spacing of less then 26 μm is critical to obtain good cell spreading. As shown in Figure 4a, good cell adhesion and spreading were found at FN rich mini-arrays (FN: LN/COL = 100:0, 75:25, 50:50) while poor cell adhesion and spreading were observed in the pure LN/COL mini-array. Interestingly, aligned cells were found in the mini-array at the ratio of FN to LN/COL equal to 25:75 (Figure 4a,b). Notably, the distances between the virtual lines formed by aligned cells are in quantitative agreement with the distances between virtual lines of FN spots (18 μm). Poor cell spreading was found at the same configuration without LN/COL since the distance between centers of FN posts is 36 μm, which is significantly larger than the critical spacing for cell spreading (26 μm). The presence of the weaker cell adhesive protein (LN/COL) spots seems to serve as bridges, and this permits cell spreading between FN spots. To further evaluate the capacity of LN/COL to bridge the neighboring FN spots, the LN/COL was arrayed with FN at 24 μm spacing between neighboring protein spots. LN/COL spots were found to facilitate spreading of lamellipodia (Figure 4c), but they are not able to induce the cell spreading between FN spots. This indicates that the cell adhesion strength of the ECM protein is another parameter to determine the cell spreading in addition to spacing between protein spots.
Figure 4.
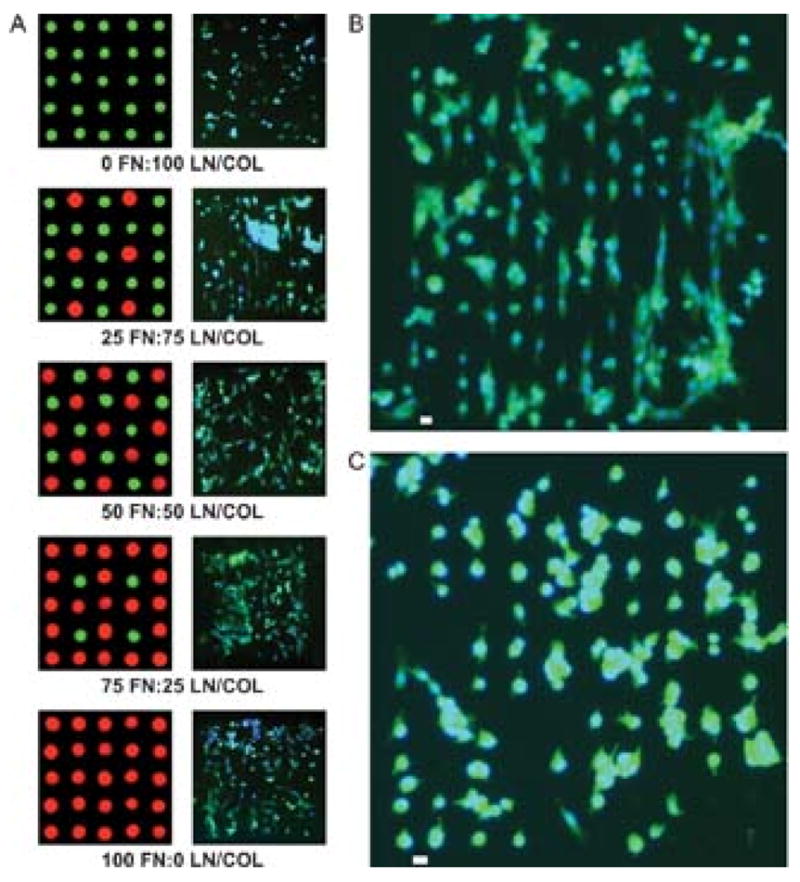
C2C12 myoblast adhesion and spreading on two component protein arrays. A) Fluorescence images of cell adhesion and spreading on the composition gradient of fibronectin (FN) and lamnin/collagen (LN/COL). B) Fluorescence image of aligned cell adhesion on the protein array with a composition of 25/75 (FN/(LN/COL) and a spacing of 18 μm. C) Fluorescence image of cell adhesion on protein array with a composition of 25/75 (FN/(LN/COL) and a spot spacing of 24 μm. The scale bars in the Figure 4b and 4c represent 20 μm.
Interestingly, cell alignment was unexpectedly found when two ECM proteins (FN/(LN/COL)) with different cell adhesion capacities were arrayed in a specific pattern. Using previously published methods[32] the percentage of cells aligned was quantified by measuring the angle between the long axis of the cells and the microarray. -- Cells were considered aligned if the angle was less than 15°.[32] The alignment of cells on the mini-array composed of FN/(LN/COL) as shown in Figure 4b is 80±5%. In contrast, cells on other patterns such as the mini-arrays, in which the ratio between FN and LN/COL equals 50:50, assembled in an unaligned fashion. While it is unclear why this particular combination of ECM proteins in this pattern result in increased cellular alignment, we believe the ability to align cells by altering the composition of their substrates may have utility in the formation of organized cellular constructs.
In vivo, the interaction between cells and surrounding environment is typically mediated by the binding of transmembrane proteins called integrins to ECM proteins, and followed by the lateral aggregation of receptors at these contact sites.[33] These cell/matrix adhesion sites cause the recruitment of specific molecules linking the actin cytoskeleton via integrins to the ECM, and thus dictate the size and shape of the cell, as well as affecting gene expression.[5, 8, 34] Notably, the sizes of the cell-ECM protein adhesion sites such as “classical” focal adhesion usually vary in the range of 1 to 10 μm.[28] Different ECM proteins can affect cells differently, in part due to the specificity of certain integrins. For example, FN usually binds to integrin α5β1 while laminin preferably binds to integrin α1β1. [33] Therefore, in order to better study and optimize cell-surface interactions, it is necessary to develop methods that enable the generation of protein arrays composed of multiple ECM proteins at subcellular scale. Here we have demonstrated the utility of MDW techniques for the creation of subcellular protein arrays to control cell adhesion and spreading. To our knowledge, this is the first time an ECM protein array with more than one factor has been generated at subcellular feature resolution. We expect that complex, multi-component protein arrays will have increasing utility in the study and manipulation of cell behavior and differentiation. [11]
Experimental Section
Materials
Alexa Fluor 546 and Alexa Fluor 647 conjugated fibrinogen was obtained from Invitrogen. 4′,6-Diamidino-2-phenyindole, dilactate (DAPI), fluorescein (FITC) conjugated albumin from bovine serum (BSA) and fibronectin were purchased from Sigma, and human ECM was obtained from BD Bioscience. Octyltrichlorosilane (OTS) was purchased from Gelest, Inc.
Array Generation
The protein arrays were generated with an AFM based microfluidic patterning tool, NanoeNabler (Bioforce Nanoscience). 0.9 μl of protein solution (0.5mg/ml in protein spotting buffer [gift from Bioforce nanoscience]) was loaded into the reservoir of the SPT (SPT-S-C30), and arrayed on the octyltrichlorosilane (OTS) treated glass slides with a water contact angle about 90°. Approximately 134 femtoliter of protein solution was deposited each time during the arraying. The complex micro-patterns composed of multiple components were prepared by multiple-arraying procedures after carefully alignment with the existing array. The surfaces were then air dried for 30 min in a tissue culture hood, and washed twice with phosphate- buffered saline (PBS) for 10 min. Subsequently, the substrate was immersed in 0.5% (w/v) Pluronic (F108 [gift from BASF, Mount Olive, NJ]) in PBS for 1 h, and carefully rinsed with PBS and cell culture medium for three times without allowing the surface to dry. The substrates were then ready for cell seeding.
Cell culture and plating
C2C12 myoblasts were maintained for less than 10 passages in Dulbecco’s Modified Eagle’s Medium (DMEM) supplemented with 10% (v/v) fetal bovine serum (FBS), 100 units/mL penicillin, and 100 mg/mL streptomycin (all from Invitrogen, Carlsbad, CA). For the experiments, cells were treated as for passaging, resuspended in growth medium, and plated on patterned glass slides with a seeding density of 800,000 cells/ml. The cells were incubated on the surfaces for 3 hours at 37 °C and at 5% CO2, during which time they attached to the patterns and spread. Cells were then fixed and permeablized with 0.1% Triton X-100.
Immunofluorescece and microscopy
Cells were stained with phalloidin (Sigma) conjugated with fluorescein isothiocyanate (FITC) dye. The phalloidin (50 μg/mL) dissolved in DMSO was added to the fixed cells and then incubated for 40 minutes at room temperature. After washing three times with PBS, the cells were imaged using a Zeiss fluorescence microscope (Axioplan).
Some of the fluorescence images were taken and quantified with an iCys laser scanning cytometry (Compucyte, Cambridge, MA). The fluorescence signal of the stained cells was used to identify the locations of the mini-arrays in the glass slide. The fluorescence intensity at two different wavelengths (405 and 488 nm) was used to quantify the cell number and cell spreading in each mini-array, respectively.
Acknowledgments
We gratefully acknowledge Jim Johnson and Gabor Bethlendy from Bioforce Nanoscience for expert help and advice on NanoeNabler instrument. We also thank Ed Luther for the help with the laser scanning cytometry. Funding was kindly provided by Mitsubishi Chemical Company and NIH grant R01 DE016516-03.
Footnotes
Supporting Information is available on the WWW under http://www.small-journal.com or from the author.
Contributor Information
Dr. Ying Mei, Department of Chemical Engineering, Massachusetts Institute of Technology, 77 Massachusetts Avenue, Cambridge, MA 02139 (USA)
Dr. Christopher Cannizzaro, Health Science and Technology, Massachusetts Institute of Technology, 77 Massachusetts Avenue, Cambridge, MA 02139 (USA)
Dr. Hyoungshin Park, Department of Surgery, Massachusetts General Hospital, One Bowdoin Square, 11th floor, Boston, MA 02114 (USA)
Dr. Qiaobing Xu, Department of Chemical Engineering, Massachusetts Institute of Technology, 77 Massachusetts Avenue, Cambridge, MA 02139 (USA)
Said Bogatyrev, Department of Chemical Engineering, Massachusetts Institute of Technology, 77 Massachusetts Avenue, Cambridge, MA 02139 (USA).
Kevin Yi, Department of Chemical Engineering, Massachusetts Institute of Technology, 77 Massachusetts Avenue, Cambridge, MA 02139 (USA).
Nathan Goldman, Department of Chemical Engineering, Massachusetts Institute of Technology, 77 Massachusetts Avenue, Cambridge, MA 02139 (USA).
Prof. Robert Langer, Department of Chemical Engineering, Massachusetts Institute of Technology, 77 Massachusetts Avenue, Cambridge, MA 02139 (USA)
Dr. Daniel G. Anderson, David H. Koch Institute for Integrative Cancer Research, Massachusetts Institute of Technology, 45 Carleton Street, Building E25-342, Cambridge, Massachusetts 02142 (USA), E-mail: dgander@mit.edu
References
- 1.Kumar G, Ho CC, Co CC. Adv Mater. 2007;19:1084. [Google Scholar]
- 2.Thery M, Racine V, Pepin A, Piel M, Chen Y, Sibarita JB, Bornens M. Nat Cell Biol. 2005;7:947. doi: 10.1038/ncb1307. [DOI] [PubMed] [Google Scholar]
- 3.Kandere-Grzybowska K, Campbell CJ, Mahmud G, Komarova Y, Soh S, Grzybowski BA. Soft Matter. 2007;3:672. doi: 10.1039/b617308j. [DOI] [PubMed] [Google Scholar]
- 4.Chen CS, Mrksich M, Huang S, Whitesides GM, Ingber DE. Science. 1997;276:1425. doi: 10.1126/science.276.5317.1425. [DOI] [PubMed] [Google Scholar]
- 5.McBeath R, Pirone DM, Nelson CM, Bhadriraju K, Chen CS. Dev Cell. 2004;6:483. doi: 10.1016/s1534-5807(04)00075-9. [DOI] [PubMed] [Google Scholar]
- 6.Nelson CM, Jean RP, Tan JL, Liu WF, Sniadecki NJ, Spector AA, Chen CS. Proc Natl Acad Sci U S A. 2005;102:11594. doi: 10.1073/pnas.0502575102. [DOI] [PMC free article] [PubMed] [Google Scholar]
- 7.Jiang XY, Bruzewicz DA, Wong AP, Piel M, Whitesides GM. Proc Natl Acad Sci U S A. 2005;102:975. doi: 10.1073/pnas.0408954102. [DOI] [PMC free article] [PubMed] [Google Scholar]
- 8.Chen CS, Alonso JL, Ostuni E, Whitesides GM, Ingber DE. Biochem Biophys Res Commun. 2003;307:355. doi: 10.1016/s0006-291x(03)01165-3. [DOI] [PubMed] [Google Scholar]
- 9.Langer R, Tirrell DA. Nature. 2004;428:487. doi: 10.1038/nature02388. [DOI] [PubMed] [Google Scholar]
- 10.Mitchell P. Nat Biotechnol. 2002;20:225. doi: 10.1038/nbt0302-225. [DOI] [PubMed] [Google Scholar]
- 11.Flaim CJ, Chien S, Bhatia SN. Nat Methods. 2005;2:119. doi: 10.1038/nmeth736. [DOI] [PubMed] [Google Scholar]
- 12.Roth EA, Xu T, Das M, Gregory C, Hickman JJ, Boland T. Biomaterials. 2004;25:3707. doi: 10.1016/j.biomaterials.2003.10.052. [DOI] [PubMed] [Google Scholar]
- 13.Turcu F, Tratsk-Nitz K, Thanos S, Schuhmann W, Hieduschka P. J Neurosci Methods. 2003;131:141. doi: 10.1016/j.jneumeth.2003.08.001. [DOI] [PubMed] [Google Scholar]
- 14.Ginger DS, Zhang H, Mirkin CA. Angew Chem Int Ed. 2004;43:30. doi: 10.1002/anie.200300608. [DOI] [PubMed] [Google Scholar]
- 15.Kane RS, Takayama S, Ostuni E, Ingber DE, Whitesides GM. Biomaterials. 1999;20:2363. doi: 10.1016/s0142-9612(99)00165-9. [DOI] [PubMed] [Google Scholar]
- 16.Ruiz SA, Chen CS. Soft Matter. 2007;3:168. doi: 10.1039/b613349e. [DOI] [PubMed] [Google Scholar]
- 17.Xia YN, Whitesides GM. Angew Chem Int Ed. 1998;37:551. doi: 10.1002/(SICI)1521-3773(19980316)37:5<550::AID-ANIE550>3.0.CO;2-G. [DOI] [PubMed] [Google Scholar]
- 18.Tien J, Nelson CM, Chen CS. Proc Natl Acad Sci U S A. 2002;99:1758. doi: 10.1073/pnas.042493399. [DOI] [PMC free article] [PubMed] [Google Scholar]
- 19.Renault JP, Bernard A, Juncker D, Michel B, Bosshard HR, Delamarche E. Angew Chem Int Ed. 2002;41:2320. doi: 10.1002/1521-3773(20020703)41:13<2320::AID-ANIE2320>3.0.CO;2-Z. [DOI] [PubMed] [Google Scholar]
- 20.Coyer SR, Garcia AJ, Delamarche E. Angew Chem Int Ed. 2007;46:6837. doi: 10.1002/anie.200700989. [DOI] [PubMed] [Google Scholar]
- 21.Lee KB, Lim JH, Mirkin CA. J Am Chem Soc. 2003;125:5588. doi: 10.1021/ja034236p. [DOI] [PubMed] [Google Scholar]
- 22.Lim JH, Ginger DS, Lee KB, Heo J, Nam JM, Mirkin CA. Angew Chem Int Ed. 2003;42:2309. doi: 10.1002/anie.200351256. [DOI] [PubMed] [Google Scholar]
- 23.Mirkin CA. Acs Nano. 2007;1:79. doi: 10.1021/nn700228m. [DOI] [PubMed] [Google Scholar]
- 24.Humphris ADL, Miles MJ, Hobbs JK. Appl Phys Lett. 2005:86. [Google Scholar]
- 25.Xu JT, Lynch M, Huff JL, Mosher C, Vengasandra S, Ding GF, Henderson E. Biomed Microdevices. 2004;6:117. doi: 10.1023/b:bmmd.0000031748.13353.10. [DOI] [PubMed] [Google Scholar]
- 26.Lehnert D, Wehrle-Haller B, David C, Weiland U, Ballestrem C, Imhof BA, Bastmeyer M. J Cell Sci. 2004;117:41. doi: 10.1242/jcs.00836. [DOI] [PubMed] [Google Scholar]
- 27.Goffin JM, Pittet P, Csucs G, Lussi JW, Meister JJ, Hinz B. J Cell Biol. 2006;172:259. doi: 10.1083/jcb.200506179. [DOI] [PMC free article] [PubMed] [Google Scholar]
- 28.Geiger B, Bershadsky A, Pankov R, Yamada KM. Nat Rev Mol Cell Biol. 2001;2:793. doi: 10.1038/35099066. [DOI] [PubMed] [Google Scholar]
- 29.Tan JL, Liu W, Nelson CM, Raghavan S, Chen CS. Tissue Eng. 2004;10:865. doi: 10.1089/1076327041348365. [DOI] [PubMed] [Google Scholar]
- 30.Mei Y, Elliott JT, Smith JR, Langenbach KJ, Wu T, Xu C, Beers KL, Amis EJ, Henderson L. J Biomed Mater Res, Part A. 2006;79A:974. doi: 10.1002/jbm.a.30883. [DOI] [PubMed] [Google Scholar]
- 31.Luther E, Kamentsky L, Henriksen M, Holden E. New Developments. 4. Vol. 75. 2004. Cytometry; p. 185. [Google Scholar]
- 32.Yim EKF, Reano RM, Pang SW, Yee AF, Chen CS, Leong KW. Biomaterials. 2005;26:5405. doi: 10.1016/j.biomaterials.2005.01.058. [DOI] [PMC free article] [PubMed] [Google Scholar]
- 33.Alberts B. Molecular biology of the cell. Garland Science; New York: 2002. [Google Scholar]
- 34.Gallant ND, Capadona JR, Frazier AB, Collard DM, Garcia AJ. Langmuir. 2002;18:5579. [Google Scholar]