Abstract
Hip dysplasia is a common inherited trait of dogs that results in secondary osteoarthritis. In this article the methods used to uncover the mutations contributing to this condition are reviewed, beginning with hip phenotyping. Coarse, genome-wide, microsatellite-based screens of pedigrees of greyhounds and dysplastic Labrador retrievers were used to identify linked quantitative trait loci (QTL). Fine-mapping across two chromosomes (CFA11 and 29) was employed using single nucleotide polymorphism (SNP) genotyping. Power analyses and preferential selection of dogs for ongoing SNP-based genotyping is described with the aim of refining the QTL intervals to 1–2 megabases on these and several additional chromosomes prior to candidate gene screening. The review considers how a mutation or a genetic marker such as a SNP or haplotype of SNPs might be combined with pedigree and phenotype information to create a ‘breeding value’ that could improve the accuracy of predicting a dog’s hip conformation.
Keywords: Canine hip dysplasia, Genome wide screen, Microsatellites, Single nucleotide polymorphisms (SNP), Breeding values
Introduction
Canine hip dysplasia (CHD) is a common inherited orthopedic trait. This joint malformation (dysplasia) results in instability and subluxation of the hip which ultimately causes erosion of the articular cartilage and synovitis. This secondary osteoarthritis (OA) precipitates the clinical signs of lameness. The disease affects dogs of all breeds with different prevalence. Breed occurrence, as estimated by the Orthopedic Foundation for Animals (OFA), varies widely from 1–75%1.
For many years, veterinarians have relied on a phenotypic assessment of the hips of dogs based on radiography (Lust et al., 1997). This method of diagnosis can be combined with a clinical examination to make treatment decisions but is not a reliable method for eliminating affected dogs from a breed or for selecting dogs with the most resistant genetic composition for breeding because hip dysplasia is a complex or quantitative trait. A quantitative trait locus (QTL) is a region on a chromosome that contains a gene or group of genes that influences the phenotypic expression of a quantitative trait like hip dysplasia. Particular alleles in sufficient number have to be encoded in a dog’s DNA and expressed during hip development to produce resistance or susceptibility to the trait. Environmental or non-genetic factors then exert their influence to maximize or minimize the phenotypic expression of the trait, as observed in pelvic radiographs in the case of hip dysplasia.
A phenotypically normal dog can carry mutations that influence trait expression. Two approaches to the screening for, and diagnosis of, CHD have evolved over the last 15–20 years, namely, radiographic detection through the development of novel imaging techniques, and genetic mapping experiments. For a complex trait like CHD, objective hip measurements are usually correlated with each other at the phenotypic level (Lust et al., 2001a; Farese et al., 1998; Puerto et al., 1999; Todhunter et al., 2003c). Studies have indicated that the estimates of heritabilities and breeding values (BVs) derived from a multiple-trait model, which incorporated both genetic and environmental correlations, would be more accurate than if estimates were derived from a single trait (Jiang and Zeng, 1995; Sapp et al., 2005). More importantly, the genetic parameters estimated from a multiple-trait model provide the essential parameters to derive a selection index that integrates the BVs of all the traits (Ohlerth et al., 2001). Genetic mapping is the process of locating a region on a chromosome that harbors a genetic locus that contributes to, or causes, an inherited trait. Subsequent studies aim to discover the contributing mutations within those chromosomal regions.
The concept is to find the genes that contribute to hip dysplasia and to use molecular markers near these contributing genes or the genetic mutations themselves to identify susceptible or resistant dogs. This information is then used in conjunction with radiographic hip screening on a pedigree to derive BVs that could be applied in breeding programs or registries to reduce the incidence of the trait. These BVs and genetic marker information could be used by purchasers of purebred puppies to assess the potential orthopedic health of the animal. Genetic marker information would be particularly helpful in this context as the purchaser would have no information on the offspring of that individual.
This paper reviews recent developments in CHD genetic locus mapping and assesses how phenotypic and genotypic information can be used to reduce the incidence of this condition.
Canine hip dysplasia phenotype
Radiology has commonly been used to diagnose CHD. The technique has been standardized worldwide, although there is some variation in radiograph evaluation (Flückiger, 2007). There are three (somewhat different) international scoring methods: the Fédération Cynologique Internationale (FCI), the OFA, and the British Veterinary Association/Kennel Club (BVA/KC) methods. The FCI scoring method is used in most mainland European countries, Russia, South America, and Asia. The OFA approach is used exclusively in the USA and Canada, and the BVA/KC method is used in Britain, Ireland, Australia and New Zealand. Details of each scoring method are described by Flückiger (2007).
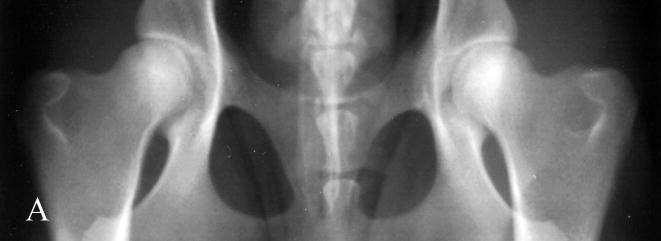
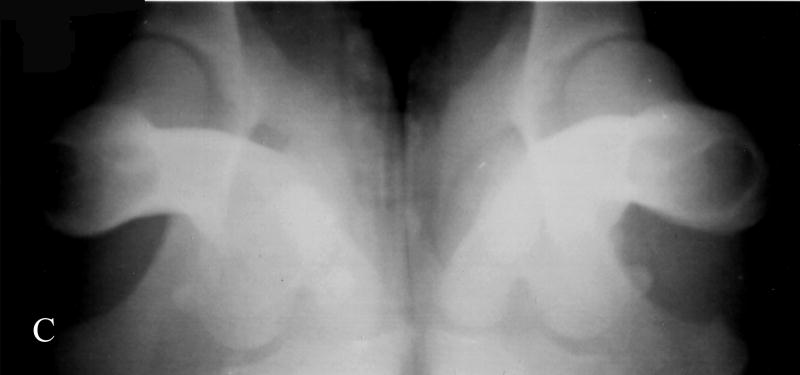
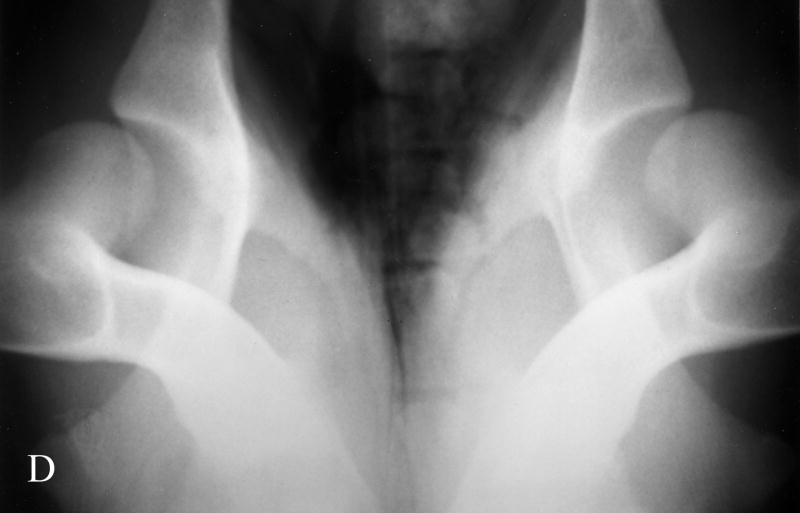
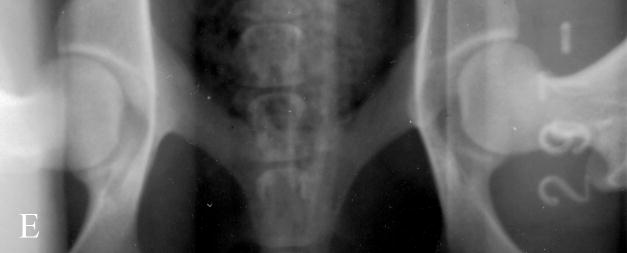
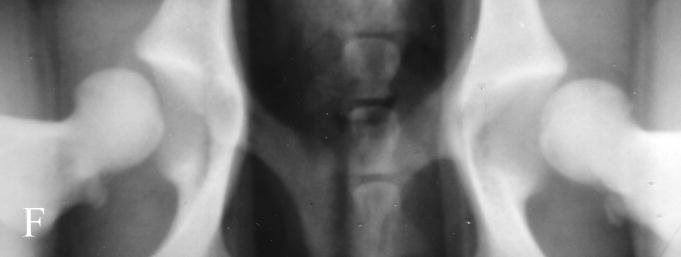
The North American method of assessing hip conformation is the extended hip radiographic score of ‘excellent’, ‘good’, and ‘fair’ with ‘borderline’, ‘mild’, ‘moderate’ and ‘severe’ hip dysplasia as developed by the OFA and is one of the methods used in our studies (Fig. 1). The Norberg angle (NA) (Gustafsson et al., 1975) is measured from the ventrodorsal, extended-hip radiograph and ranges from 50° (a subluxated hip) to 123° (a phenotypically unaffected hip) in our database. The maximum amount of lateral hip laxity is measured as the distraction index (DI) on a radiograph taken in the distraction position (PennHIP) (Smith et al., 1997). Labrador retrievers with DIs <0.4 at 8 months of age have a >80% probability of not developing secondary hip OA (i.e. were unaffected with hip dysplasia). Those retrievers with DIs >0.7 had a high probability of developing hip OA (Lust et al., 1993). The PennHIP scheme also requests submission of a ventrodorsal extended-hip radiograph used to assess hip conformation and the presence or absence of secondary OA. In the absence of trauma, the presence of secondary hip OA is considered the ‘prior footprint’ of CHD. The dorsolateral subluxation (DLS) score is the percentage of the femoral head covered by the dorsal acetabulum with the hips in a natural weight-bearing position (Farese et al., 1998; Burton-Wurster et al., 1999; Lust et al., 2001a; Lust et al., 2001b). This score ranges from 85% for tight-hipped greyhounds in our database to 21% for the most dysplastic dogs. Both the DI and the DLS scores are repeatable (Farese et al., 1998; Smith et al., 1997).
Fig. 1.
Photographs of hip radiographs illustrating: (A) the extended hips of a normal Labrador retriever used to derive the extended-hip (OFA) radiographic score and to measure the Norberg angle; (B) The hips of a Labrador retriever with dysplasia taken in the same position; (C) greyhound hips with excellent conformity used to measure the dorsolateral subluxation score; (D) hips of a Labrador retriever with dysplasia in a similar position to (C) with subluxation of the femoral head from the medial acetabular wall; (E) the ‘tight’ hip of a greyhound taken in the distraction position to measure the maximum distraction laxity as the distraction index (DI); (F) a ‘loose-hipped’ Labrador retriever in the distraction position.
Additionally, for a group of Labrador retrievers, greyhounds, and their crossbred offspring, reared in a controlled environment, the DLS score and Norberg angle together better predicted whether an affected hip would develop OA at early maturity than did the DLS or DI score or the NA in isolation (Todhunter et al., 2003b). Although these three radiographic measurements are highly correlated (Farese et al., 1999; Lust et al., 2001a; Todhunter et al., 2003b), no one of them exactly represents the other two. One way of integrating these traits measured on the left and right sides was to derive their Principal Components (PC). For the eight measurements (four traits on both hips of each dog), there could be eight PCs at most. However, the first PC usually contains the most information by explaining the greatest amount of variation. Another important feature of PCs is the lack of correlation between them. The second PC is orthogonal to the first and defines the next largest amount of variation and is independent of the first PC.
For a subset of 850 dogs in the Cornell hip dysplasia archive, the first four PCs calculated from the eight measurements (OFA score, the DI, the DLS score, and the NA measures of left and right hips) explained 50%, 16%, 15% and 11% (92% total) of the total variation in the CHD phenotype, respectively. The highest correlation was between the DI and DLS score (50%). The second highest degree of correlation was between the NA and OFA score. The first PC was the linear combination of all the left and right hip traits in the direction of unaffected hips. Thus these hip traits taken together describe what contributes to good hip conformation. The second PC was composed of the DI and the DLS score (most correlated trait for unaffected hips), along with the NA and the OFA score (most correlated trait for affected hips). This PC combines information about the tightness of the hip as represented by the DI and the DLS score with information about dysplastic hips as derived from the NA and the OFA score. This suggests that variation in the tightness of the hip and its conformation together contribute to hip malformation as defined by the second PC.
Canine hip dysplasia genotype
Canine hip dysplasia has been widely studied (Willis, 1989; Lust, 1997) and an incidence of >50% is reported in some large breeds (Kaneene et al., 1997). Affected dogs develop OA in other joints in addition to the hip joint (Lust, 1997; Morgan et al., 1999; Kealy et al., 2000) indicating a primary systemic defect. Hip dysplasia and secondary hip OA is more severe in dogs with rapid growth rates than in animals on restricted feeding regimes (Kealy et al., 2000).
Heritability estimates for CHD range from 0.1–0.68 (Breur et al., 2002). Heritability, in the narrow sense, is a measure of the additive genetic variance where the total genetic variance has both an additive and dominance component. Heritability of quantitative traits varies because the accuracy with which a trait is measured varies between studies. Traits assessed in studies with smaller residual margins of error will have a higher heritability. Pedigree relationships can be recorded with different degrees of accuracy and completeness. Where the pedigree is not complete, the heritability is repeatable when multiple measurements are taken. Otherwise, the heritability would be close to ‘narrow-sense’ heritability (additive genetic variance). For studies with a large sample size, more parameters such as sex, age, bodyweight, and operator error can be modeled as covariates. These effects would fall into the residual error if they were not included as covariates in the analysis and their omission would lead to the calculation of a lower heritability. Evidence for a major quantitative trait locus contributing to CHD was found in four independent studies based on variance estimates (Leighton, 1997; Todhunter et al., 2003a; Janutta et al., 2006) and Bayesian statistical modeling (Maki et al., 2004). A major locus is generally thought to contribute about 20% of the total phenotypic variance.
Human hip dysplasia: An analogy
The common phenotypic characteristics of human hip dysplasia (HD) and CHD are delayed femoral capital ossification accompanied by hip joint laxity and subluxation (Todhunter et al., 1997; Harcke and Grissom, 1999). Human hip laxity may be detectable at birth as a palpable subluxation (positive Ortolani sign) or by dynamic ultrasound (Harcke and Grissom, 1999) while the earliest detection of CHD is at 14 days of age based on necropsy evidence (Henricson et al., 1966). Predisposing factors for HD, such as first born children, a breech birth and female gender, have not been associated with CHD. Studies have found a ‘left-sidedness’ to the human condition, and the left hip was shown to be more affected than the right based on the NA in Portuguese water dogs (Chase et al., 2004).
Human hip dysplasia occurs with a frequency of 1–10 per 1000 live births (Henricson et al., 1966; Czeizel et al., 1975; Cilliers et al., 1990; Weinstein, 1996; Brier, 1999; Evans, 2001). In Denmark, 4,151 individuals ranging from teenagers to the elderly had a 3.4% prevalence of HD. About 60% and 40% of these cases were bilateral and unilateral, respectively (Jacobsen and Sonne-Holm, 2004). Genetic predisposition to HD and severe hip OA (Beukes HD) was found in 47 members of an extended family over six generations (Beals, 2003). In Italy, the incidence of HD is high, ranging from 10–18.5 cases per 1000 live births, with a particularly high incidence in the Adriatic region (Solazzo et al., 2000).
No candidate genes have been identified for HD but several studies have investigated its mode of inheritance. An interstitial duplication of human chromosome 15q24–26 (DUP25) was associated with joint laxity and social phobias in humans (Gratacos et al., 2001; Ventura et al., 2003). This locus was mapped only when the population was stratified according to hip laxity suggesting linked loci or a single locus with a pleiotropic effect. Complex segregation analysis indicated that a two-locus, recessive-gene model was the most parsimonious hereditary transmission model in this population (Sollazzo et al., 2000).
Several authors have discussed the relationship between HD and the early-onset of hip OA (Harris, 1986; Hoaglund and Healy, 1990; Treble et al., 1990; Beighton et al., 1994; Weinstein, 1996). Recently, familial OA of the hip joint associated with acetabular dysplasia has been mapped to human chromosome 13q (Mabuchi et al., 2006). Consequently, it may be possible to undertake comparative mapping in the dog for a locus or gene that might be identified with HD. Alternatively, a locus or gene for CHD might be used to identify similar genes or pathways that contribute to the human equivalent. This comparative mapping strategy was recently facilitated by completion of the 7.6X canine genomic sequence and gene mapping tools like single nucleotide polymorphism (SNP) maps that were derived from this project.
Coarse genetic mapping
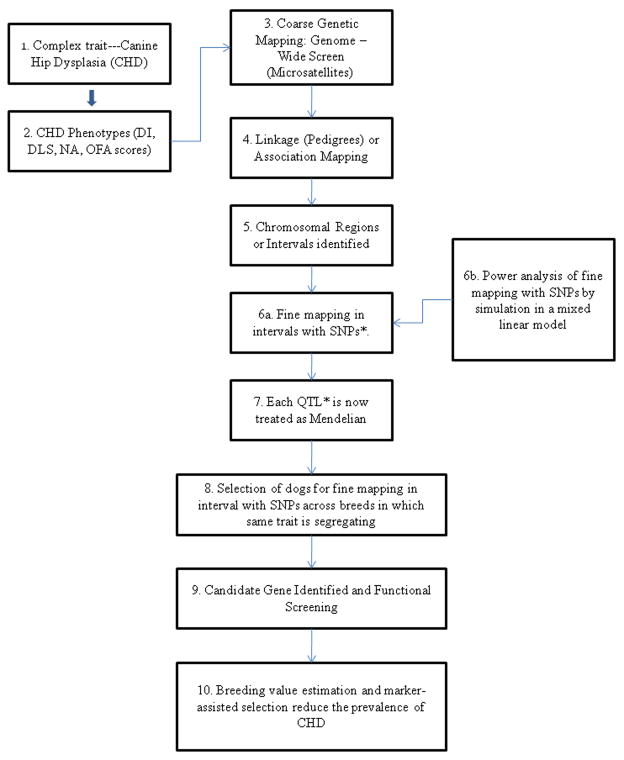
Several factors influence the chances of detecting a QTL when one is present. These include: the size of the QTL effect; the frequency of the QTL alleles; the density of the genetic map; the heritability of the trait; the degree of variation among the population; the hidden population structure; the number of animals studied; and the method of analysis. Chase et al. (2004) described two QTL for the NA on each end of the canine chromosome (Canis familiaris) (CFA01) and one for secondary acetabular osteophyte formation on CFA03 (Chase et al., 2005). This study used a genome-wide screen with microsatellites to identify chromosomal regions linked to CHD. A flow diagram illustrating the path from a phenotype for an inherited trait such as CHD to the discovery of gene(s) underlying the condition is shown in Fig. 2. Microsatellites are two, three, or four simple tandem repeat sequences distributed randomly across the genome that are highly variable between and among populations and are most often located in non–protein coding DNA. Microsatellite screening sets (MSS) are available for initial screening of the canine genome or chromosome by chromosome (Clark et al., 2004).
Fig. 2.
Flow diagram illustrating the investigative progression from identifying an inherited trait to the identification of the underlying polymorphisms and mutations. * SNP = single nucleotide polymorphism, * QTL = quantitative trait locus.
A colony of 210 Labrador retrievers was maintained at Cornell University for more than 30 years (Lust et al., 1973) and was used to found a crossbreed pedigree for mapping the genes underlying CHD in 1994 (Todhunter et al., 1999; Mateescu et al., 2005). Seven unaffected greyhounds (2 males and 5 females) and 8 Labrador retrievers (4 males and 4 females) with CHD and secondary hip OA were crossed. The crossbreed pedigree consisted of four generations of 159 dogs. Given their intensive selection for racing performance, the greyhound ‘founder’ animals were assumed to be homozygous for alleles protective against CHD. The dysplastic Labrador retrievers came from a population selected to produce families with dysplastic hips and were assumed to be homozygous at the loci contributing to CHD. The crossbreed pedigree consisted of four generations (F1 × both greyhound and Labrador retriever founders, F2, and ¾ × ¾ Labrador retriever litters were bred).
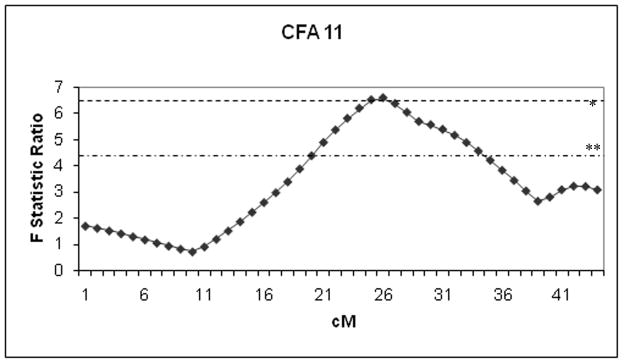
We genotyped 159 dogs from three generations of this crossbreed pedigree with 240 microsatellite markers distributed in 38 autosomes and on the X chromosome. Hip phenotypes analyzed included the DI, the DLS score, and the NA on both the left and right sides. We identified chromosomes 4, 9, 10, 11 (P < 0.01), 16, 20, 22, 25, 29 (P < 0.01), 30, 35, and 37 as harboring putative QTL for one or more phenotypes (Todhunter et al., 2005). Several hip phenotypic measures were influenced by QTL on CFA10, 11, 16 and 22 with alleles that were protective while QTL identified on CFA04, 20, 29, 30 and 35 had alleles that negatively impacted on hip conformation. To further confirm the intervals containing the QTL, we genotyped the same dogs at a total of 471 unique microsatellite loci using both the MSS1 and MSS2 screening sets (Tables 2 and 3). The peak log of the odds (LOD) ratio score (a test statistic that measures significance of linkage) on CFA29 was 2.8 for the left NA at 25 centimorgans (cM) (Fig. 3). To reduce the dimension of correlated phenotypes while maintaining the greatest possible variation, Principal Component Analysis) was applied. Tests of linkage were performed on each derived PC. The highest LOD of 3.45 was obtained for a QTL for the third PC at 36 cM on CFA11 (P < 0.01 experiment-wide).
Table 2.
Position of the 428 microsatellite marker set in Crossbred dogs
| CFA | Number of microsatellite markers | Average intermarker interval (cM) | Marker coverage (%) | Average PIC |
|---|---|---|---|---|
| 1 | 23 | 5.85 | 97.81 | 0.5970 |
| 2 | 17 | 4.74 | 81.47 | 0.6358 |
| 3 | 19 | 4.94 | 89.42 | 0.6924 |
| 4 | 15 | 5.97 | 89.53 | 0.5489 |
| 5 | 19 | 4.42 | 84.78 | 0.5752 |
| 6 | 13 | 5.98 | 89.29 | 0.5808 |
| 7 | 14 | 6.49 | 96.65 | 0.6227 |
| 8 | 12 | 6.38 | 89.04 | 0.5654 |
| 9 | 14 | 4.65 | 84.59 | 0.6399 |
| 10 | 11 | 7.78 | 100 | 0.5924 |
| 11 | 10 | 7.86 | 91.36 | 0.5586 |
| 12 | 15 | 5.57 | 98.348 | 0.5289 |
| 13 | 11 | 6.54 | 95.96 | 0.5766 |
| 14 | 10 | 6.07 | 84.24 | 0.6084 |
| 15 | 9 | 7.25 | 87.01 | 0.5295 |
| 16 | 10 | 5.75 | 78.733 | 0.3849 |
| 17 | 12 | 6.6 | 99.05 | 0.5844 |
| 18 | 11 | 5.7 | 95 | 0.6803 |
| 19 | 11 | 5.62 | 93.59 | 0.6909 |
| 20 | 11 | 5.98 | 99.61 | 0.5275 |
| 21 | 9 | 6.76 | 99.72 | 0.6859 |
| 22 | 12 | 5.26 | 100 | 0.6184 |
| 23 | 9 | 5.85 | 86.3 | 0.4757 |
| 24 | 11 | 6.65 | 100 | 0.5963 |
| 25 | 11 | 4.85 | 89 | 0.5931 |
| 26 | 5 | 8.71 | 90.69 | 0.6138 |
| 27 | 11 | 5.08 | 98.04 | 0.5730 |
| 28 | 6 | 8.76 | 95.51 | 0.6355 |
| 29 | 9 | 5.08 | 89.59 | 0.6256 |
| 30 | 9 | 5.21 | 99.74 | 0.3257 |
| 31 | 7 | 7.02 | 98.24 | 0.5009 |
| 32 | 6 | 6.84 | 80.46 | 0.5146 |
| 33 | 8 | 4.82 | 93.96 | 0.5510 |
| 34 | 9 | 5.07 | 91.22 | 0.5238 |
| 35 | 6 | 5.79 | 91.37 | 0.4148 |
| 36 | 5 | 6.02 | 88.07 | 0.7018 |
| 37 | 14 | 4.98 | 100 | 0.6577 |
| 38 | 4 | 8.76 | 91.18 | 0.3978 |
| X | 10 | 6.18 | 44.49 | 0.5667 |
|
| ||||
| 428 | 6.098205128 | 91.10412821 | 0.5716 | |
Table 3.
Position of the 284 microsatellite marker set in Labrador retrievers
| CFA | Number of microsatellite markers | Average intermarker interval (cM) | Marker coverage (%) | Average PIC |
|---|---|---|---|---|
| 1 | 15 | 8.97 | 98.219 | 0.6128 |
| 2 | 11 | 7.332 | 81.455 | 0.5778 |
| 3 | 10 | 9.387 | 89.4 | 0.7204 |
| 4 | 10 | 8.953 | 89.53 | 0.4818 |
| 5 | 12 | 6.994 | 84.768 | 0.6149 |
| 6 | 10 | 7.414 | 85.218 | 0.6559 |
| 7 | 6 | 13.692 | 87.383 | 0.6300 |
| 8 | 8 | 9.571 | 89.047 | 0.6147 |
| 9 | 10 | 6.514 | 84.597 | 0.5359 |
| 10 | 7 | 10.209 | 89.313 | 0.6642 |
| 11 | 8 | 9.821 | 91.372 | 0.4980 |
| 12 | 7 | 10.643 | 87.635 | 0.5375 |
| 13 | 7 | 10.28 | 95.96 | 0.5473 |
| 14 | 6 | 10.108 | 84.236 | 0.5527 |
| 15 | 6 | 10.877 | 87.013 | 0.4671 |
| 16 | 7 | 8.006 | 76.781 | 0.3393 |
| 17 | 8 | 9.988 | 99.875 | 0.5450 |
| 18 | 6 | 10.451 | 95 | 0.5846 |
| 19 | 7 | 8.824 | 93.621 | 0.7747 |
| 20 | 8 | 8.218 | 99.603 | 0.5365 |
| 21 | 7 | 8.69 | 99.721 | 0.7334 |
| 22 | 8 | 7.887 | 100 | 0.6881 |
| 23 | 5 | 8.074 | 66.177 | 0.3247 |
| 24 | 9 | 8.131 | 100 | 0.6756 |
| 25 | 6 | 8.9 | 89 | 0.6639 |
| 26 | 3 | 14.51 | 90.688 | 0.4672 |
| 27 | 8 | 6.985 | 98.04 | 0.5959 |
| 28 | 5 | 9.106 | 82.778 | 0.5099 |
| 29 | 5 | 9.138 | 89.588 | 0.4962 |
| 30 | 3 | 15.379 | 98.162 | 0.5177 |
| 31 | 6 | 8.187 | 98.244 | 0.5404 |
| 32 | 8 | 5.129 | 80.459 | 0.4926 |
| 33 | 8 | 4.815 | 93.956 | 0.5961 |
| 34 | 10 | 4.561 | 91.222 | 0.6210 |
| 35 | 4 | 8.679 | 91.358 | 0.5194 |
| 36 | 4 | 7.283 | 71.049 | 0.6298 |
| 37 | 4 | 8.55 | 85.495 | 0.5890 |
| 38 | 3 | 10.591 | 83.616 | 0.5376 |
| X | 9 | 6.87 | 44.496 | 0.6486 |
|
| ||||
| 284 | 8.915820513 | 88.30961538 | 0.5728 | |
Fig. 3.
Variance ratio profile plot of the left hip Norberg angle across canine chromosome CFA11 following a genome-wide, microsatellite-based screen on 159 Labrador retriever/greyhound crossbreed dogs. The variance ratio is shown on the Y-axis for each position where the presence of a quantitative trait locus (QTL) for the left Norberg angle was tested at various recombination fractions between every two microsatellite flanking markers across the chromosome (X-axis in centimorgans [cM]). The log of the odds (LOD) score at the peak position was 2.8 in this example. The chromosome-wide thresholds for the F ratio statistic at * (P < 0.01) and ** (P < 0.05) are drawn across the graph. QTL Express software was used for modeling.
The principal challenge in mapping quantitative traits lies in unraveling the underlying genes. The identification of genes and mutations underlying QTL is problematic, and one of the major issues is that the mapping resolution typically achieved is poor after the initial linkage mapping step. Following linkage analysis that relies on observed recombinations, confidence intervals of the order of 20–30 cM containing as many as 500–1,000 genes for locating the QTL are typical. This is due to the limited number of ‘recombinant equivalents’ in the available pedigree material and many QTL effects are likely to reflect the combined action of multiple linked genes. One strategy being explored to refine the coarse QTL interval in dogs is to take advantage of historical recombinants by exploiting linkage disequilibrium (LD).
Single nucleotide polymorphisms for fine mapping
Assuming that a common disease will have mutations common to many breeds, one approach compares the QTL that contain the genes contributing to CHD within, and then across, breeds. Since we now have a canine SNP map and LD characterization (Sutter and Ostrander, 2004; Lindblad-Toh et al., 2005) canine genetic diversity is now exploitable to find the contributing genes for inherited diseases. Single nucleotide polymorphisms are single nucleotide variants found within coding or non-coding regions of genes, or in intergenic regions. Linkage disequilibrium is the non-random association of alleles at two loci on the same chromosome and represents the random segregation of alleles on the same chromosome and between chromosomes. If SNPs are physically very close on a chromosome, they always segregate together, which results in complete LD. If the QTL is common across breeds, the dog population structure enables a two-stage mapping approach (i.e. first within a breed for coarse localization and then among breeds for fine mapping) to focus on a narrow candidate region (Lindblad-Toh et al., 2005). Such issues are important for complex trait mapping in which multiple genes contribute to the phenotype. Single nucleotide polymorphism chips allow the genotyping of 10 to 100 fold more genetic markers than were previously possible with older microsatellite marker technology and facilitates the mapping of causal genes in much smaller families than was previously possible (Bahlo et al., 2006).
Association mapping, a method of statistically associating a trait measurement or phenotype with a genetic marker (such as an SNP or group of physically linked SNPs called a haplotype) of complex traits in natural populations is now feasible with a few hundred cases and appropriate controls (Lindblad-Toh et al., 2005). If animals are unrelated, the SNP alleles in common and at higher frequencies are likely to be associated with the trait when compared to an unaffected control population. Using an LD and SNP-based mapping strategy, it was reported that polymorphisms in the insulin-like growth factor-1 gene were responsible for a major proportion of the variation in size of Portuguese water dogs and also were a major contributor to differences in size between breeds (Sutter et al., 2007).
What is the power of a fine mapping strategy with single nucleotide polymorphisms?
Before embarking on a fine mapping experiment, an investigator needs to have some assurance that the strategy will produce meaningful results. For our mapping studies, we had two available dog populations, (1) animals related by pedigree (mostly Labrador retrievers, greyhounds, and their crossbred offspring, German shepherds, and Golden retrievers), and (2) unrelated animals of various breed admitted to the Cornell University Hospital for Animals for hip assessment.
To remove or reduce spurious associations of hip traits and genetic markers, we accounted for genetic relatedness among the examined dogs for our genetic mapping studies. Since 1992, we have bred over 180 Labrador retrievers that have DNA and trait data available for genome-wide screening and fine mapping. Eighteen of these litters have parents related to the Labrador retriever ‘founder’ animals of our crossbreed Labrador retriever/greyhound pedigree, while eight litters are unrelated to these founders. These Labrador retrievers include both affected and unaffected dogs with a wide range in phenotypes as measured by the DI (0.2–1.2) and DLS score (28–75%). In addition to a selection of Labrador retrievers unrelated for at least the previous three generations, we have acquired Labrador retriever DNA and phenotype data from a foundation (Guiding Eyes for the Blind, Yorktown Heights, New York), which breeds dogs that can be used in disease-marker association studies. Such studies are a powerful alternative to linkage studies for the fine scale mapping of loci contributing to inherited diseases.
The underlying assumption of this approach is that all (or at least a majority) of affected individuals share a common ancestor bearing a disease-predisposing mutation. Descendents of individuals who have inherited the mutation would also be expected to inherit the chromosomal region flanking the disease locus (LD mapping) unless recombination had occurred in previous generations.
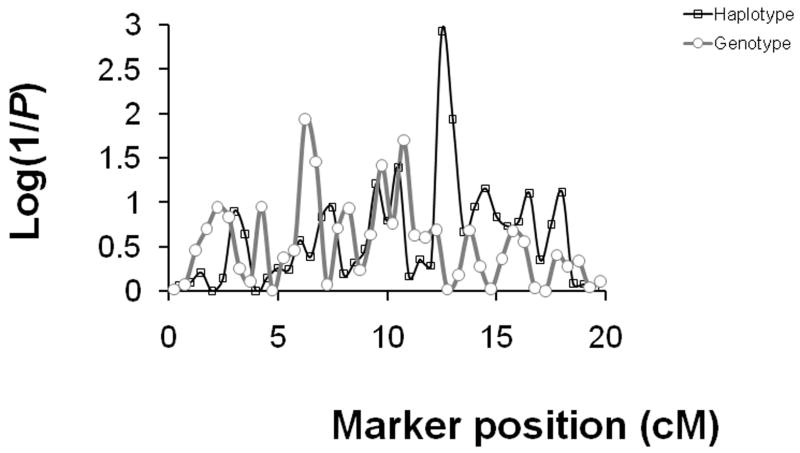
Besides access to a population of purebred dogs, acquiring SNP genotypes at a certain density is important for successful genetic mapping of a locus. We simulated SNP genotypes for the Cornell crossbreed (159 dogs) and Labrador retriever (180 dogs) populations assuming an average chromosome length of 80 cM and a SNP density every 2 megabases (Mb) (approximately 2 cM) across the chromosome with a given level of LD. The simulated SNP was assumed to have 50% allele frequency for each of the bi-alleles and a single QTL (also bi-allele with equal frequency) was assumed on any given chromosome. The association of simulated genotypes and true NAs of Cornell dogs was analyzed in a mixed linear model. To lower the false discovery rate and increase the power of QTL detection, pedigree structure was incorporated into the model to correct for polygenic background effects. At a false discovery rate of 5%, the power to detect a QTL with 5% and 10% contribution to hip phenotype variation, and after accounting for the non–random background QTL effects, was 72% and 94%, respectively (Fig. 4).
Fig. 4.
Association tests between the Norberg angle and 40 simulated single nucleotide polymorphism (SNP) markers spaced 2 cM apart across an 80 centimorgan (cM) length chromosome. The strength of association was measured as the log (1/probability [P]) on the Y-axis for each individual SNP genotype and the haplotype of two adjacent markers. The haplotype model considers the contribution of flanking marker genotypes beginning with the two markers flanking the quantitative trait locus (QTL) and eventually including the haplotype over multiple markers. Advantages of haplotype analysis are that interactions among QTLs are revealed and the power of detection for QTLs that are not superimposed on markers is increased. The threshold for the level of significance would be determined based on the number of association tests. The simulated QTL was located at 50 cM where the peak is revealed. The additional power to detect the QTL with the flanking haplotypes compared to the single SNP genotype is clear. A centimorgan (cM) is equivalent to a megabase (Mb) over short intervals. The cM is the unit of measurement for a linkage study because cM is a measure of recombination distance. The Mb is the physical genetic distance used in a true association study of unrelated dogs where recombinations are not observed.
In general, unless the unrelated population of dogs is large, it is unlikely that a QTL that contributes <5% to the variance of CHD will be detected. This likelihood of detection only increases if the SNP is located in or is totally linked to the QTL. Therefore, the current Cornell pedigrees have strong SNP-based mapping power, and this power will be maximized if the most phenotypically and genotypically informative dogs are genotyped. The simulation illustrates that genotyping the Cornell dogs at a reasonable number of SNP loci spaced evenly across the chromosome gives sufficient power to detect a QTL that contributes 5% to the overall variability of the NA. To assess the mapping power if the QTL is located between two SNP markers, we further simulated SNP genotypes over a 20 cM interval at a SNP density of 0.5 cM (approximately 0.5 Mb) (i.e. a four-fold increase in density compared to the density used to derive the plot in Fig. 3). Although the power of detecting a QTL was reduced dramatically if the QTL was located between two markers, substituting a marker’s genotype with the haplotype of adjacent markers resulted in the maintenance of reasonable mapping power. At worst, the current population has a detection power of 54% and 37% at a 5% false positive rate for a QTL with 10% and 5% contribution to hip phenotype variation, respectively.
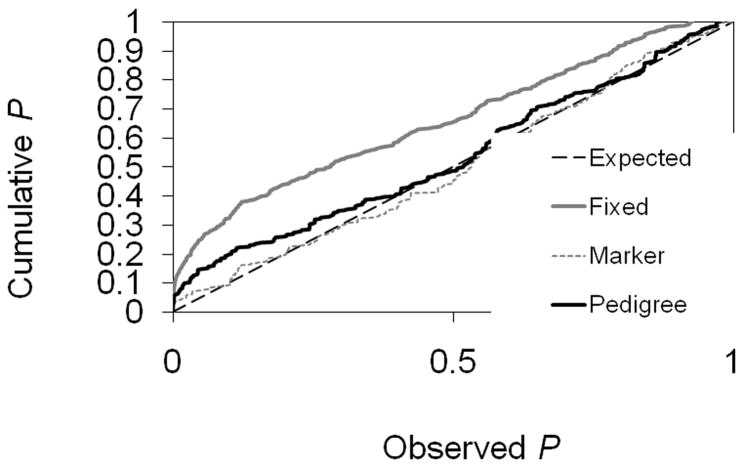
The performance of the mixed linear model partially depends on the quality of estimating the relationship of background QTLs that affect the additive genetic variance in the pedigree. A significant SNP-marker association in a pedigree could be a false positive signal if a certain degree of genetic relatedness exists among ‘founder’ animals. To account for this genetic relatedness and to reduce the false positive rate, we estimated the relationship for background QTLs using the 471 microsatellite markers in the combined Cornell population (Labrador retrievers plus Labrador retriever crossbreeds). As shown in Fig. 5, the false positive rate in the mixed linear model that accounted for genetic relatedness (‘marker’ and ‘pedigree’) was lower than the model without correcting the relatedness (‘fixed’). Moreover, relationships estimated by genetic markers (‘marker’) resulted in an even lower false positive rate compared with that using the true pedigree relationship (‘pedigree’). This result illustrates that genetic relatedness plays an important role in correctly identifying QTL. One method to confirm unrelatedness is to examine pedigrees provided by owners or use kennel club registration numbers.
Fig. 5.
Distribution of P values under the null hypotheses of no association between the quantitative trait locus (QTL) and the marker genotype. A broken straight diagonal line drawn in black is expected if there is no association with the lowest type I error rate, i.e. calling the presence of a QTL when in fact the null hypothesis of no association holds. The mixed model with the relationship matrix based on markers (Marker) is the closest to the expected relationship. The model excluding background QTLs (Fixed) is the worst relationship. The mixed model with relationship based on the true Cornell pedigrees (Pedigree) is intermediate. All the analyses were carried out using the Statistical Analysis System (SAS) procedures HAPLOTYPE, MIXED and SAS. The SAS procedure HAPLOTYPE was used to estimate the haplotype probability by maximum likelihood using the expectation maximization (EM) algorithm. The procedure MIXED tests for both fixed and random effects (Littell et al., 1996). To make the polygenic effect a correlated random effect, the variance and covariance structure was constructed before using the procedure. A computer program LORG in the form of a SAS macro was developed to facilitate the applications. The macro automatically constructs a SAS dataset that defines the variance and covariance structure of genetically correlated random effects. The SAS dataset can be imported by the SAS procedure MIXED with the option of GDATA or LDATA.
Fine mapping with SNPs
Based on linkage analysis, the QTL regions on CFA11 and 29, previously coarsely mapped, have now been further localized. We narrowed the QTL on CFA11 and CFA29 for the DI following SNP genotyping (Zhu et al., 2007). Single nucleotide polymorphism genotyping was undertaken using the ABI SNPLex method2. Two hundred and fifty-seven greyhounds, Labrador retrievers, and their crossbred offspring were genotyped at 111 and 171 SNP loci under the QTL peak region on CFA11 and CFA29 (Todhunter et al., 2005), respectively. Of these SNPs, 106 and 157 were informative on CFA29 and 11, respectively. Multipoint linkage analysis was undertaken using a Bayesian approach implemented in LOKI (Shmulewitz and Heath, 2001). LOKI is a reversible jump Markov Chain Monte Carlo (MCMC) linkage analysis method that takes whole pedigree information into account and allows for multiple QTLs that may contribute to the trait. The method also corrects for multiple hypothesis testing. The Bayes factor (the ratio between the posterior probability that a QTL signal is real or is due to chance alone) is reported along the chromosome. This software implements a linkage method, but it has enabled the QTL interval for the DI on CFA11 and 29 to be refined ten-fold compared to microsatellite-based linkage model software (QTL Express) used for our coarse mapping.
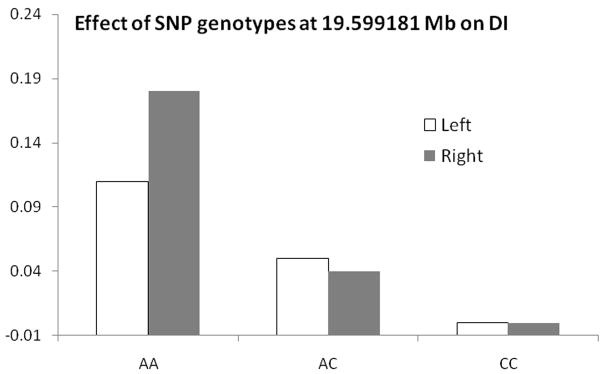
Significant evidence for linkage (Bayes factor of 18) of QTL contributing to the DI between 16.2–21 cM on CFA11 with a 95% posterior probability (19.1–20.1 cM with 99% posterior probability) was found, which explained about 15% (left hip) and 18% (right hip) of the total variance in the DI respectively. The QTL for the DI on CFA29 was 20.1–21.0 cM (99% posterior probability interval). When CFA11 and 29 were analyzed simultaneously, the significance of QTL was reduced on CFA29 but remained strong on CFA11. These results indicated that genes within the QTL on CFA11 and CFA29 informed the left and right DI, thereby contributing to CHD. We discovered a haplotype of 10 SNPs within this QTL on CFA11 at approximately 20 Mb that segregated with CHD. We sequenced affected (i.e. animals with a DLS score <45%, a DI >0.7, a NA <90°, or an OFA score of moderate or severe CHD) and unaffected dogs (i.e. animals with a DLS score >55%, a DI <0.4, a NA >108°, or OFA scores of excellent or good). Genotyped dogs were unrelated back at least three generations. An association test at this SNP showed the homozygous mutant (affected) SNP genotype increased the DI by 0.2 units (thus worsening the hip laxity) compared to the homozygous normal (unaffected) genotype (Fig. 6).
Fig. 6.
Effect of single nucleotide polymorphism (SNP) genotypes on the distraction index (DI) at 19.6 Mb on CFA11 according to the mixed linear model association analysis. The AA genotype increases hip laxity (distraction index is indicated on the Y-axis) and the CC genotype is protective (decreases the DI).
We reasoned that further refinement of the QTL location would reduce the number of candidate genes to be considered. Saturation of the 95% probability interval surrounding the QTL already identified on CFA11 and 29 with additional SNP genotypes was the next strategy. To undertake this refined QTL localization, we selected one SNP approximately every 45 Kb on CFA11 and CFA29 within the QTL identified in the multipoint linkage analysis. We maximized the number of Labrador retriever SNPs. If possible, at least one SNP within the boundaries of each gene in our target regions was selected which totaled 1,584 SNPs. By breed, these SNPs represented 31% Boxer, 26% Poodle, 5% Labrador retriever, 4% German shepherd, and the remainder miscellaneous breeds. Among the 504 genes in our target regions, 275 SNPs were selected. The remaining genes had no intragenic SNPs. An additional 75 SNPs were selected as negative controls. We were able to identify 96% of the SNP genotypes in a preliminary group of 85 dogs.
Selection of dogs for fine SNP mapping
We have accumulated DNA and hip radiographic measurements on over 1800 dogs. We estimate that at least 20 dogs per breed on each end of the hip conformation spectrum (trait measures as described above) would need to be genotyped to have adequate mapping power. An approach to identify those dogs at the phenotype extremes and unrelated back at least three generations was developed. The approach diversified the sampled dogs for their predicted genetic value in a mixed linear model. The genetic values were based on multiple hip measurements over time with adjustments based on age, sex, and bodyweight. All dogs were evaluated simultaneously by a numerator relationship calculated from pedigree. Dog selection based on phenotype used the PCs of the DI, the DLS score, and the NA weighted by their eigenvalues.
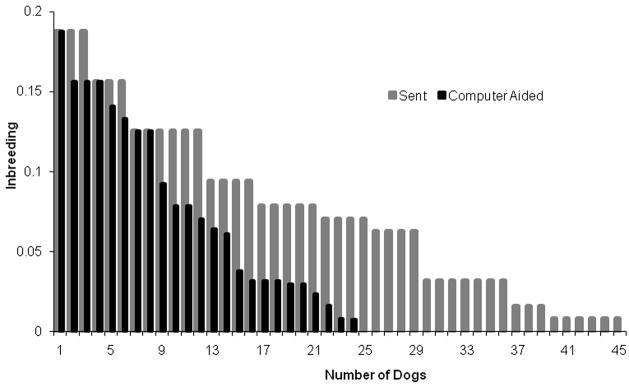
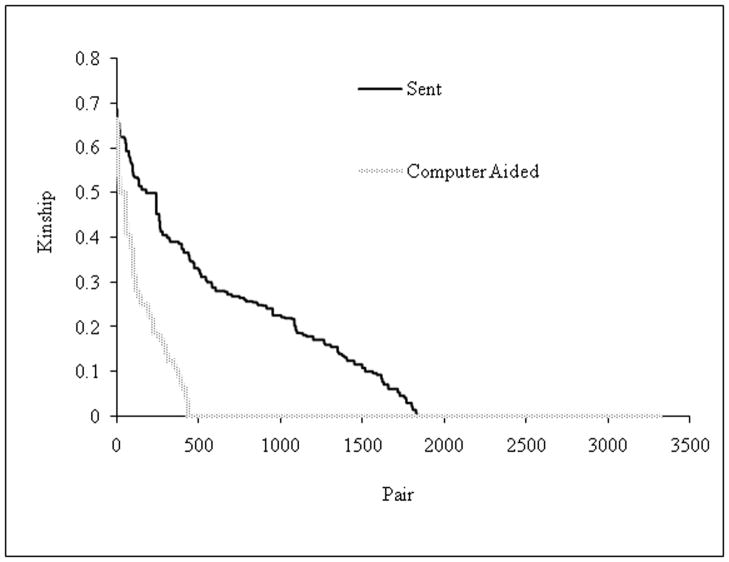
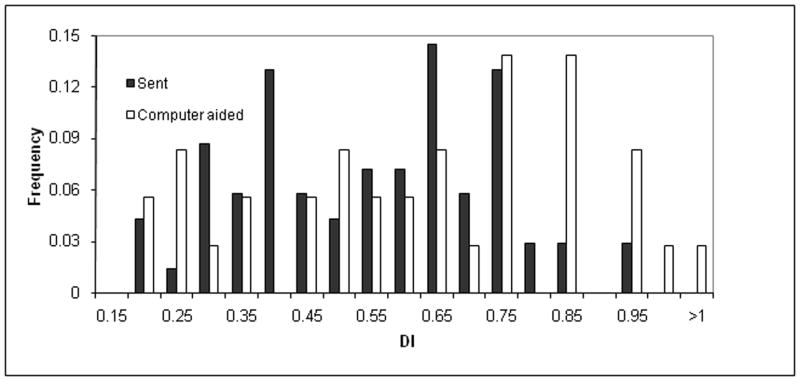
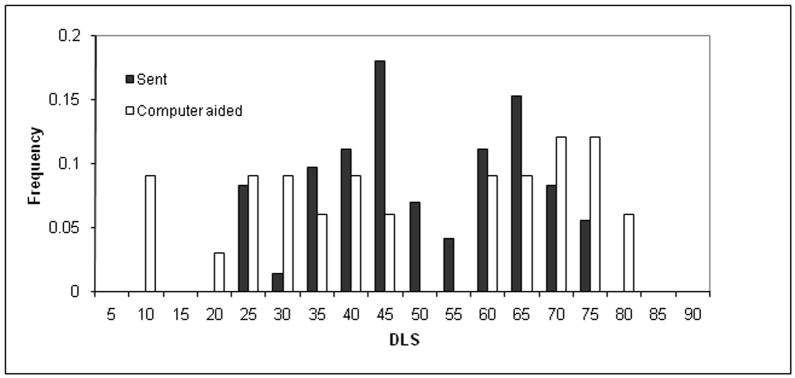
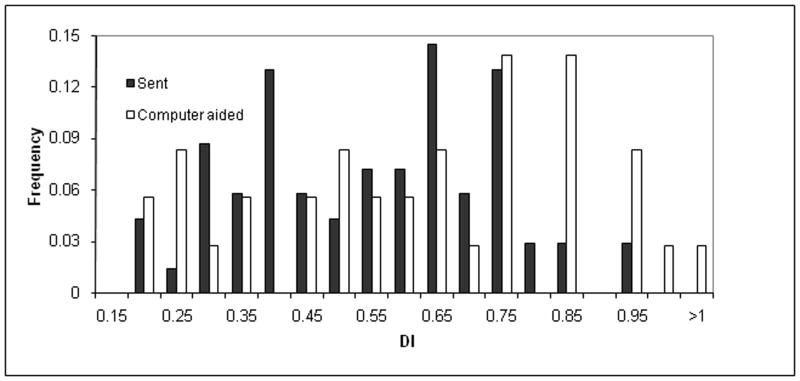
The first 85 dogs SNP genotyped as described above were selected by eye for low relatedness and phenotypic extremes. By comparison, the software-based selection strategy to improve the phenotypic and genetic information among genotyped dogs significantly reduced genetic relatedness (Fig. 7) and increased phenotypic diversity (Fig. 8). This analysis indicated that algorithms that maximize phenotypic and genetic informativeness are superior to manual selection. Using these algorithms, 500 additional dogs were selected for genotyping at SNP loci across multiple chromosomes using Molecular Inversion Probe (MIP) technology on the Affymetrix platform3. This investigation is ongoing.
Fig. 7.
The impact of a sampling approach based on inbreeding coefficient (A) and kinship (B) for pairs of dogs sampled. In the inbreeding coefficient graph (A), the light histograms (sent) were the result of human efforts to maximize phenotype diversity in 82 dogs selected for single nucleotide polymorphism (SNP) genotyping. The dark histograms (computer-aided) resulted from the strategy to maximize phenotypic and genetic diversity of 82 dogs sampled from the same population based on a computer algorithm. The sample from human efforts to maximize diversity resulted in 37 dogs with a 0 inbreeding coefficient. The computer algorithm sample resulted in 58 dogs with a 0 inbreeding coefficient. The kinship graph (B) shows kinship plotted as a function of each pair of 82 dogs. Kinship is the probability that two individuals will share an identical allele by descent. For 82 dogs, 3,321 [(82*81)/2] pairs of dogs are possible. The human effort and computer-aided approaches are shaded light and dark respectively. It is clear that the kinship and inbreeding coefficients were greatly reduced using the computer-aided approach.
Fig. 8.
The impact of the computer-aided sampling approach on phenotype distribution (X-axis) among the frequency of sampled dogs (Y-axis). The phenotype distribution for the left distraction index (DI) (top), left dorsolateral subluxation (DLS) score (middle), and left Norberg angle (NA) score (bottom) is shown. The dark histograms resulted from human effort to maximize phenotype diversity for 85 dogs while accounting for genetic unrelatedness of the first 85 dogs chosen for dense single nucleotide polymorphism (SNP) genotyping. The light histograms resulted from a computer-aided dog selection method. Intermediate shading indicates overlap. It is clear that the computer-aided approach resulted in greater phenotypic diversity, which should result in maximum mapping power among the dogs available for genotyping. The frequency is the proportion of all dogs with each phenotype group measurement.
Candidate genes that may contribute to hip dysplasia
Once the region is narrowed using SNP genotyping on the most informative dogs available, screening of mutant candidate genes within the interval of about 1–2 Mb is carried out. Genes implicated in HD and in diseases of fibrous connective tissue and in chondroepiphyses would be candidates. Mutation identification through direct sequencing of candidate genes from genomic DNA and the predicted effect on amino acid composition of the protein between affected and unaffected dogs would be considered evidence that these genes contributed to CHD. Genes of unknown function within the interval must also be candidates. Hormonal effects on expression of matrix genes and turnover of their encoded proteins must also be considered. Examples include relaxin, estrogen, testosterone and their receptors (Goldsmith et al., 1994).
In addition, temporal expression of developmental genes should be given consideration because examination of gene expression at a single time point or at the wrong developmental stage will result in a false negative result in terms of the candidate gene’s effect. To be functional, candidate genes must be expressed in the hip joint capsule, coxofemoral chondroepiphyseal cartilage, round ligament of the femoral head, or in bone. Recent studies demonstrate that a trait-associated mutation might also occur in intragenic non-coding regions such as regulatory sequences (Karlsson et al., 2007). We can expand our complete sequencing of the regulatory regions to identify haplotypes and test the association between the polymorphic haplotypes and trait variation.
Breeding values, genotypes, and hip dysplasia susceptibility
Selection methods in North America to reduce the prevalence of CHD have been based on radiographic hip screening, semi-open and closed hip registries, and organized breeding programs (Ohlerth et al., 1998; Wood et al., 2000a; Wood et al., 2000b). Through these breeding strategies, CHD was shown to be heritable, and selection reduced the prevalence of CHD (Swenson et al., 1997). For example, the prevalence of CHD among German shepherd dogs at 12–16 months of age decreased from 55% to 24% after five generations of selection (Swenson et al., 1997). Among Labrador retrievers, this prevalence decreased from 30% to 10% (Leighton et al., 1977; Leighton, 1997).
For lowly heritable traits, selection accuracy could be low because most selections were based on phenotype, which is only effective for highly heritable traits. A preferable selection option for breeders and purchasers would be based on individual genetic values, termed BVs. A BV is usually predicted by using a mixed linear model and is also called the best linear unbiased prediction (BLUP). Implementation of BLUP was enhanced by methods of variance component estimation, such as restricted maximum likelihood (Patterson and Thompson, 1971). Variance components due to additive genetic and residual effects were estimated, and the heritability for CHD was derived in Finnish Rottweilers (Maki et al., 2000). The mean BV over a 10 year period clearly indicated genetic improvement.
The BVs for each dog and its accuracy were calculated for the PCs of the DI, the DLS score, the NA, and the OFA hip score measured on the left and right hips of 2716, mostly Labrador retrievers. The hip phenotypes of these animals were accumulated from closed breeding colonies at the Baker Institute for Animal Health at Cornell, the Guiding Eyes for the Blind, and the Cornell University Hospital for Animals. A dog with higher accuracy tends to have higher BVs on the first PC, which is the sum of the four traits measured on both sides. Breeding value accuracy was estimated as the square root of ( ), where PEV is the error variance of predicted BVs and is the additive genetic variance.
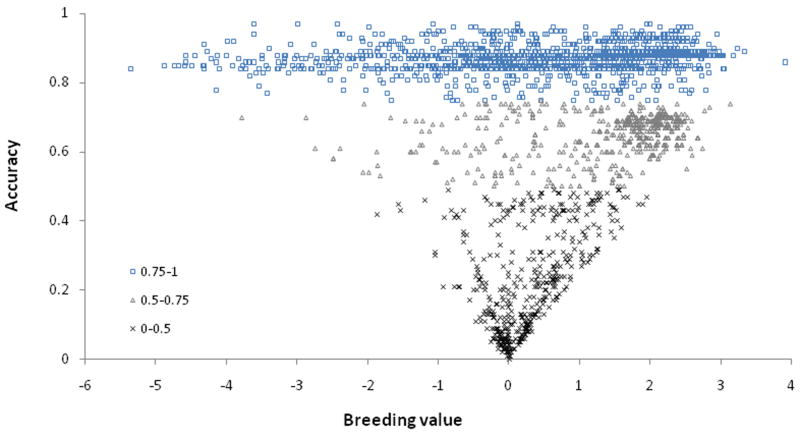
To calculate our BVs, the directions of the DI and OFA scores were reversed as better hip conformation in indicated by lower DIs and lower OFA scores and higher DLS scores and NAs, respectively. Therefore, a larger BV indicated better hip conformation. The mean and standard deviation of the BV for the first PC were −0.75 and 1.42. Dogs with an accuracy of >0.75 had an average BV of 0.87, whereas those with an accuracy of 0.5–0.75 had an average BV of 0.65. The dogs with accuracy of <0.5 had an average BV of 0.19 (Zhang et al., 2008). The distribution of BVs and accuracy for the first PC is illustrated in Fig. 9. This indicates that positive selection occurred in the population (many dogs were from the ‘Guiding Eyes for the Blind’ colony) as more siblings and progeny were produced from dogs with higher BVs and higher accuracy than were produced from dogs with lower BVs.
Fig. 9.
The distribution of the breeding value and accuracy on the first principal component calculated from the distraction index, the dorsolateral subluxation score, the Norberg angle, and the Orthopedic Foundation for Animals-type hip score measured on the left and right hips. The breeding values and accuracy (three accuracy groupings of 0.75–1.0, 0.5–0.74 and 0–0.49 are listed at bottom left of the graph) were calculated for 2,716 dogs (1,888 were phenotyped). For the remainder, only the genetic relationships were used in the calculations. The dogs with the highest breeding values had the broadest trait distribution, enabling the best discrimination (highest accuracy) between dogs for breeder selection and purchase.
Table 1 details the BVs and accuracy for dogs with the best and worst hip conformations. As genetic markers became available for QTL detection, the selection based on BLUP was developed into a marker-assisted selection (MAS), which was shown to be superior to selection using BLUP alone (Zhang and Smith, 1992; Zhang and Smith, 1993). Such genetic markers will be available to assess CHD susceptibility and resistance in the future and may supplant the use of radiological examination.
Table 1.
Details of the ‘best’ and ‘worst’ ten male dogs as scored by the breeding value (BV) on the first principal components calculated from the dorsolateral subluxation score, the Norberg angle, and the Orthopedic Foundation for Animals type-hip score measured on the left and right sides. The screening criteria also included an accuracy of >0.75. This method identified the dogs with the best and worst hip conformation, which would enable discrimination between offspring prior to phenotyping or breeding.
| Worst Hip | Best Hip | ||||
|---|---|---|---|---|---|
| Dog | BV* | Accuracy | Dog | BV | Accuracy |
| A | −4.724 | 0.85 | K | 2.946 | 0.88 |
| B | −4.724 | 0.85 | L | 2.946 | 0.88 |
| C | −4.58 | 0.85 | M | 2.955 | 0.88 |
| D | −4.58 | 0.85 | N | 2.979 | 0.89 |
| E | −4.444 | 0.88 | O | 2.982 | 0.89 |
| F | −3.063 | 0.85 | P | 2.993 | 0.88 |
| G | −3.063 | 0.85 | Q | 3.004 | 0.88 |
| H | −1.967 | 0.89 | R | 3.008 | 0.88 |
| I | −1.857 | 0.85 | S | 3.016 | 0.88 |
| J | 1.954 | 0.97 | T | 3.179 | 0.88 |
BV = Breeding value
Conclusions
The accuracy diagnosis of CHD in immature and young, mature dogs varies depending on the radiological and clinical methods used (Lust et al., 2001; Smith et al., 1997). False negative diagnoses occur when the traditional OFA radiographic projection is applied, whereas false positive diagnoses can occur with other methods like the use of DI. Furthermore, radiographs are insensitive in the detection of mild OA in the hips of affected dogs. This presents veterinarians with practical difficulties both in terms of making an accurate diagnosis and in treatment decisions when dealing with growing dogs with potential CHD. Identifying QTL that either protect against or increase the risk of CHD would lead to the creation of genetic marker tests that would improve both diagnosis and prognostic advice.
The long-term goal is to reduce the frequency and severity of CHD and the effects of secondary hip OA. Identifying the mutation(s) causing CHD would enhance our understanding of the biochemical mechanisms that underpin this disease and, ultimately, lead to more effective treatment and prevention strategies. Until all the detectable genes that contribute to, or protect against, CHD are identified in a breed, veterinarians and breeders will need to combine accurate phenotype screening and BVs and subsequently include genetic testing to provide the best service to their clients.
Acknowledgments
We gratefully acknowledge the support of The Morris Animal Foundation, The Orthopedic Foundation for Animals, Cornell Biotechnology, The Collaborative Grants Program, NIH for R21, Pfizer Incorporated, Masterfoods Incorporated, and that of private donations. We greatly miss our colleague, Dr. Nancy Burton-Wurster, who passed away last year leaving us to carry on her important work.
Footnotes
Conflict of interest statement None of the authors of this paper has a financial or personal relationship with other people or organizations that could inappropriately influence or bias the content of the paper.
Publisher's Disclaimer: This is a PDF file of an unedited manuscript that has been accepted for publication. As a service to our customers we are providing this early version of the manuscript. The manuscript will undergo copyediting, typesetting, and review of the resulting proof before it is published in its final citable form. Please note that during the production process errors may be discovered which could affect the content, and all legal disclaimers that apply to the journal pertain.
References
- Bahlo M, Silver JD, Graaf C, Stankovich J. SNP chip gene mapping. Bioinformatics, Statistical Genetics, The Walter and Eliza Hall Institute of Medical Research Annual Report 2005–2006. 2006:8. [Google Scholar]
- Beals RK. Familial primary acetabular dysplasia and dislocation of the hip. Clinical Orthopaedics and Related Research. 2003;406:109–115. doi: 10.1097/01.blo.0000043052.62337.66. [DOI] [PubMed] [Google Scholar]
- Beighton P, Cilliers HJ, Ramesar R. Autosomal dominant (Beukes) premature degenerative osteoarthropathy of the hip joint unlinked to COL2A1. American Journal of Medical Genetics. 1994;53:348–351. doi: 10.1002/ajmg.1320530408. [DOI] [PubMed] [Google Scholar]
- Breur GJ, Lust G, Todhunter RJ. Genetics of hip dysplasia and other orthopedic traits. In: Ruvinsky A, Sampson J, editors. Genetics of the Dog. CAB International; Wallingford, Oxon, UK: 2002. [Google Scholar]
- Brier SR. Primary Care Orthopedics. Mosby; St Louis, USA: 1999. p. 478. [Google Scholar]
- Burton-Wurster N, Farese JP, Todhunter RJ, Lust G. Site-specific variation in femoral head cartilage composition in dogs at high and low risk for development of osteoarthritis: insights into cartilage degeneration. Osteoarthritis and Cartilage. 1999;7:486–497. doi: 10.1053/joca.1999.0244. [DOI] [PubMed] [Google Scholar]
- Chase K, Lawler DF, Adler FR, Ostrander EA, Lark KG. Bilaterally asymmetric effects of quantitative trait loci (QTLs): QTLs that affect laxity in the right versus left coxofemoral (hip) joints of the dog (Canis familiaris) American Journal of Medical Genetics. 2004;124A:239–247. doi: 10.1002/ajmg.a.20363. [DOI] [PMC free article] [PubMed] [Google Scholar]
- Chase K, Lawler DF, Carrier DR, Lark KG. Genetic regulation of osteoarthritis: a QTL regulating cranial and caudal acetabular osteophyte formation in the hip joint of the dog (Canis familiaris) American Journal of Medical Genetics. 2005;135:334–335. doi: 10.1002/ajmg.a.30719. [DOI] [PMC free article] [PubMed] [Google Scholar]
- Cilliers HJ, Beighton P. Beukes familial hip dysplasia: an autosomal dominant entity. American Journal of Medical Genetics. 1990;36:386–390. doi: 10.1002/ajmg.1320360403. [DOI] [PubMed] [Google Scholar]
- Clark LA, Tsai KL, Steiner JM, Williams DA, Guerra T, Ostrander EA, Galibert F, Murphy KE. Chromosome-specific microsatellite multiplex sets for linkage studies in the domestic dog. Genomics. 2004;84:550–554. doi: 10.1016/j.ygeno.2004.06.006. [DOI] [PubMed] [Google Scholar]
- Czeizel A, Tusnady G, Vaczo G, Vizkelety T. The mechanism of genetic predisposition in congenital dislocation of the hip. Journal of Medical Genetics. 1975;12:21–124. doi: 10.1136/jmg.12.2.121. [DOI] [PMC free article] [PubMed] [Google Scholar]
- Evans RC. Illustrated Orthopedic Physical Assessment. Mosby; St. Louis, USA: 2001. p. 1035. [Google Scholar]
- Farese JP, Todhunter RJ, Lust G, Williams AJ, Dykes NL. Dorsolateral subluxation of hip joints in dogs measured in a weight-bearing position with radiography and computed tomography. Veterinary Surgery. 1998;27:393–405. doi: 10.1111/j.1532-950x.1998.tb00146.x. [DOI] [PubMed] [Google Scholar]
- Farese JP, Lust G, Williams AJ, Dykes NL, Todhunter RJ. Comparison of measurements of dorsolateral subluxation of the femoral head and maximal passive laxity for evaluation of the coxofemoral joint in dogs. American Journal of Veterinary Research. 1999;60:1571–1576. [PubMed] [Google Scholar]
- Flückiger M. Scoring radiographs for canine hip dysplasia – the big three organizations in the world. European Journal of Companion Animal Practice. 2007;17:135–140. [Google Scholar]
- Goldsmith LT, Lust G, Steinetz BG. Transmission of relaxin from lactating bitches to their offspring via suckling. Biology of Reproduction. 1994;50:258–265. doi: 10.1095/biolreprod50.2.258. [DOI] [PubMed] [Google Scholar]
- Gratacos M, Nadal M, Martin-Santos R, Pujana MA, Gago J, Peral B, Armengol L, Ponsa I, Miro R, Bulbena A, Estivill X. A polymorphic genomic duplication on human chromosome 15 is a susceptibility factor for panic and phobic disorders. Cell. 2001;106:367–379. doi: 10.1016/s0092-8674(01)00447-0. [DOI] [PubMed] [Google Scholar]
- Gustafsson PO, Olsson SE, Kasström H, Wennman B. Skeletal development of Greyhounds, German Shepherd dogs and their crossbreed offspring. Acta Radiologica Suppl. 1975;344:81–108. [Google Scholar]
- Harcke HT, Grissom LE. Pediatric hip sonography. Diagnosis and differential diagnosis. Radiology Clinics of North America. 1999;37:787–796. doi: 10.1016/s0033-8389(05)70129-9. [DOI] [PubMed] [Google Scholar]
- Harris WH. Etiology of osteoarthritis of the hip. Clinical Orthopaedics. 1986;213:20–33. [PubMed] [Google Scholar]
- Henricson B, Norberg I, Olsson SE. On the etiology and pathogenesis of hip dysplasia: a comparative review. Journal of Small Animal Practice. 1966;7:673–888. doi: 10.1111/j.1748-5827.1966.tb04393.x. [DOI] [PubMed] [Google Scholar]
- Hoaglund FT, Healy JH. Osteoarthrosis and congenital dysplasia of the hip in family members of children who have congenital dysplasia of the hip. Journal of Bone and Joint Surgery - American. 1990;72:1510–1518. [PubMed] [Google Scholar]
- Jacobsen S, Sonne-Holm S. Hip dysplasia: a significant risk factor for the development of hip osteoarthritis. A cross-sectional survey. Rheumatology (Oxford) 2005;44:211–218. doi: 10.1093/rheumtology/keh436. [DOI] [PubMed] [Google Scholar]
- Janutta V, Hamann H, Distl O. Complex segregation analysis of canine hip dysplasia in German shepherd dogs. Journal of Heredity. 2006;97:13–20. doi: 10.1093/jhered/esi128. [DOI] [PubMed] [Google Scholar]
- Jiang C, Zeng ZB. Multiple trait analysis of genetic mapping for quantitative trait loci. Genetics. 1995;140:1111–1127. doi: 10.1093/genetics/140.3.1111. [DOI] [PMC free article] [PubMed] [Google Scholar]
- Kaneene JB, Mostosky UV, Padgett GA. Retrospective cohort study of changes in hip joint phenotype of dogs in the United States. Journal of the American Veterinary Medical Association. 1997;211:1542–1544. [PubMed] [Google Scholar]
- Karlsson EK, Baranowska I, Wade CM, Hillbertz NHCS, Zody MC, Anderson N, Biagi TM, Patterson N, Pielberg GR, Kulbokas EJ, Comstock KE, Keller ET, Mesirov JP, Euler HV, Kampe O, Hedhammar AH, Lander ES, Andersson G, Andersson L, Lindblad-Toh K. Efficient mapping of Mendelian traits in dogs through genome-wide association. Nature Genetics. 2007;39:1321–1328. doi: 10.1038/ng.2007.10. [DOI] [PubMed] [Google Scholar]
- Kealy RD, Lawler DF, Ballam JM, Lust G, Biery DN, Smith GK, Mantz SL. Evaluation of the effect of limited food consumption on radiographic evidence of osteoarthritis in dogs. Journal of the American Veterinary Medical Association. 2000;217:1678–1680. doi: 10.2460/javma.2000.217.1678. [DOI] [PubMed] [Google Scholar]
- Leighton EA, Linn JM, Willham RL, Castleberry MW. A genetic study of canine hip dysplasia. American Journal of Veterinary Research. 1977;38:241–244. [PubMed] [Google Scholar]
- Leighton EA. Genetics of canine hip dysplasia. Journal of the American Veterinary Medical Association. 1997;210:1474–1479. [PubMed] [Google Scholar]
- Lindblad-Toh K, et al. Genome sequence, comparative analysis and haplotype structure of the domestic dog. Nature. 2005;438:803–819. doi: 10.1038/nature04338. [DOI] [PubMed] [Google Scholar]
- Littell RC, Milliken GA, Stroup WW, Wolfinger RD. SAS system for mixed models. SAS Publishing; Carey NC USA: 1996. [Google Scholar]
- Lust G, Geary JC, Sheffy BE. Development of hip dysplasia in dogs. American Journal of Veterinary Research. 1973;34:87–91. [PubMed] [Google Scholar]
- Lust G, Williams AJ, Burton-Wurster N, Pijanowski GJ, Beck KA, Rubin G, Smith GK. Joint laxity and its association with hip dysplasia in Labrador retrievers. American Journal of Veterinary Research. 1993;54:1990–1999. [PubMed] [Google Scholar]
- Lust G. An overview of the pathogenesis of canine hip dysplasia. Journal of the American Veterinary Medical Association. 1997;210:1443–1445. [PubMed] [Google Scholar]
- Lust G, Todhunter RJ, Erb HN, Dykes NL, Williams AJ, Burton-Wurster NI, Farese JP. Comparison of three radiographic methods for diagnosis of hip dysplasia in eight-month-old dogs. Journal of the American Veterinary Medical Association. 2001a;219:1242–1246. doi: 10.2460/javma.2001.219.1242. [DOI] [PubMed] [Google Scholar]
- Lust G, Todhunter RJ, Erb HN, Dykes NL, Williams AJ, Burton-Wurster NI, Farese JP. Repeatability of dorsolateral subluxation scores in dogs and correlation with macroscopic appearance of hip osteoarthritis. American Journal of Veterinary Research. 2001b;62:1711–1715. doi: 10.2460/ajvr.2001.62.1711. [DOI] [PubMed] [Google Scholar]
- Mabuchi A, Nakamura S, Takatori Y, Ikegawa S. Familial osteoarthritis of the hip joint associated with acetabular dysplasia maps to chromosome 13q. American Journal of Human Genetics. 2006;79:163–168. doi: 10.1086/505088. [DOI] [PMC free article] [PubMed] [Google Scholar]
- Maki K, Liinamo AE, Ojala M. Estimates of genetic parameters for hip and elbow dysplasia in Finnish Rottweilers. Journal of Animal Science. 2000;78:1141–1148. doi: 10.2527/2000.7851141x. [DOI] [PubMed] [Google Scholar]
- Maki K, Janss LLG, Groen AF, Liinamo AE, Ojala M. An indication of major genes affecting hip and elbow dysplasia in four Finnish dog populations. Heredity. 2004;92:402–408. doi: 10.1038/sj.hdy.6800434. [DOI] [PubMed] [Google Scholar]
- Mateescu RG, Todhunter RJ, Lust G, Burton-Wurster N. Increased MIG-6 mRNA transcripts in osteoarthritic cartilage. Biochemical and Biophysical Research Communications. 2005;332:482–486. doi: 10.1016/j.bbrc.2005.04.144. [DOI] [PubMed] [Google Scholar]
- Morgan J, Wind A, Davidson A. Bone dysplasias in the Labrador retriever: a radiographic study. Journal of the American Animal Hospital Association. 1999;35:332–340. doi: 10.5326/15473317-35-4-332. [DOI] [PubMed] [Google Scholar]
- Ohlerth S, Busato A, Gaillard C, Fluckiger M, Lang J. Epidemiologic and genetic studies of canine hip dysplasia in a population of Labrador retrievers: a study over 25 years. Deutsche Tierärztliche Wochenschrift. 1998;105:378–383. [PubMed] [Google Scholar]
- Ohlerth S, Lang J, Busato A, Gaillard C. Estimation of genetic population variables for six radiographic criteria of hip dysplasia in a colony of Labrador Retrievers. American Journal of Veterinary Research. 2001;62:846–852. doi: 10.2460/ajvr.2001.62.846. [DOI] [PubMed] [Google Scholar]
- Patterson HD, Thompson R. Recovery of inter-block information when block sizes are unequal. Biometrika. 1971;58:545–554. [Google Scholar]
- Puerto DA, Smith GK, Gregor TP, LaFond E, Conzemius MG, Cabell LW, McKelvie PJ. Relationships between results of the Ortolani method of hip joint palpation and distraction index, Norberg angle, and hip score in dogs. Journal of American Veterinary Medical Association. 1999;214:497–501. [PubMed] [Google Scholar]
- Sapp RL, Rekaya R, Misztal I, Wing T. Longitudinal multiple-trait versus cumulative single-trait analysis of male and female fertility and hatchability in chickens. Poultry Science. 2005;84:1010–1014. doi: 10.1093/ps/84.7.1010. [DOI] [PubMed] [Google Scholar]
- Shmulewitz D, Heath SC. Genome scans for Q1 and Q2 on general population replicates using loki. Genetics Epidemiology. 2001;21 Suppl 1:S686–691. doi: 10.1002/gepi.2001.21.s1.s686. [DOI] [PubMed] [Google Scholar]
- Smith GK, LaFond E, Gregor TP, Lawler DF, Nie RC. Within- and between-examiner repeatability of distraction indices of the hip joints in dogs. American Journal of Veterinary Research. 1997;58:1076–1077. [PubMed] [Google Scholar]
- Sollazzo V, Bertolani G, Calzolari E, Atti G, Scapoli C. A two-locus model for non-syndromic congenital dysplasia of the hip (CDH) Annals of Human Genetics. 2000;64:51–59. doi: 10.1017/S0003480000007958. [DOI] [PubMed] [Google Scholar]
- Sutter NB, Ostrander EA. Dog star rising: the canine genetic system. Nature Reviews Genetics. 2004;5:900–910. doi: 10.1038/nrg1492. [DOI] [PubMed] [Google Scholar]
- Sutter NB, Bustamante CD, Chase K, Gray MM, Zhao K, Zhu L, Padhukasahasram B, Karlins E, Davis S, Jones PG, Quignon P, Johnson GS, Parker HG, Fretwell N, Mosher DS, Lawler DF, Satyaraj E, Nordborg M, Lark KG, Wayne RK, Ostrander EA. A single IGF1 allele is a major determinant of small size in dogs. Science. 2007;316:112–115. doi: 10.1126/science.1137045. [DOI] [PMC free article] [PubMed] [Google Scholar]
- Swenson L, Audell L, Hedhammar A. Prevalence and inheritance of and selection for hip dysplasia in seven breeds of dogs in Sweden and benefit: cost analysis of a screening and control program. Journal of American Veterinary Medical Association. 1997;210:207–214. [PubMed] [Google Scholar]
- Todhunter RJ, Zachos TA, Gilbert RO, Erb HN, Williams AJ, Burton-Wurster N, Lust G. Onset of epiphyseal mineralization and growth plate closure in radiographically normal and dysplastic Labrador retrievers. Journal of the American Veterinary Medical Association. 1997;210:1458–1462. [PubMed] [Google Scholar]
- Todhunter RJ, Acland GM, Olivier M, Williams AJ, Vernier-Singer M, Burton-Wurster N, Farese JP, Grohn YT, Gilbert RO, Dykes NL, Lust G. An outcrossed canine pedigree for linkage analysis of hip dysplasia. Journal of Heredity. 1999;90:83–92. doi: 10.1093/jhered/90.1.83. [DOI] [PubMed] [Google Scholar]
- Todhunter RJ, Bliss SP, Casella G, Wu R, Lust G, Burton-Wurster NI, Williams AJ, Gilbert RO, Acland GM. Genetic structure of susceptibility traits for hip dysplasia and microsatellite informativeness of an outcrossed canine pedigree. Journal of Heredity. 2003a;94:39–48. doi: 10.1093/jhered/esg006. [DOI] [PubMed] [Google Scholar]
- Todhunter RJ, Casella G, Bliss SP, Lust G, Williams AJ, Hamilton S, Dykes NL, Yeager AE, Gilbert RO, Burton-Wurster NI, Mellersh CC, Acland GM. Power of a labrador retriever-greyhound pedigree for linkage analysis of hip dysplasia and osteoarthritis. American Journal of Veterinary Research. 2003b;64:418–424. doi: 10.2460/ajvr.2003.64.418. [DOI] [PubMed] [Google Scholar]
- Todhunter RJ, Grohn YT, Bliss SP, Wilfand A, Williams AJ, Vernier-Singer M, Burton-Wurster NI, Dykes NL, Wu R, Casella G, Acland GM, Lust G. Evaluation of multiple radiographic predictors of cartilage lesions in the hip joints of eight-month-old dogs. American Journal of Veterinary Research. 2003c;64:1472–1478. doi: 10.2460/ajvr.2003.64.1472. [DOI] [PubMed] [Google Scholar]
- Todhunter RJ, Mateescu R, Lust G, Burton-Wurster NI, Dykes NL, Bliss SP, Williams AJ, Vernier-Singer M, Corey E, Harjes C, Quaas RL, Zhang Z, Gilbert RO, Volkman D, Casella G, Wu R, Acland GM. Quantitative trait loci for hip dysplasia in a cross-breed canine pedigree. Mammalian Genome. 2005;16:720–730. doi: 10.1007/s00335-005-0004-4. [DOI] [PubMed] [Google Scholar]
- Treble NJ, Jensen FO, Bankier A, Rogers JG, Cole WG. Development of the hip in multiple epiphyseal dysplasia. Natural history and susceptibility to premature osteoarthritis. Journal of Bone and Joint Surgery. 1990;72:1061–1064. doi: 10.1302/0301-620X.72B6.2246289. [DOI] [PubMed] [Google Scholar]
- Ventura M, Mudge JM, Palumbo V, Burn S, Blennow E, Pierluigi M, Giorda R, Zuffardi O, Archidiacono N, Jackson MS, Rocchi M. Neocentromeres in 15q24–26 map to duplicons which flanked an ancestral centromere in 15q25. Genome Research. 2003;13:2059–2068. doi: 10.1101/gr.1155103. [DOI] [PMC free article] [PubMed] [Google Scholar]
- Weinstein SL. Developmental hip dysplasia and dislocation. In: Morrisy RT, Weinstein SL, editors. Lovell and Winter’s Pediatric Orthopedics. Lippincott-Raven; Philadelphia, USA: 1996. pp. 903–950. [Google Scholar]
- Willis MB. Genetics of the Dog. Howell Book House; New York, USA: 1989. Hip dysplasia; pp. 144–179. [Google Scholar]
- Wood JL, Lakhani KH, Dennis R. Heritability and epidemiology of canine hip-dysplasia score in flat-coated retrievers and Newfoundlands in the United Kingdom. Preventive Veterinary Medicine. 2000a;46:75–86. doi: 10.1016/s0167-5877(00)00140-9. [DOI] [PubMed] [Google Scholar]
- Wood JL, Lakhani KH, Dennis R. Heritability of canine hip-dysplasia score and its components in Gordon setters. Preventive Veterinary Medicine. 2000b;46:87–97. doi: 10.1016/s0167-5877(00)00141-0. [DOI] [PubMed] [Google Scholar]
- Zhang W, Smith C. Computer simulation of marker-assisted selection utilizing linkage disequilibrium. Theoretical and Applied Genetics. 1992;83:813–820. doi: 10.1007/BF00226702. [DOI] [PubMed] [Google Scholar]
- Zhang W, Smith C. Simulation of marker-assisted selection utilizing linkage disequilibrium: The effects of several additional factors. Theoretical and Applied Genetics. 1993;86:492–496. doi: 10.1007/BF00838565. [DOI] [PubMed] [Google Scholar]
- Zhu L, Zhang Z, Feng F, Schweitzer P, Phavaphutanon J, Vernier-Singer M, Corey E, Friedenberg S, Mateescu R, Williams A, Lust G, Acland G, Todhunter R. Single nucleotide polymorphisms refine QTL intervals for hip joint laxity in dogs. Animal Genetics. 2008;39:141–146. doi: 10.1111/j.1365-2052.2007.01691.x. [DOI] [PubMed] [Google Scholar]


